Updated February 2020.
Markets ebb and flow; they advance, decline and consolidate.
Traders construct a framework around market fluctuations using support and resistance, the underpinning of technical analysis.
Determining support and resistance, however, is trader dependent, often leaving newer traders overwhelmed.
Perhaps the most prevalent method of identifying support and resistance is from traditional swing highs and lows. Yet, moving averages, psychological levels, trend and channel lines are also popular and dependable.
According to research, determining support and resistance by way of yearly, monthly and weekly opening values is not a widely used technique. Don’t let this deter you, though. These levels are incredibly reliable.
Yearly, Monthly and Weekly Opening Points?
Yearly, monthly and weekly price points are extended into the future from the opening candle of each year, month and week.
The levels can then be used as support/resistance on the minute chart right up to the monthly timeframe.
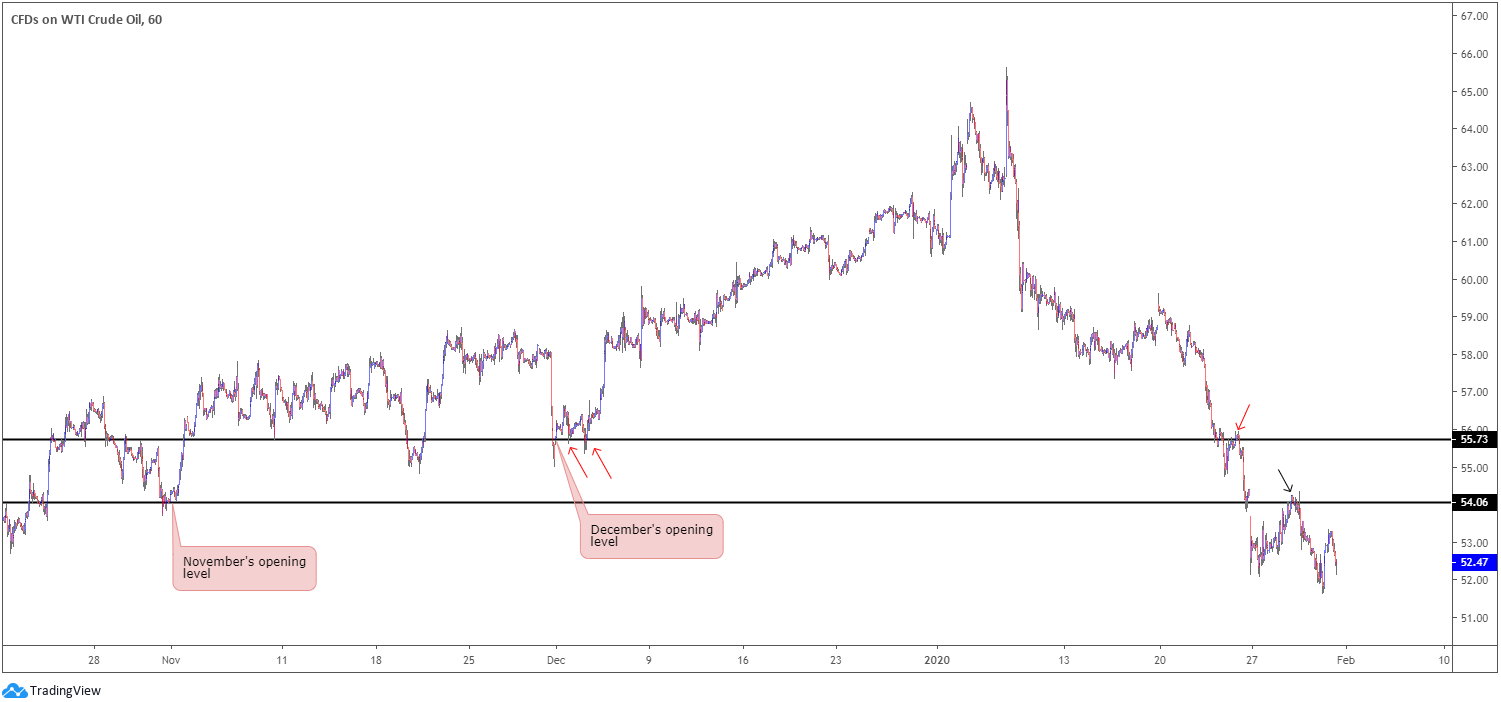
Figure 1.1 shows two monthly opening values plotted on WTI’s hourly timeframe, taken from November and December 2019.
November’s opening level at $54.06/bbl entered the fray once engulfed as a support in late January and retested as resistance (black arrow). December’s opening level at $55.73/bbl held as support shortly after forming (two red arrows). It was also respected again as resistance in January (red arrow [right]).
(FIGURE 1.1)
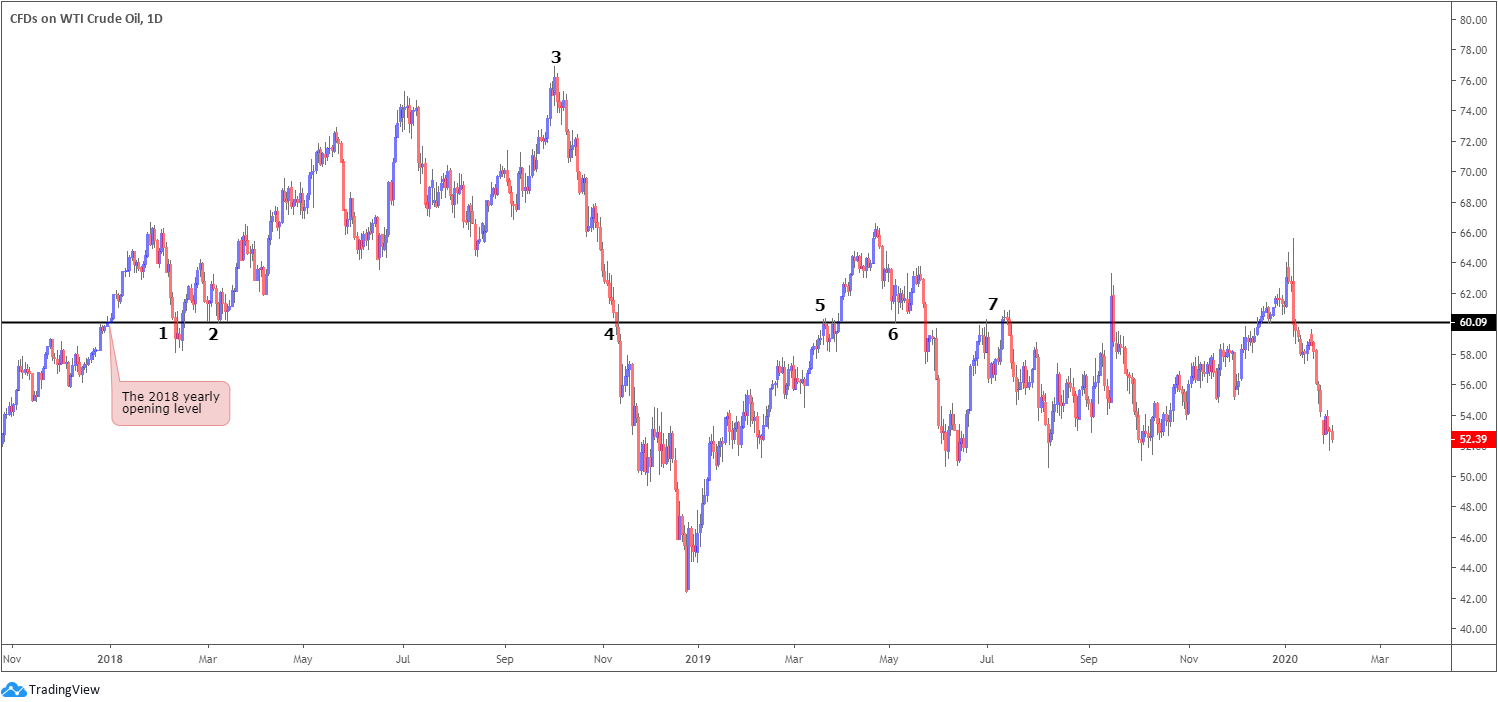
Figure 1.2 illustrates a longer-term level at $60.09/bbl on WTI’s daily timeframe, extended from the 2018 yearly opening level.
Initially, the level failed to offer support in early February 2018 (1), though served well as a ‘floor’ in March (2) and advanced to a peak of $76.88/bbl in early October (3). Modest resistance occurred in March of 2019 (5), after failing to provide support in November 2018 (4), and held reasonably well as support in May 2019 (6), and once again as resistance mid-2019 (7).
(FIGURE 1.2)
The Psychology
When the year, month or week concludes, traders cover, alter and open new positions. Order swapping occurs and unfilled orders are often left behind. An unfilled order is an order left unfilled around a price region from traders who were unable to realise their desired fill price. However, this by no means guarantees a level will hold; it’s impossible to decipher whether an area garnered sufficient interest in the past to justify a rebound. You could argue this would be similar psychological form observed at notable support and resistance levels, supply and demand zones, trend lines and prominent moving averages such as the 200-day SMA.
Using Opening Levels in Your Trading
While there’s a myriad of techniques available involving opening levels, two strategies have stood the test of time and remain a favourite.
Level convergence:
Level convergence involves locating two or more opening points that merge. This confluence can lead to greater accuracy and profitability.
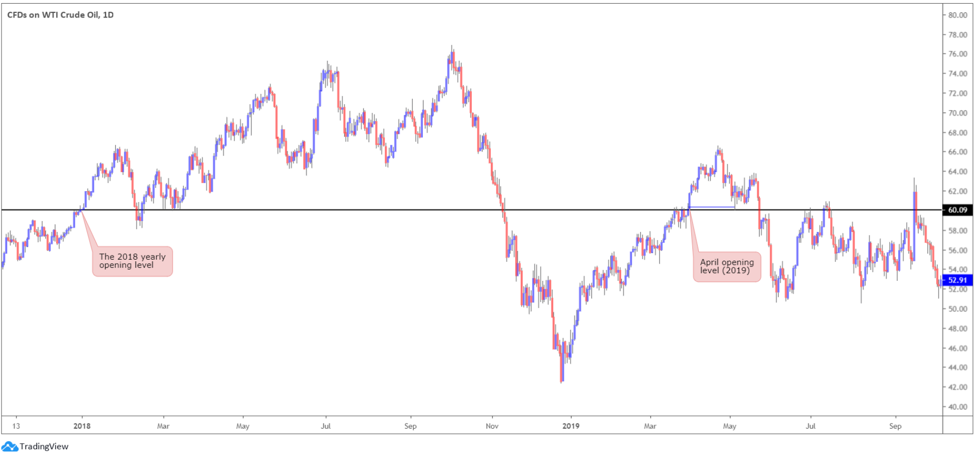
As an example, figure 1.3, the WTI daily chart, shows the 2018 yearly opening level at $60.09/bbl and April’s opening level for 2019 at $60.35/bbl.
(FIGURE 1.3)
Figure 1.4 shows both levels converging closely, forming a tight support area (green) between $60.09/$60.35/bbl (this works just as effectively for resistance areas). The two levels held price action higher, topping at around highs of $63.79/bbl a few weeks later.
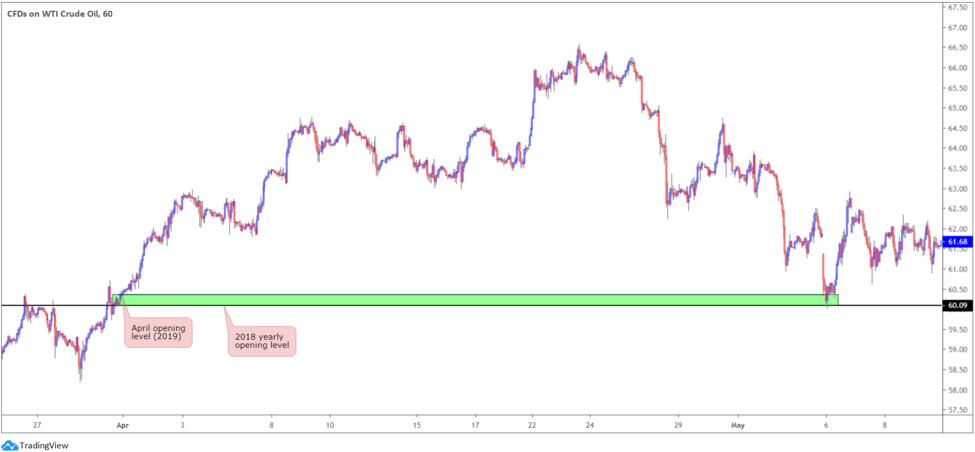
(FIGURE 1.4)
Trend line convergence:
The intersection of a trend line at a weekly, monthly or even yearly opening level can produce fast and profitable reactions. Figure 1.5, the AUD/USD H1 chart, illustrates September’s opening level for 2019 at 0.6724, which intersects closely with a local trend line resistance-turned support, taken from the high 0.6765.
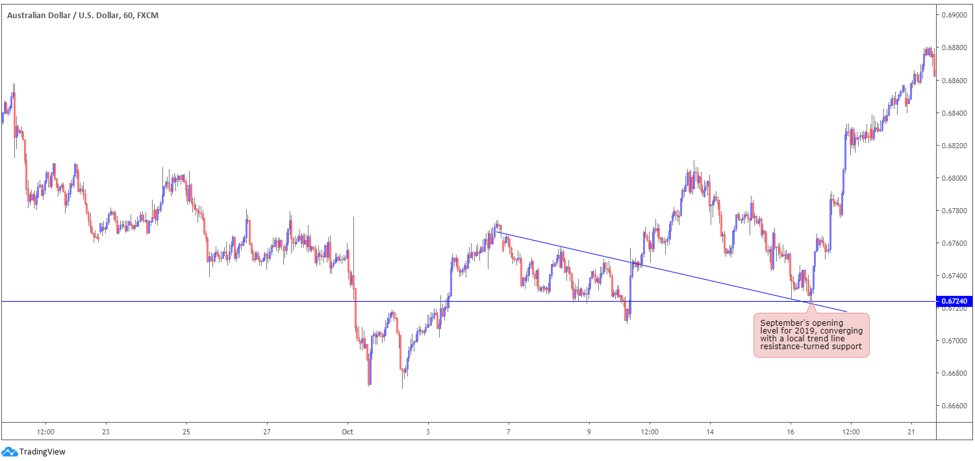
(FIGURE 1.5)
Figure 1.6, a H4 USD/CAD chart, shows November’s opening level at 1.3168 offered modest resistance in early November and swiftly reverted to support a couple of days later. Heading into early December, the level held price higher once more, though after giving way resistance was seen. The area highlighted in green shows price connected with the underside of the monthly opening level and a trend line resistance, extended from the high 1.3320. What’s also notable from a technical perspective is the retest formed by way of a shooting star candlestick pattern (considered a bearish signal). Note also price tested the same monthly opening level in late January of 2020, which aligned with a trend line support-turned resistance, drawn from the low 1.3042 (yellow), offering a modest reaction to the downside.
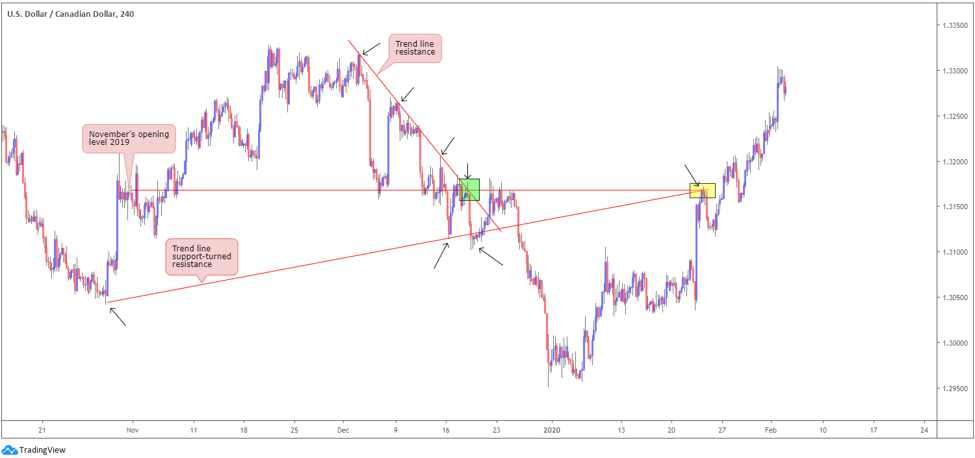
(FIGURE 1.6)
If you enjoyed this:
You might also enjoy the following related articles:
- For trading wishing to understand basic chart patterns, this article may be of use.
- Basic Market Structure in the Forex Market.
- More about support and resistance can be found here and here.
For newer traders, you may find our demo trading facilities a useful resource. It’s free to open and supports all account types, platforms and products.