
DXY:
The DXY (US Dollar Index) chart demonstrates a bearish momentum, supported by the fact that the price is currently below a significant descending trend line, indicating the potential for further bearish movement.
Considering this bearish scenario, there is a possibility for a continuation of the downward trend towards the first support level at 102.80. This level holds importance as it coincides with a 50% Fibonacci retracement level and acts as an overlap support level.
In the event of a further decline, the second support level at 102.24 can be seen as another relevant area of support, also functioning as an overlap support level.
On the other hand, if a reversal were to occur, the first resistance level at 104.39 serves as a significant obstacle, representing an overlap resistance level.
Additionally, there is an intermediate resistance level at 103.49, which acts as a pullback resistance, potentially impeding any upward movement.
Conversely, if the price were to experience a pullback, the intermediate support level at 103.03 could provide a temporary area of support.

EUR/USD:
The EUR/USD chart is currently exhibiting bullish momentum, indicating an overall positive bias in price movement.
There is a potential for a bullish continuation towards the first resistance level at 1.0822, which is a significant area of overlap resistance. This level is further supported by the presence of a 38.20% Fibonacci retracement, making it a crucial level to watch for potential price resistance.
In case of a pullback, the first support level at 1.0739 acts as an important area of support, representing an overlap support level.
Similarly, the second support level at 1.0671 can be considered as another area of support, functioning as an overlap support level.
If the price were to sustain its upward momentum, the second resistance level at 1.0901 might act as a point of resistance, representing a pullback resistance level.
Additionally, there is an intermediate support level at 1.0759, which could provide temporary support during minor price retracements.

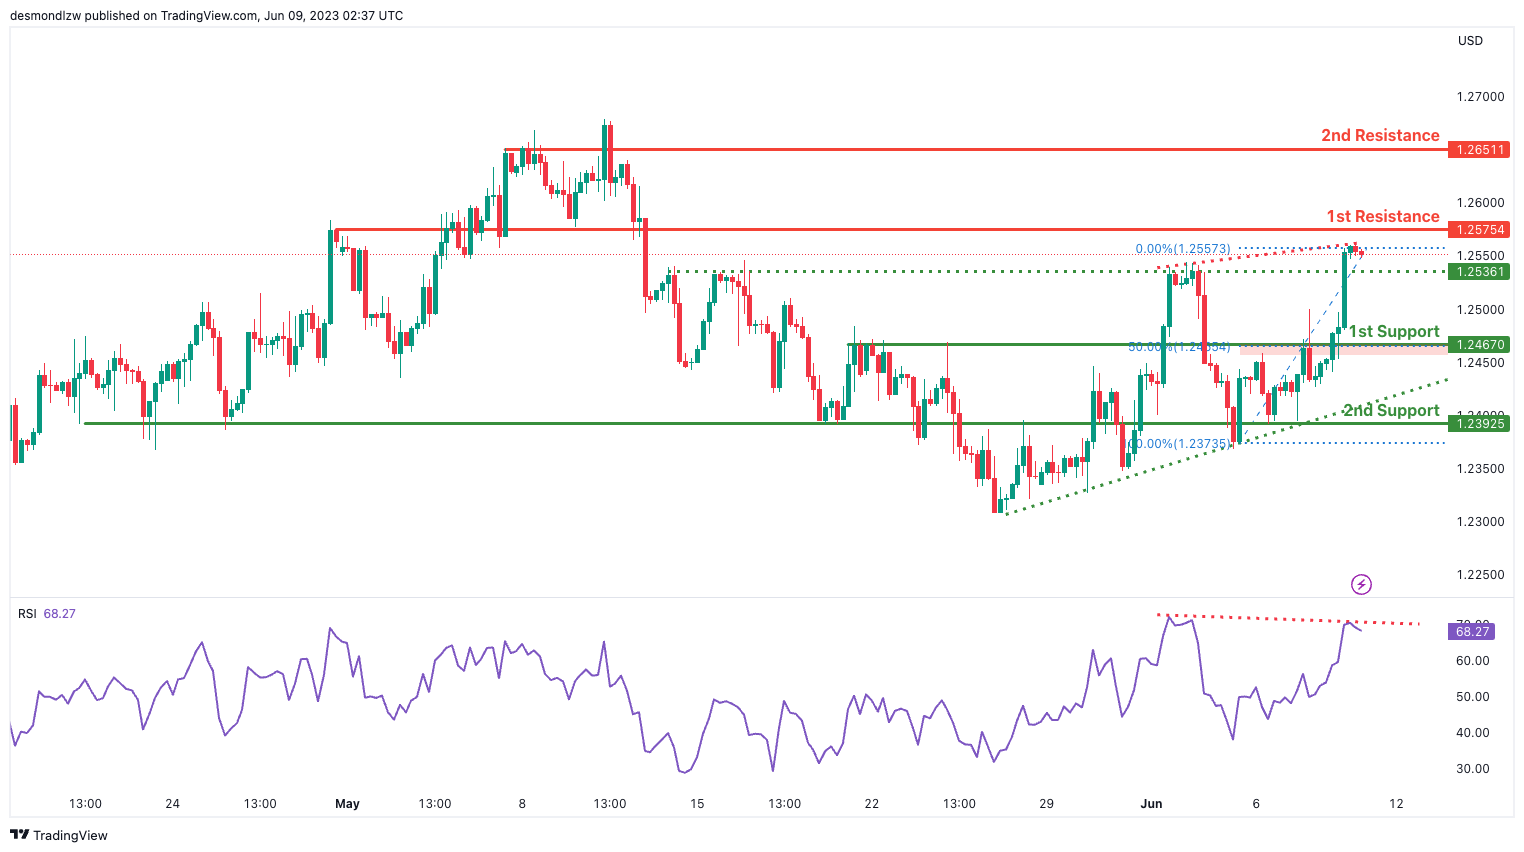
GBP/USD:
The GBP/USD chart currently shows bearish momentum, indicating a downward bias in price movement.
Despite the overall bearish momentum, it is worth noting that the price is above a major ascending trend line, which suggests the potential for further bullish momentum in the future.
In the short term, there is a possibility for the price to drop further towards the first support level at 1.2467 before potentially bouncing back and rising towards the first resistance at 1.2575.
The first support level at 1.2467 is significant as it coincides with a pullback support level and the 50% Fibonacci retracement, making it a strong area of support to watch.
If the price continues to decline, the second support level at 1.2392 can be considered as an additional area of support, representing an overlap support level.
On the upside, the first resistance level at 1.2575 acts as a pullback resistance, potentially causing the price to face selling pressure.
Similarly, the second resistance level at 1.2651 also acts as a pullback resistance, further reinforcing the potential for price reversal or a stall in upward movement.
It is worth noting that the RSI is displaying bearish divergence versus the price, indicating a potential reversal in the near future.
USD/CHF:
The USD/CHF chart currently exhibits bearish momentum, indicating a downward bias in price movement.
One of the factors contributing to this bearish momentum is the break below an ascending support line, which has triggered a potential bearish move.
In terms of potential price action, there is a possibility for the price to continue its bearish continuation towards the first support level at 0.8954.
The first support level at 0.8954 is significant as it represents an overlap support level, suggesting that it has previously acted as a support level and may do so again in the future.
If the bearish momentum persists, the second support level at 0.8866 can be considered as an additional area of support, also representing an overlap support level.
On the upside, the first resistance level at 0.9023 acts as a pullback resistance, potentially causing the price to face selling pressure.
Similarly, the second resistance level at 0.9117 represents an overlap resistance level, further reinforcing the potential for price reversal or a stall in upward movement.

USD/JPY:
The USD/JPY chart currently demonstrates bullish momentum, indicating a positive bias in price movement.
There is a potential for a bullish continuation towards the first resistance level at 140.23.
The first support level at 138.79 is considered significant as it represents an overlap support level, indicating that it has previously acted as a support level and may provide support again in the future.
Additionally, the second support level at 137.71 is another overlap support level, further reinforcing its potential as a reliable area of support.
On the upside, the first resistance level at 140.23 is a multi-swing high resistance, suggesting that it has previously acted as a significant barrier to upward price movement.
Furthermore, the second resistance level at 140.89 is a swing high resistance, indicating its historical relevance in halting price advances.

USD/CAD:
The USD/CAD chart currently exhibits bullish momentum, indicating a positive bias in price movement.
There is a potential for a bullish continuation towards the first resistance level at 1.3411.
The first support level at 1.3323 is significant as it represents a multi-swing low support, suggesting its historical importance as a level where buying interest has been observed.
Additionally, the second support level at 1.3279 is an overlap support, further reinforcing its potential as a reliable area of support.
On the upside, the first resistance level at 1.3411 is an overlap resistance, indicating that it has previously acted as a barrier to upward price movement. This level also coincides with the 23.60% Fibonacci retracement level, adding to its significance.
Furthermore, the second resistance level at 1.3347 is another overlap resistance, implying its historical relevance in limiting price advances. This level coincides with the 38.20% Fibonacci retracement level, providing additional confirmation.
Moreover, the bullish divergence observed in the RSI (Relative Strength Index) versus price indicates a potential reversal or increase in bullish momentum. This further supports the likelihood of a rapid incline in price.

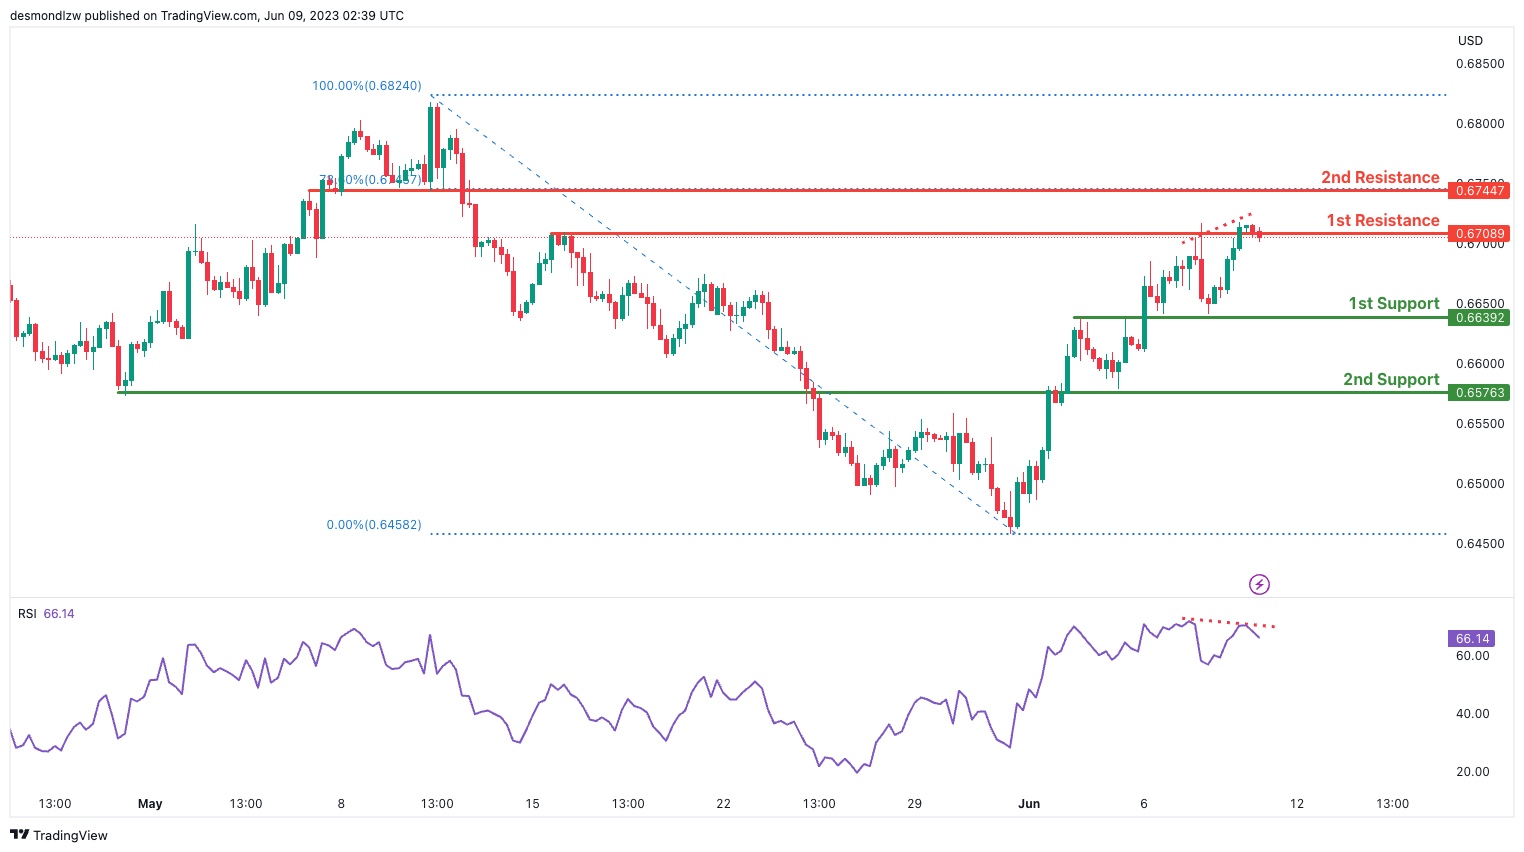
AUD/USD:
The AUD/USD chart currently exhibits bearish momentum, indicating a negative bias in price movement.
There is a potential for a bearish reaction off the first resistance level at 0.6708, leading to a drop towards the first support level at 0.6639.
The first support level at 0.6639 is an overlap support, indicating its historical significance as a level where buying interest has been observed in the past.
Similarly, the second support level at 0.6576 is another overlap support, further emphasizing its potential as a reliable area of support.
On the upside, the first resistance level at 0.6708 is a multi-swing high resistance, suggesting its historical importance in limiting upward price movements.
Furthermore, the second resistance level at 0.6744 is a pullback resistance and coincides with the 78.60% Fibonacci retracement level, adding to its significance as a potential barrier for price advances.
In addition, the bearish divergence observed in the RSI (Relative Strength Index) versus price suggests a possible reversal in the near future. This further supports the likelihood of a potential shift in momentum.
NZD/USD
The NZD/USD chart currently demonstrates bearish momentum, suggesting a negative bias in price movement.
There is a potential for a bearish continuation towards the first support level at 0.6031.
The first support level at 0.6031 is an overlap support, indicating its historical significance as a level where buying interest has been observed in the past.
Additionally, the second support level at 0.5991 is a multi-swing low support, further reinforcing its potential as a strong area of support.
On the upside, the first resistance level at 0.6096 is an overlap resistance, highlighting its historical importance in limiting upward price movements.
Furthermore, the second resistance level at 0.6143 demonstrates a Fibonacci confluence, as it coincides with both the 50% Fibonacci retracement level and the 78.60% Fibonacci projection level. This reinforces its significance as a potential area of resistance.

DJ30:
The DJ30 chart currently exhibits weak bearish momentum with low confidence, indicating a lack of strong directional bias in the market.
There is a potential for a bearish reaction off the first resistance level at 33816.50, which is an overlap resistance. This level has historically acted as a barrier to upward price movements.
On the downside, the first support level at 33347.95 is a pullback support, coinciding with the 38.20% Fibonacci retracement level. This level has the potential to provide a temporary bounce or reversal in price.
Additionally, the second support level at 33120.22 is a pullback support, aligning with the 61.80% Fibonacci retracement level. It further reinforces the potential for price to find support and reverse its downward momentum.
It is important to note that the overall momentum in the DJ30 chart is weak, indicating a lack of strong conviction in the bearish bias

GER30:
The GER30 chart currently demonstrates bearish momentum, supported by the fact that the price is below a major descending trend line, indicating the potential for further bearish movement.
There is a possibility of a bearish continuation towards the first support level at 15660.68. This level is an overlap support, meaning it has previously acted as a significant level of price support.
Additionally, the second support level at 15493.49 is another overlap support, further reinforcing its potential as a level where price may find support and potentially reverse its downward momentum.
On the upside, the first resistance level at 16073.65 is an overlap resistance, which has historically acted as a barrier to upward price movements.
Furthermore, the second resistance level at 16297.65 is a swing high resistance, indicating its significance in impeding further upward movement.
In between these levels, there is an intermediate support at 15819.28, which is a pullback support and aligns with the 61.80% Fibonacci retracement level. This level adds further weight to its potential as a level where price may find support and reverse its bearish momentum.

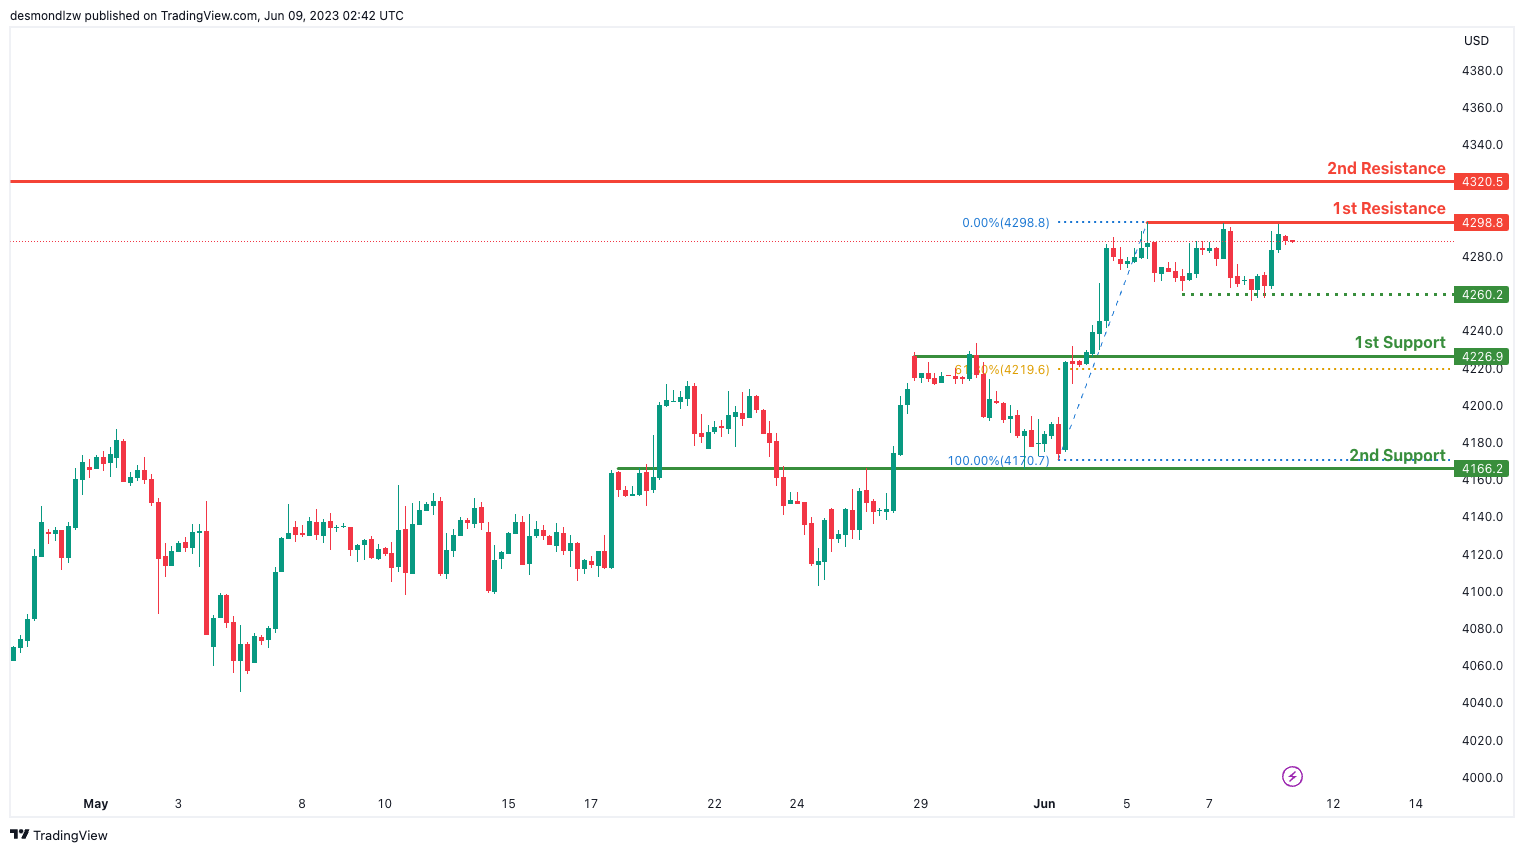
US500
The US500 chart is currently experiencing a neutral momentum, with no clear trend direction evident.
Price has the potential to fluctuate between the first resistance level at 4298.8 and the first support level at 4226.9.
The first support level at 4226.9 is an overlap support, indicating its historical significance as a level where price has previously found support.
Similarly, the second support level at 4166.2 is another overlap support level, further reinforcing its potential as a level where price may find support and reverse any downward movement.
On the upside, the first resistance level at 4298.8 is a multi-swing high resistance, suggesting its significance in hindering upward price movements.
Furthermore, the second resistance level at 4320.5 is a swing high resistance, indicating its potential to impede further upward movement.
In between these levels, there is an intermediate support at 4260.2, which is a multi-swing low support and aligns with the 61.80% Fibonacci retracement level. This level adds further weight to its potential as a level where price may find support and reverse its short-term downward momentum.
BTC/USD:
The BTC/USD chart is currently experiencing a neutral momentum, with no clear trend direction evident.
Price has the potential to fluctuate between the first resistance level at 27457 and the first support level at 26118.
The first support level at 26118 is an overlap support, indicating its historical significance as a level where price has previously found support.
Similarly, the second support level at 25607 is a multi-swing low support, further reinforcing its potential as a level where price may find support and reverse any downward movement.
On the upside, the first resistance level at 27457 is an overlap resistance, suggesting its significance in hindering upward price movements.
Furthermore, the second resistance level at 28158 is a multi-swing high resistance, indicating its potential to impede further upward movement.
Additionally, the chart pattern observed is a symmetrical triangle, which represents a period of consolidation before the price is forced to breakout or breakdown. A break above the upper trendline of the pattern could signal a bullish breakout, while a break below the lower trendline might indicate a bearish breakdown. Traders should closely monitor the price action within this pattern for potential breakout or breakdown signals.

ETH/USD:
The ETH/USD chart is currently showing a bearish momentum, indicating a downward trend in price.
There is a potential for a bearish continuation towards the first support level at 1804.84. This support level is significant as it is a multi-swing low support and coincides with the 78.60% Fibonacci retracement level, suggesting its importance in providing potential price support.
In addition, the second support level at 1774.41 is also a multi-swing low support, further reinforcing its significance as a potential level where price could find support and reverse any downward movement.
On the upside, the first resistance level at 1919.65 is an overlap resistance, indicating its historical significance as a level where price has previously faced resistance.
Furthermore, the second resistance level at 1997.54 is a swing high resistance, suggesting its potential to impede further upward movement.

WTI/USD:
The WTI chart is currently displaying a bearish momentum, indicating a downward trend in price.
One of the contributing factors to this momentum is the break below an ascending support line, which has triggered a potential bearish move.
There is a possibility for a bearish break off the first support level at 70.62, which is an overlap support level. This support level holds significance as it has previously acted as a level where price found support. A break below this support level could potentially lead to a drop towards the second support level at 67.51, which is a multi-swing low support.
On the upside, the first resistance level at 74.37 is an overlap resistance, suggesting its historical significance as a level where price has faced resistance.
Additionally, the second resistance level at 76.66 is also an overlap resistance and coincides with the 61.80% Fibonacci retracement level. This resistance level holds importance as it signifies a potential area where price may encounter further resistance.

XAU/USD (GOLD):
The XAU/USD chart is currently displaying a bearish momentum, indicating a downward trend in price.
One of the factors contributing to this momentum is the price being below a major descending trend line. This suggests that bearish momentum is likely to continue.
There is a potential for a bearish continuation towards the first support level at 1937.01. This support level is significant as it has previously acted as a level where price found support.
The second support level at 1912.92 is also an overlap support level, further reinforcing its importance as a potential level for price to find support.
On the upside, the first resistance level at 1965.15 is a multi-swing high resistance level. This resistance level holds significance as it has historically acted as a level where price faced resistance.
Additionally, the second resistance level at 1981.70 is an overlap resistance level. This level may also provide resistance to the upward movement of price.

The accuracy, completeness and timeliness of the information contained on this site cannot be guaranteed. IC Markets does not warranty, guarantee or make any representations, or assume any liability regarding financial results based on the use of the information in the site.
News, views, opinions, recommendations and other information obtained from sources outside of www.icmarkets.com, used in this site are believed to be reliable, but we cannot guarantee their accuracy or completeness. All such information is subject to change at any time without notice. IC Markets assumes no responsibility for the content of any linked site.
The fact that such links may exist does not indicate approval or endorsement of any material contained on any linked site. IC Markets is not liable for any harm caused by the transmission, through accessing the services or information on this site, of a computer virus, or other computer code or programming device that might be used to access, delete, damage, disable, disrupt or otherwise impede in any manner, the operation of the site or of any user’s software, hardware, data or property.
