
Key risk events:
Canadian Employment Change and Unemployment Rate; US Average Hourly Earnings m/m; US Non-Farm Employment Change; US Unemployment Rate.
EUR/USD:
Volatility fell Thursday as US traders celebrated 4th July, leaving the EUR/USD ranging no more than 25 points, with dovish comments from ECB’s Rehn doing little to help the single currency. As markets head into Asia Pac hours, price action remains meandering beneath 1.13.
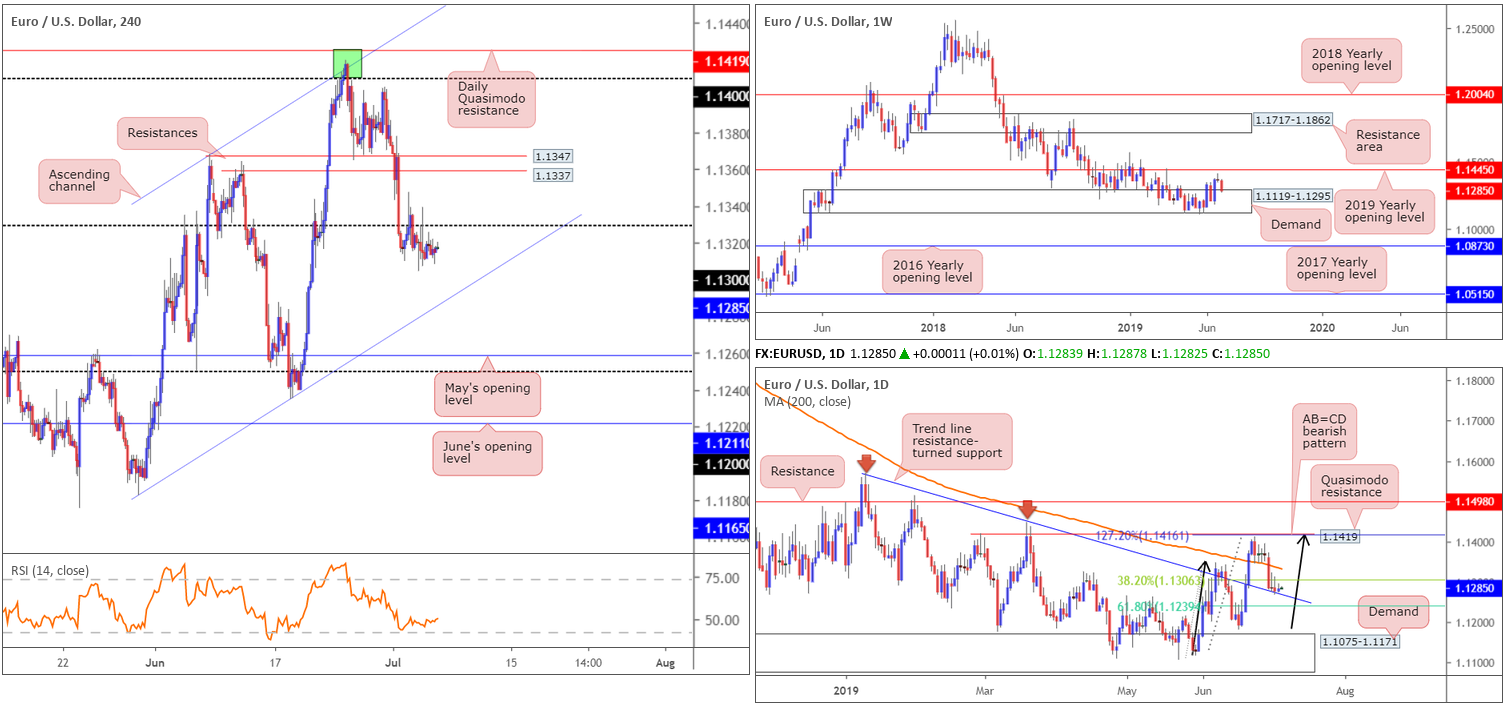
In the same vein as Thursday’s outlook, the research team notes an approach to the H4 channel support taken from the low 1.1116 could be on the cards. Levels of interest beyond here are May’s opening level drawn from 1.1211, closely tracked by the 1.12 handle. Indicator-based traders may also want to acknowledge the RSI is hovering just north of its oversold value, albeit with a mild bullish rise.
Higher-timeframe movement is also unchanged.
The weekly timeframe shows price action testing the top edge of a demand area coming in at 1.1119-1.1295, after failing to link with resistance at the 2019 yearly opening level drawn from 1.1445 last week. This displays signs of seller strength here.
On the daily timeframe, the pair recently touched gloves with a trend line resistance-turned support extended from the high 1.1569. This followed price action recently topping just ahead of a Quasimodo resistance at 1.1419 as well as its merging 127.2% AB=CD – black arrows – bearish pattern at 1.1416, and engulfing the 200-day SMA. Harmonic traders may also wish to note the 38.2% Fibonacci support value at 1.1306 (extended from legs A-D) was tested at the beginning of the week – considered the first take-profit target from the AB=CD formation. The next downside take-profit target is at the 61.8% Fibonacci value around 1.1239, assuming we overthrow the current trend line support first that is.
Areas of consideration:
As of current price, selling this market, although tempting after seeing 1.13 hold as resistance Wednesday, is a chancy move. Although weekly demand mentioned above at 1.1119-1.1295 exhibits signs of softness, the area has yet to be engulfed. Therefore, it is not a base one should overlook in terms of buying power just yet. Bolstering the said demand is also the daily timeframe. Not only are we testing a trend line resistance-turned support, we’re also in correction territory for AB=CD traders between 1.1239/1.1306.
On account of the above, the research team’s focus remains on the H4 channel support mentioned above (1.1116) as a potential buy zone today, as well as the 1.12/1.1211 combination seen just beneath it. Conservative traders may opt to wait for additional candlestick confirmation before pulling the trigger, as not only will this help identify buyer intent, it also provides entry and risk levels to work with as well.
From a fundamental perspective, US non-farm payrolls is due later on today and typically rattles markets. Consensus expects 162k payrolls to be added, rebounding from the disappointing 75k seen in May.
GBP/USD:
The British pound was uninspired Thursday against the buck, continuing to languish under 1.26 following the latest run of dismal UK PMIs, and downbeat remarks from BoE Governor Carney earlier in the week. Diminished trading volume was observed yesterday in response to US banks closing in observance of 4th July holiday.
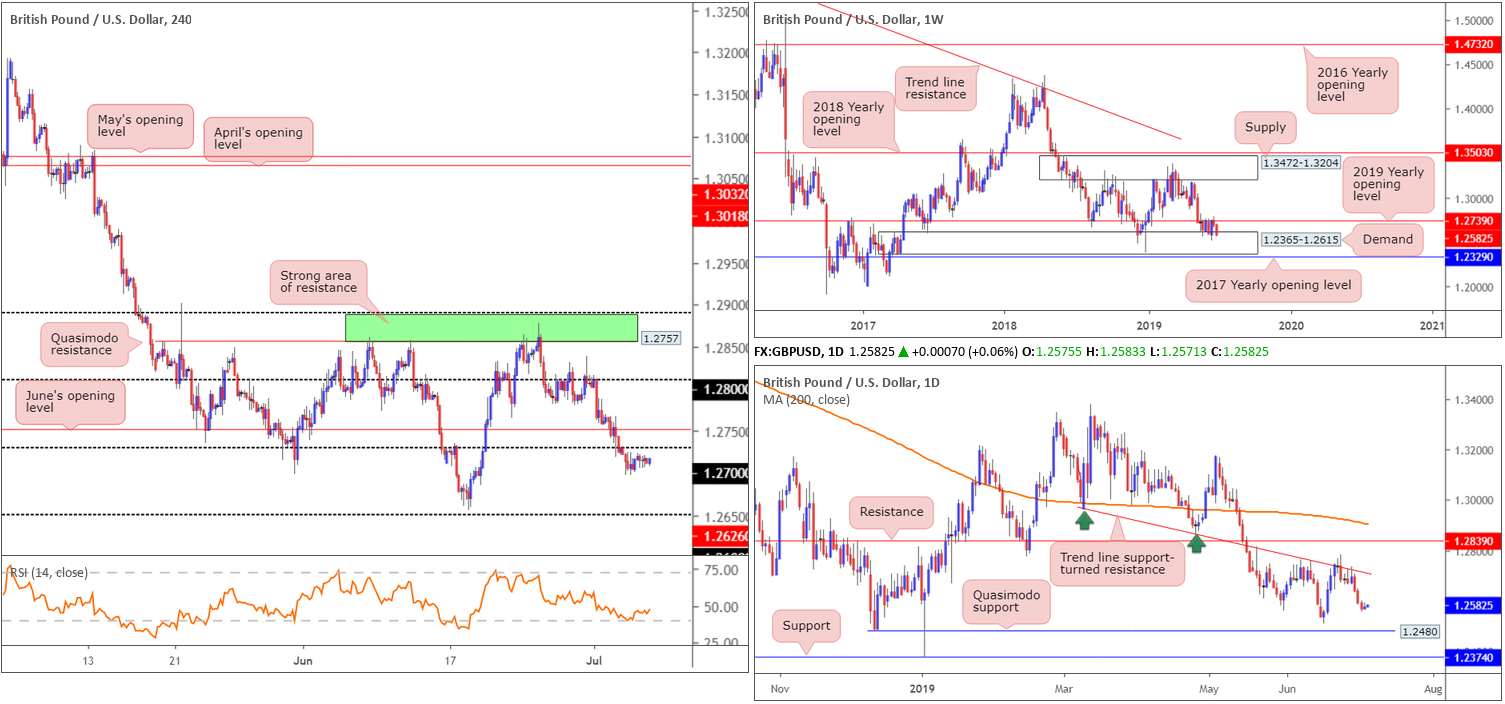
As underscored in Thursday’s technical briefing, 1.26 – applied to the H4 timeframe – could now potentially serve as resistance going forward with the next downside objective set around 1.25.
In terms of higher-timeframe flow, buyers and sellers remain warring for position between long-standing weekly demand at 1.2365-1.2615 and the 2019 yearly opening level at 1.2739. Areas outside of this border to be conscious of fall in around the 2017 yearly opening level at 1.2329 (weekly support) and weekly supply coming in at 1.3472-1.3204.
in light of recent selling, the weekly timeframe now trades at the top edge of the aforementioned demand area, thus buying may eventually ensue.
From the daily timeframe:
In tandem with the 2019 yearly opening level at 1.2739 on the weekly timeframe, daily movement concluded last week chalking up back-to-back bearish selling candles off the underside of a trend line support-turned resistance taken from the low 1.2960. A move lower has Quasimodo support at 1.2480 to target.
Areas of consideration:
While buyers may enter the fold from within the current weekly demand area at 1.2365-1.2615, selling the underside of the 1.26 handle on the H4 timeframe is still an option. This is bolstered by the fact space to press lower on the daily timeframe exists.
A retest at 1.26, in the shape of a bearish candlestick configuration – think shooting star pattern – coupled with room to press as far south as 1.25/1.2480 (see above in bold), is still certainly worthy of consideration. The idea behind needing additional candlestick confirmation at the underside of 1.26 is due to the current weekly demand base and psychological marks being prone to whipsaws, or sometimes referred to as ‘fakeouts’.
AUD/USD:
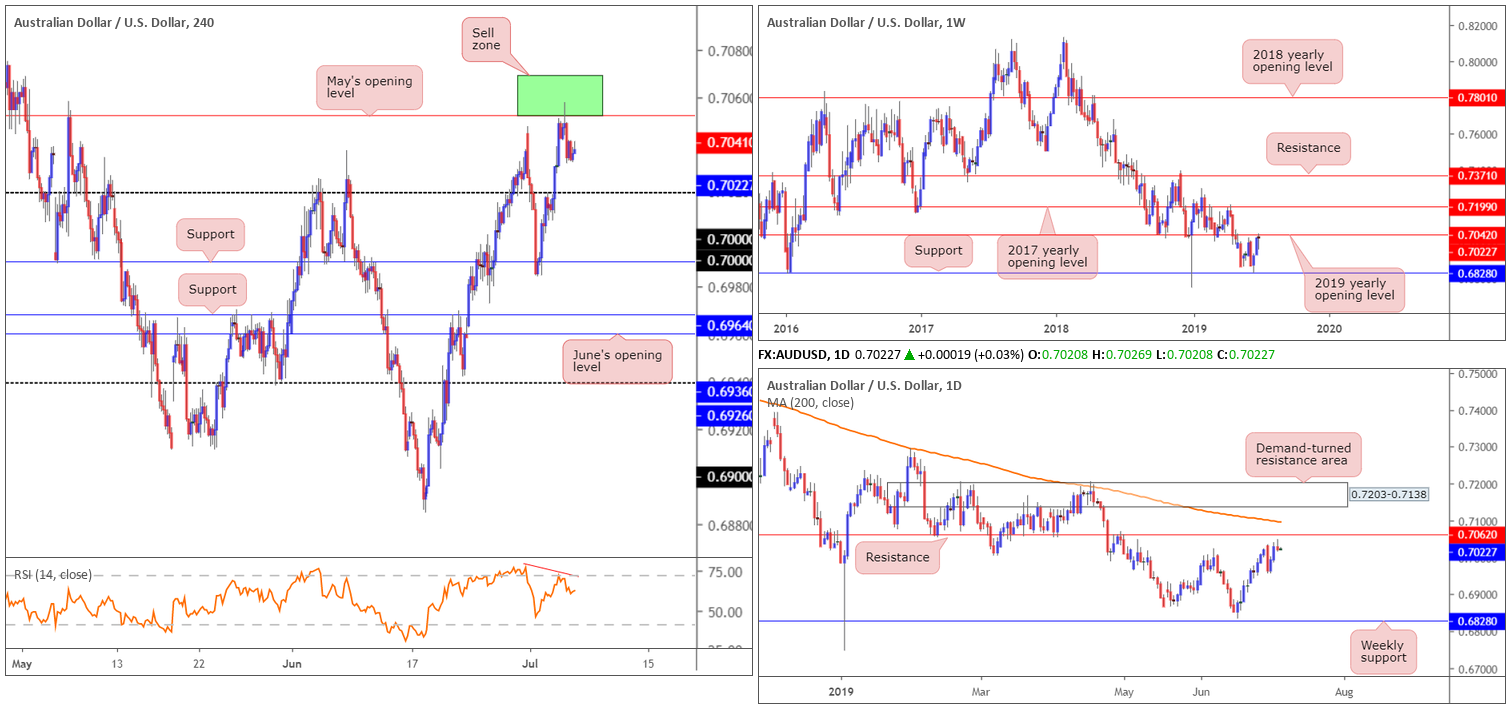
Australian retail sales increased modestly in May, though came in below consensus. The release generated a whipsaw motion into an interesting area of H4 resistance at 0.7062/0.7041 (green), visible as a half-hearted H1 shooting star bearish candlestick pattern, and curved lower. Volatility diminished going forward, however, as US banks were closed in observance of 4th July.
For traders who read Thursday’s technical briefing you may recall the rationale behind selecting the green H4 sell zone at 0.7062/0.7041:
- Buy stops above Monday’s high 0.7034 were triggered, therefore providing liquidity to sell into.
- May’s opening level applied to the H4 timeframe at 0.7041.
- Weekly resistance at 0.7042: the 2019 yearly opening level.
- Nearby resistance on the daily timeframe at 0.7062. Note yesterday’s action also chalked up a shooting star bearish candlestick pattern.
- The H4 RSI producing negative divergence (red line).
Areas of consideration:
The first downside target from 0.7062/0.7041 is seen at 0.70. Well done to any of our readers who managed to jump aboard this trading setup.
USD/JPY:
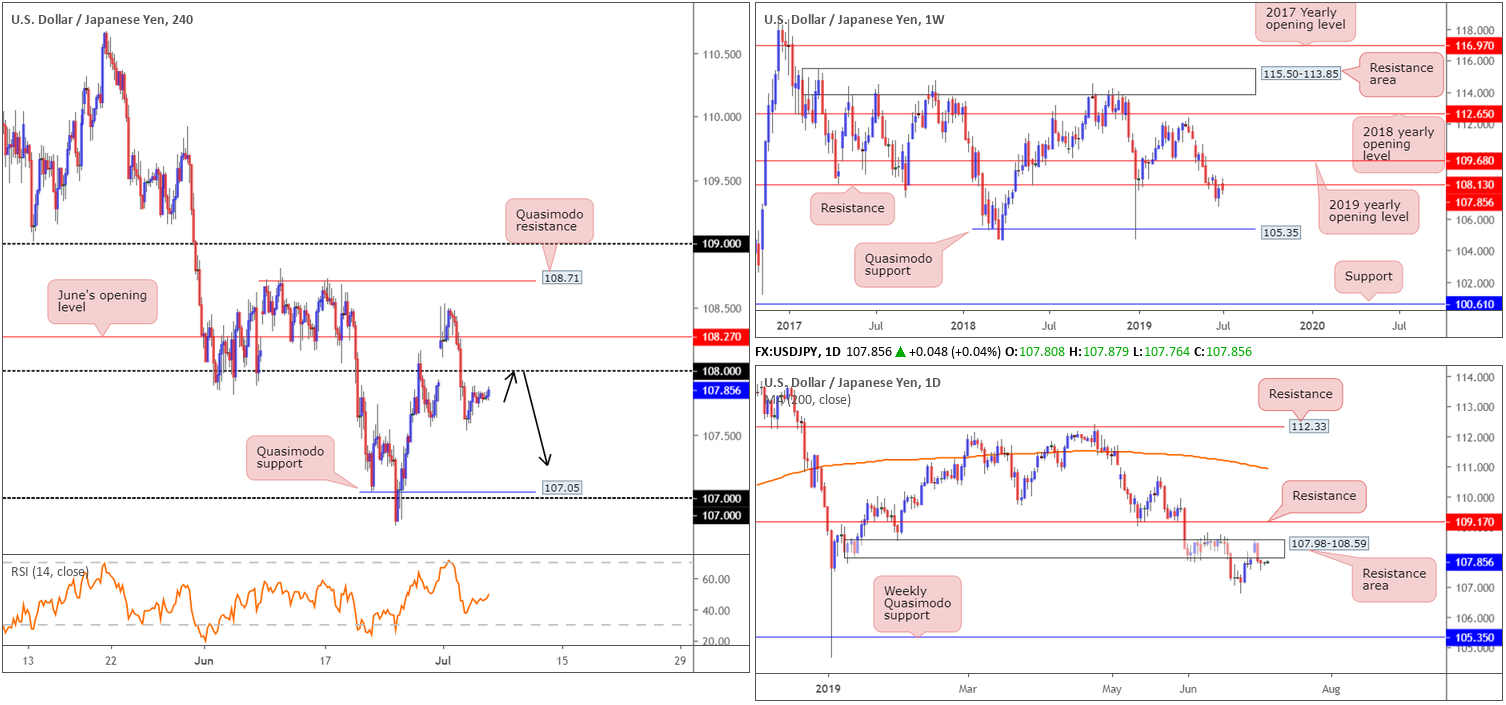
USD/JPY prices were all but unchanged Thursday in response to diminished volatility due to US banks closing in observance of 4th July holiday. Given yesterday’s lacklustre performance, the H4 candles remain languishing south of the 108 handle, after removed as support Tuesday. Beyond 108, traders’ crosshairs are likely fixed on June’s opening level at 108.27, whereas to the downside, apart from Wednesday’s low at 107.53, limited support is visible until a Quasimodo formation at 107.05.
Higher-timeframe analysis reveals weekly resistance at 108.13 remains in play. Having seen this level serve well as support in the past, this may encourage selling. Reinforcing the said weekly level is a daily resistance area at 107.98-108.59. At one point, it appeared as though this area was likely to give way, though at the top edge of the boundary a wave of selling emerged Tuesday. Aside from the 106.78 June 25 low, support is not visible on both weekly and daily timeframes until reaching weekly Quasimodo support at 105.35.
Areas of consideration:
As highlighted in Thursday’s technical outlook. additional selling could be in store.
An ideal scenario for a possible short play would be a retest of 108 as resistance. A retest of 108 in the shape of a H4 bearish candlestick signal – this is recommended to help identify seller intent and also provide traders entry and risk levels to work with – would, given the overall technical picture showing room to move lower, be considered a high-probability shorting opportunity, targeting 107.05 (the H4 Quasimodo support) as the initial take-profit zone.
USD/CAD:
Crude oil turned marginally lower Thursday amid lacklustre US holiday-induced trade, settling at $56.70/bbl. USD/CAD movement, although attempted to make headway, also concluded the day in negative territory, consequently registering its third consecutive daily loss.
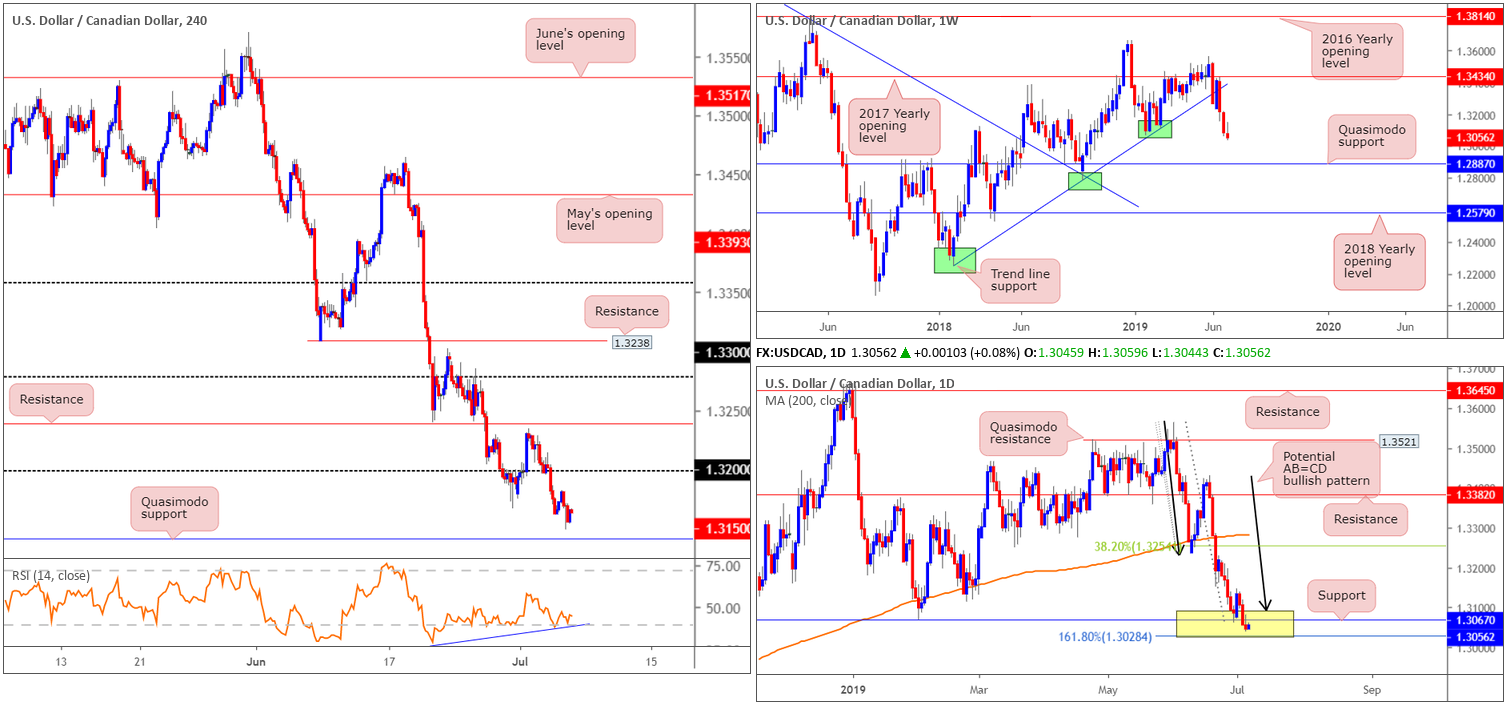
Despite losses, further selling could be in store, according to weekly structure displaying room to trade as far south as Quasimodo support at 1.2887. Contrary to this, daily price remains treading water within a potential buy zone between 1.3028/1.3089 (yellow) – comprised of an AB=CD (black arrows) formation at 1.3089, a support at 1.3067 and a 161.8% Fibonacci extension at 1.3028 (forms part of the AB=CD structure).
H4 action, on the other hand, now has eyes on Quasimodo support coming in at 1.3028. It might also interest some traders to note the RSI is currently chalking up positive divergence out of oversold territory (blue line). In addition to this, the said Quasimodo support also aligns with the lower edge of the noted daily buy zone mentioned above.
Areas of consideration:
Underlined in Thursday’s outlook, H4 Quasimodo support at 1.3028, owing to its connection with the lower edge of a daily buy zone at 1.3028/1.3089, remains an area of interest for possible buying. However, with weekly flows portending further downside, waiting for a H4 bullish candlestick signal to develop is worth considering (entry and risk levels can be determined according to the selected candlestick pattern). A response from 1.3028 could reach as far north as 1.31 for partial profit taking.
Fundamentally, also, we have employment data from both Canada and the US to look forward to later on today.
USD/CHF:
USD/CHF price action was, once again, all but unchanged Thursday, as US banks closed their doors in observance of 4th July holiday.
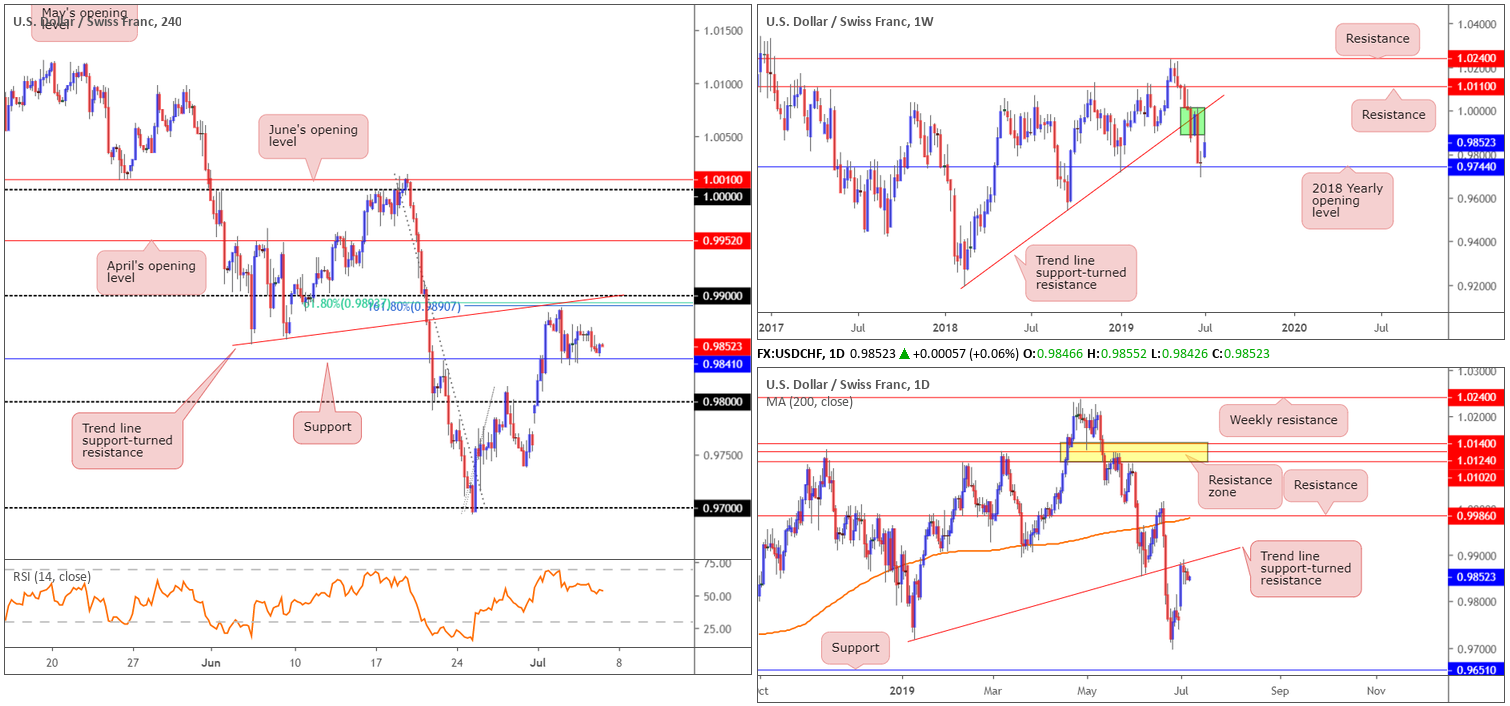
In similar fashion to Thursday’s outlook, the H4 candles continue to form a floor off support at 0.9841. What is unfortunate was H4 price failed to connect with its 0.99 handle for a possible sell. Note this figure boasts strong local confluence from a trend line support-turned resistance taken from the low 0.9853, a 161.8% Fibonacci extension point at 0.9890 and a 61.8% Fibonacci retracement at 0.9894. Below 0.9841, the next downside hurdle falls in around 0.98.
From the weekly timeframe, we can see price action recently came within a couple of points of connecting with a thick body of supply at 1.0014-0.9892 (green) after respecting the 2018 yearly opening level (support) at 0.9744 last week. This – coupled with daily price also crossing swords with a trend line support-turned resistance taken from the low 0.9716 – is collectively weighing on the unit.
Areas of consideration:
Technically, two potential scenarios are present, according to the technical studies:
- Further selling occurs and breaks through the current H4 support at 0.9841. This is possible, owing to where we’re coming from on the bigger picture (see above). A H4 close beyond 0.9841, therefore, opens the door to short-term selling opportunities towards 0.98 and quite possibly beyond.
- In the event the current H4 support holds and we move higher, a test of 0.99, by way of a H4 bearish candlestick configuration (can be used to set entry and risk levels), is a high probability sell, given the surrounding confluence both locally and on the bigger picture, targeting H4 support at 0.9841 as the initial take-profit zone.
Dow Jones Industrial Average:
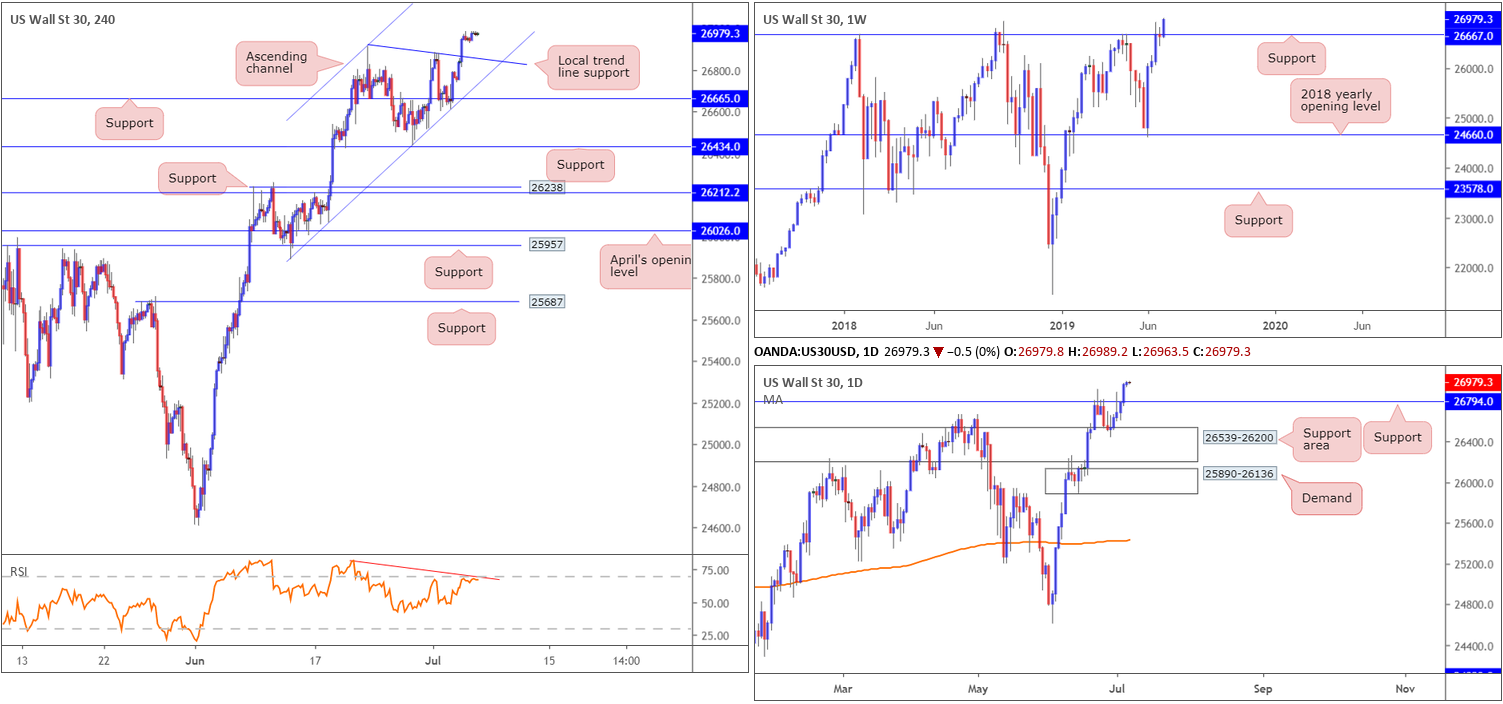
US stocks ended higher with record closes ahead of 4th July holiday, as markets priced in a new easing cycle. Technically speaking, weekly resistance at 26667 was taken out and now resembles support. This could be a good platform to consider for longs should the market correct. In similar fashion, daily price also has support resting at 26794 after recently being taken out.
Technical structure on the H4 timeframe reveals a nice-looking ascending channel in motion (25890/26912), as well as a support lurking nearby at 26665 and a local trend line support taken from the high 26912. Assuming we pullback today after clocking record highs in recent movement, the said supports are certainly barriers to keep an eye on for potential long opportunities. It might also be worth bearing in mind daily support at 26794 is positioned a few points beneath the H4 channel support line, therefore providing an extra buffer for any buyers.
Areas of consideration:
In light of recent buying, the thought of selling is unlikely on the menu in this market. With that being the case, traders are urged to consider the H4 channel support highlighted above as a possibility for longs today, assuming we pullback to lower levels that is. The research team favours this level due to the local H4 trend line support intersecting with the channel and the daily support level at 26794. To help with entry and stop-loss placement, it may be an idea to wait for a H4 bullish candlestick signal to develop before pulling the trigger.
XAU/USD (GOLD):
Thanks to US banks closing in observance of 4th July, little change came about in gold yesterday. For that reason, much of the following outlook resembles points aired in Thursday’s piece.
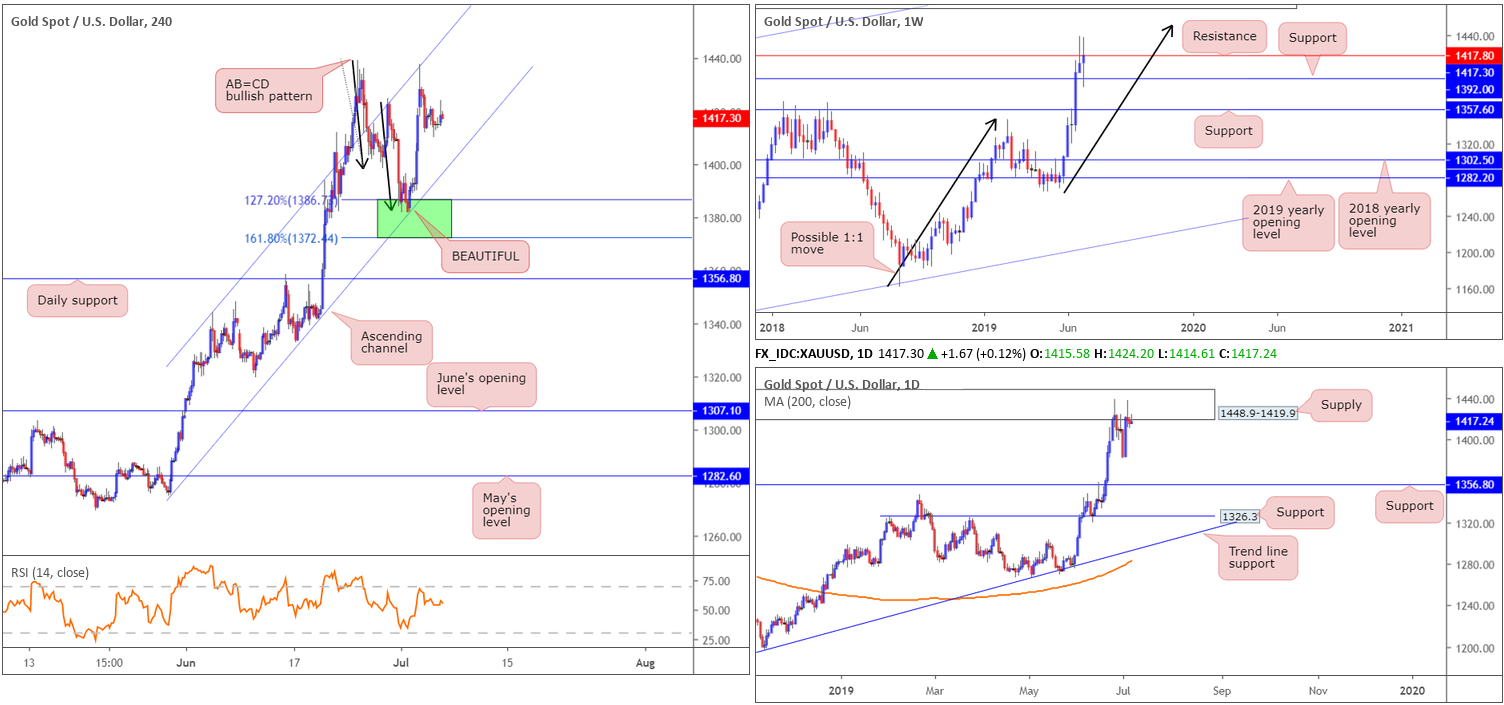
Kicking off with a look at weekly structure, the research team notes bullion continued to climb higher after retesting support at 1392.0, and is now attempting a run above resistance at 1417.8. Further upside from this point could eventually cross paths with a 1:1 correction (black arrows) shaped from the 1160.3 August 13 low.
The story on the daily timeframe has the candles testing the lower edge of a supply zone at 1448.9-1419.9. Note the weekly resistance level at 1417.8 resides just beneath the said supply zone.
A closer reading of price action on the H4 timeframe reveals the unit responded beautifully from the highlighted buy zone between 1372.4/1386.7 (green – comprised of an AB=CD bullish pattern [black arrows], which has a termination zone positioned between the 127.2% and 161.8% Fibonacci extension points). It is also worth pointing out the weekly support level mentioned above at 1392.0 was stationed just north of this H4 base and the area also intersected with a H4 channel support extended from the low 1275.9. Well done to any of our readers who managed to jump aboard this move, as price traded as far north as the H4 channel resistance taken from the high 1344.0.
Areas of consideration:
Traders who remain long the yellow metal are encouraged to consider reducing risk to at least breakeven and even cashing in some of the position. This is due to recently connecting with higher-timeframe supply on the daily chart and also resistance on the weekly scale.
In light of upside momentum yet to show much sign of waning, however, holding a portion of the position open is an option. Should we punch for fresh highs today, moving the stop-loss order to 1410.0 is an idea. From thereafter, traders can trail behind support points once additional fresh highs are achieved.
The accuracy, completeness and timeliness of the information contained on this site cannot be guaranteed. IC Markets does not warranty, guarantee or make any representations, or assume any liability with regard to financial results based on the use of the information in the site.
News, views, opinions, recommendations and other information obtained from sources outside of www.icmarkets.com.au, used in this site are believed to be reliable, but we cannot guarantee their accuracy or completeness. All such information is subject to change at any time without notice. IC Markets assumes no responsibility for the content of any linked site.
The fact that such links may exist does not indicate approval or endorsement of any material contained on any linked site. IC Markets is not liable for any harm caused by the transmission, through accessing the services or information on this site, of a computer virus, or other computer code or programming device that might be used to access, delete, damage, disable, disrupt or otherwise impede in any manner, the operation of the site or of any user’s software, hardware, data or property.


