
Key risk events today:
Canada Employment Change and Unemployment Rate; US Average Hourly Earnings m/m, Non-Farm Employment Change and Unemployment Rate.
(Previous analysis as well as outside sources – italics).
EUR/USD:
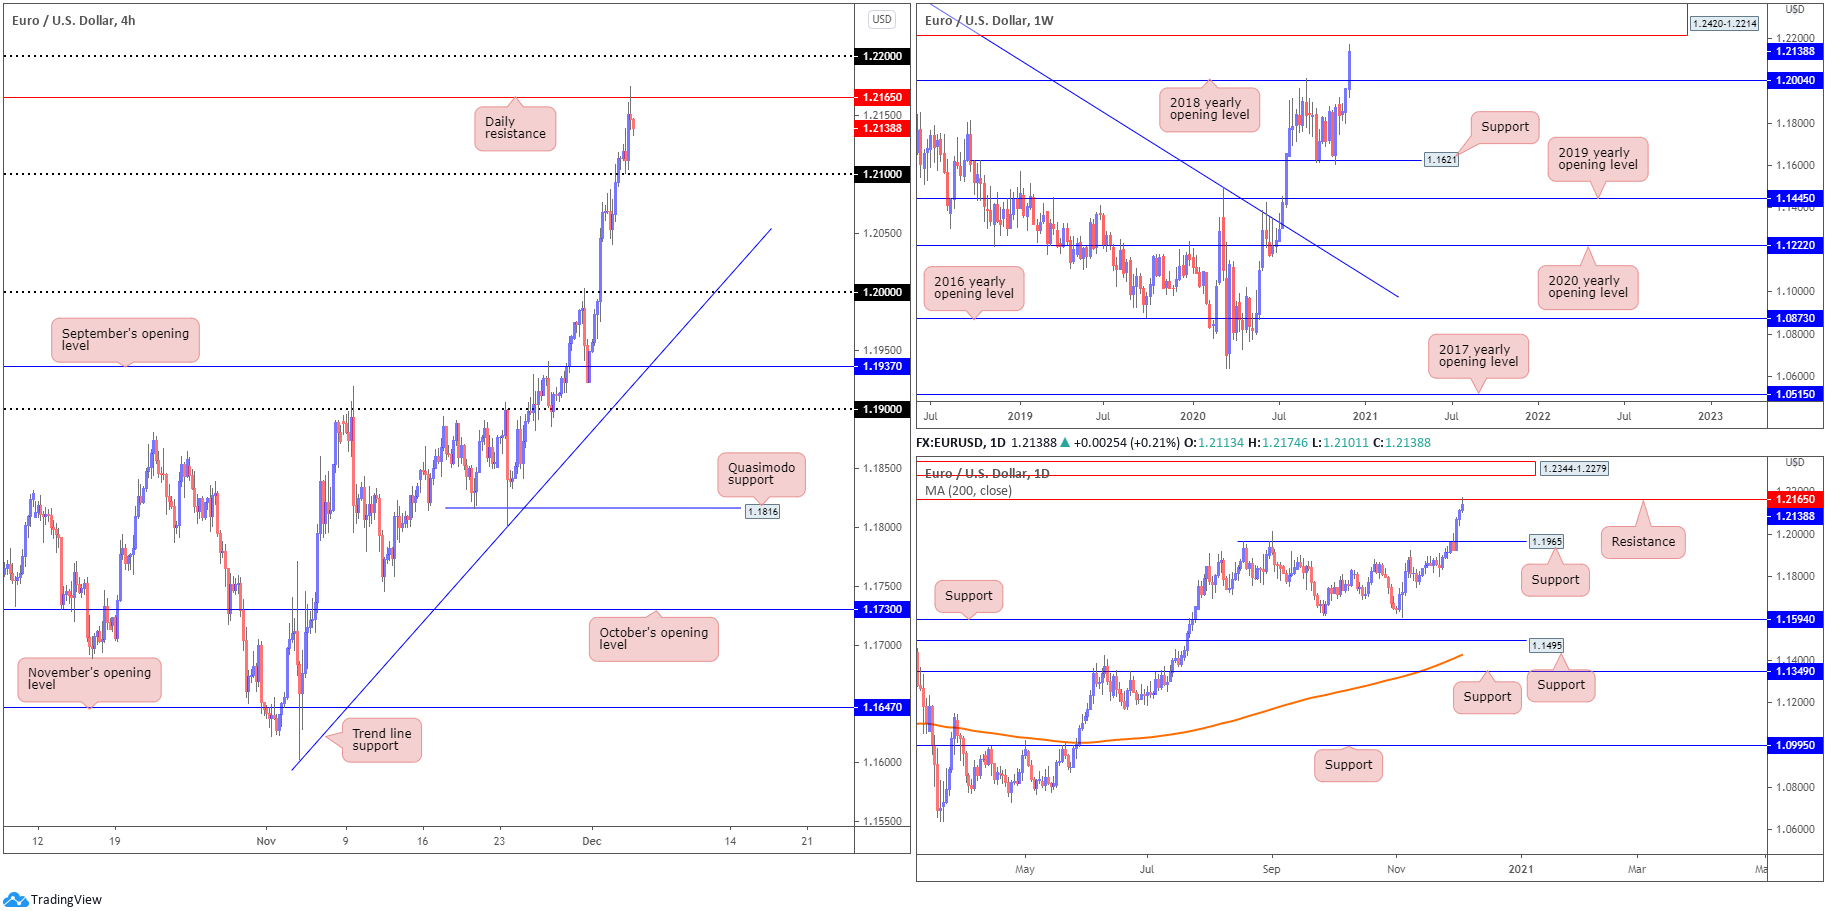
EUR/USD bulls remain in great shape north of the 2018 yearly opening value at 1.2004 on the weekly timeframe. Up nearly 1.5% on the week so far, testing fresh yearly peaks, large supply at 1.2420-1.2214 demands attention.
Before reaching for the weekly supply zone, buyers must contend with daily resistance at 1.2165. Beyond here, traders’ crosshairs are then likely to be focussed on daily supply drawn from 1.2344-1.2279 (sited within the lower parapets of current weekly supply). A solid rejection from the aforementioned daily resistance level shines the spotlight on support at 1.1965, a previous Quasimodo resistance.
Over on the H4 timeframe, daily resistance at 1.2165 is centre stage, with a break exposing the 1.22 handle. Instead of a correction to daily support at 1.1965, H4 shows price could retreat to retest 1.21 before buyers possibly take a shot at refreshing YTD peaks.
Areas of consideration:
- The uptrend remains in a healthy state, seen clearly from the daily timeframe, since March 2020.
- Profit-taking drawn from daily resistance at 1.2165 today could force a retest at 1.21 on the H4 scale. It will be here buyers may look to form dip-buying positions. Therefore, keep an eye on H4/H1 candlestick action for signs of bullish intent should 1.21 enter the fold.
GBP/USD:
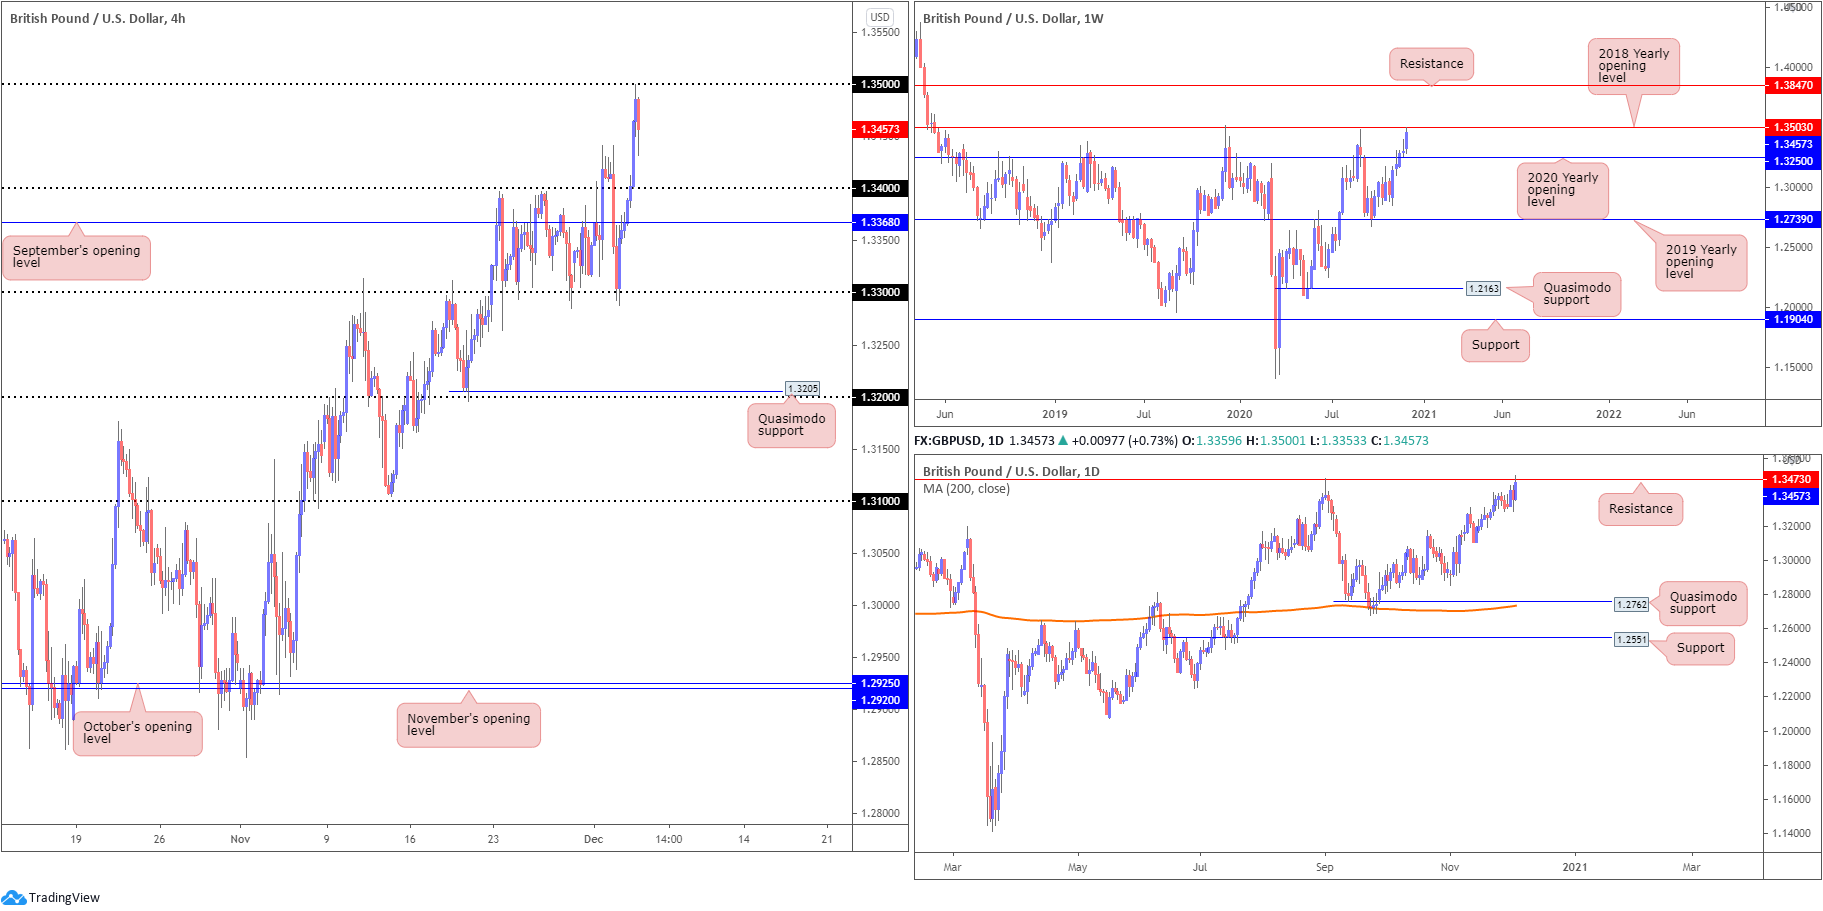
A waning US dollar, on top of bullish Brexit bets, hauled GBP/USD to fresh YTD highs on Thursday, with enough oomph to bring in orders from the 1.35 handle on the H4. As evident from the chart, sellers seized intraday control from 1.35 in recent hours amid soured Brexit talks.
BBC’s Laura Kuenssberg, via Twitter:
A senior govt source says ‘at the eleventh hour, the EU is bringing new elements into the negotiation. A breakthrough is still possible in the next few days but that prospect is receding.’
Technical drawings on the weekly timeframe reveal yesterday’s movement came within striking distance of the 2018 yearly opening level at 1.3503. An eventual break of this base could send price as far north as resistance plotted at 1.3847.
Lower on the curve, daily price is seen navigating resistance at 1.3473, sited just under weekly resistance at 1.3503.
Areas of consideration:
- The 1.35 region is interesting resistance, merging closely with weekly resistance at 1.3503 and daily resistance found at 1.3473.
- The trend remains to the upside, therefore any bearish scenario formed off 1.35 could be short-lived. Downside targets reside at the 1.34 handle and September’s opening value from 1.3368 (H4).
AUD/USD:
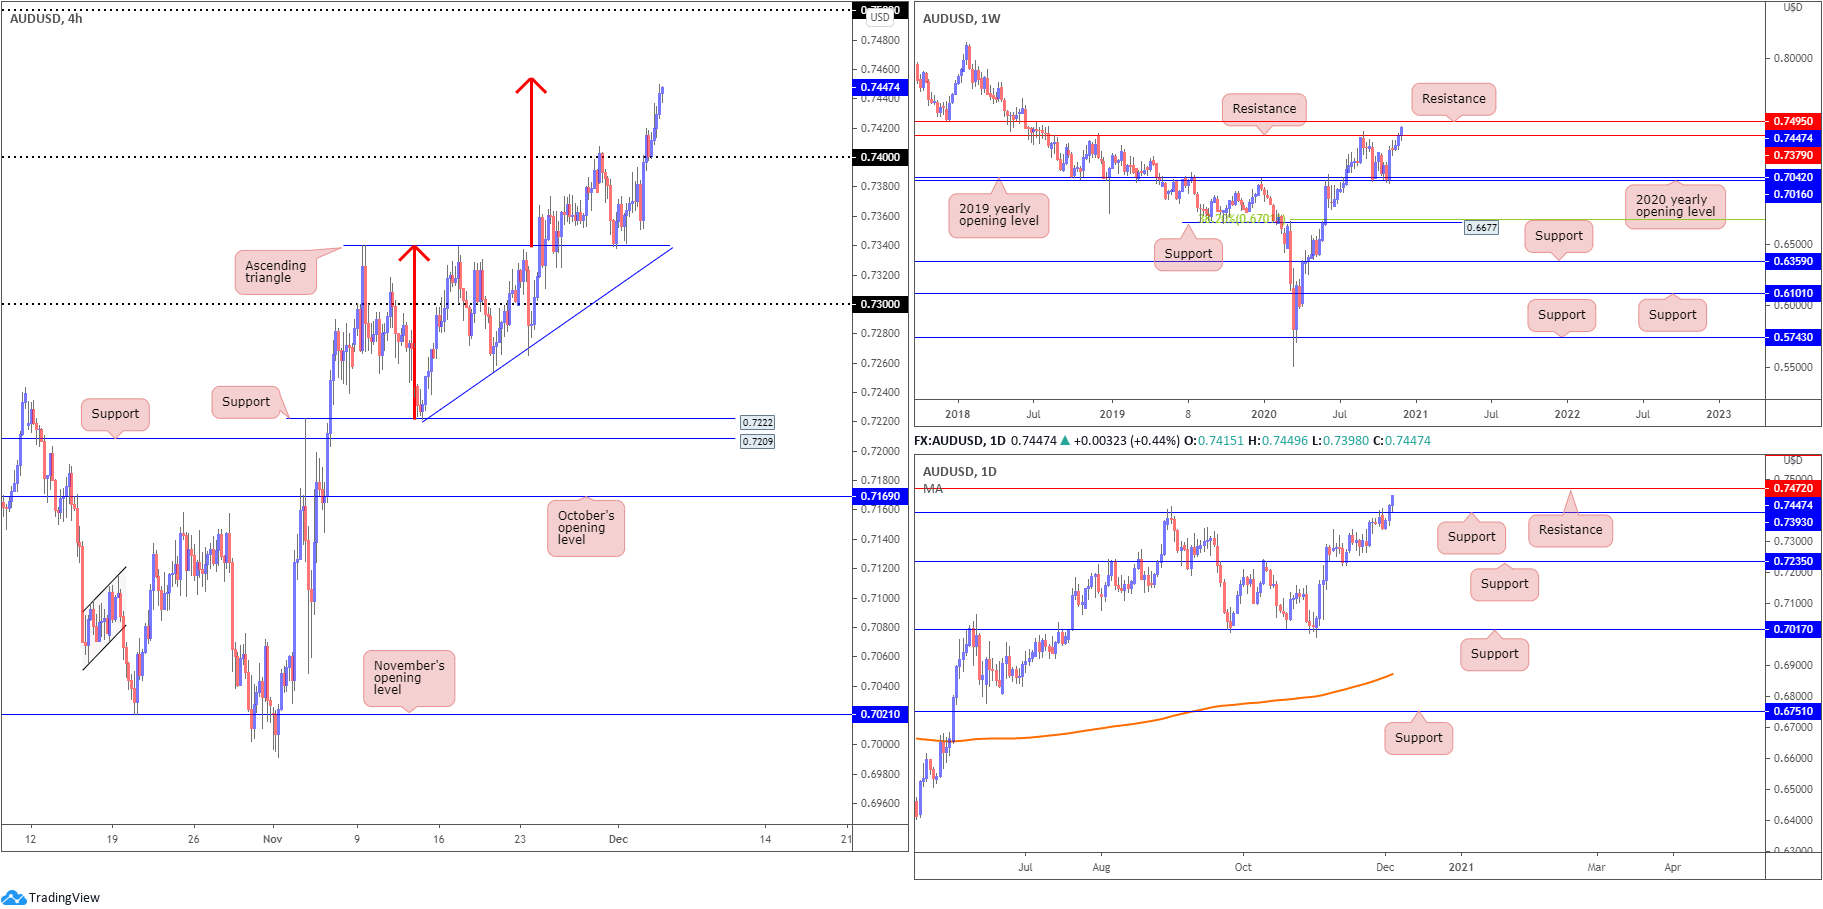
The combination of upbeat risk sentiment and USD weakness continued to support AUD/USD on Thursday, recording YTD highs and finishing higher for a third consecutive session.
For those who read Thursday’s technical briefing you may recall the following (italics):
Recent trade retested 0.7340, the upper boundary of a H4 ascending triangle pattern, and challenged the underside of the 0.74 handle. Above, traders may be looking towards the ascending triangle take-profit target (red arrows) at 0.7453.
As can be seen from the H4 chart, 0.74 is now a distant memory with buyers closing in on the ascending triangle take-profit target (red arrows) at 0.7453. Daily price demonstrating scope to approach resistance at 0.7472, together with weekly price honing in on resistance from 0.7495, shows buyers may also push beyond 0.7453 in favour of higher timeframe resistances.
Areas of consideration:
- Buyers long the ascending triangle support at 0.7340 likely reduced risk at 0.74 with many now eyeing 0.7453 as an initial take-profit region, followed by higher timeframe resistances 0.7472 and 0.7495 (and the 0.75 handle on the H4).
USD/JPY:
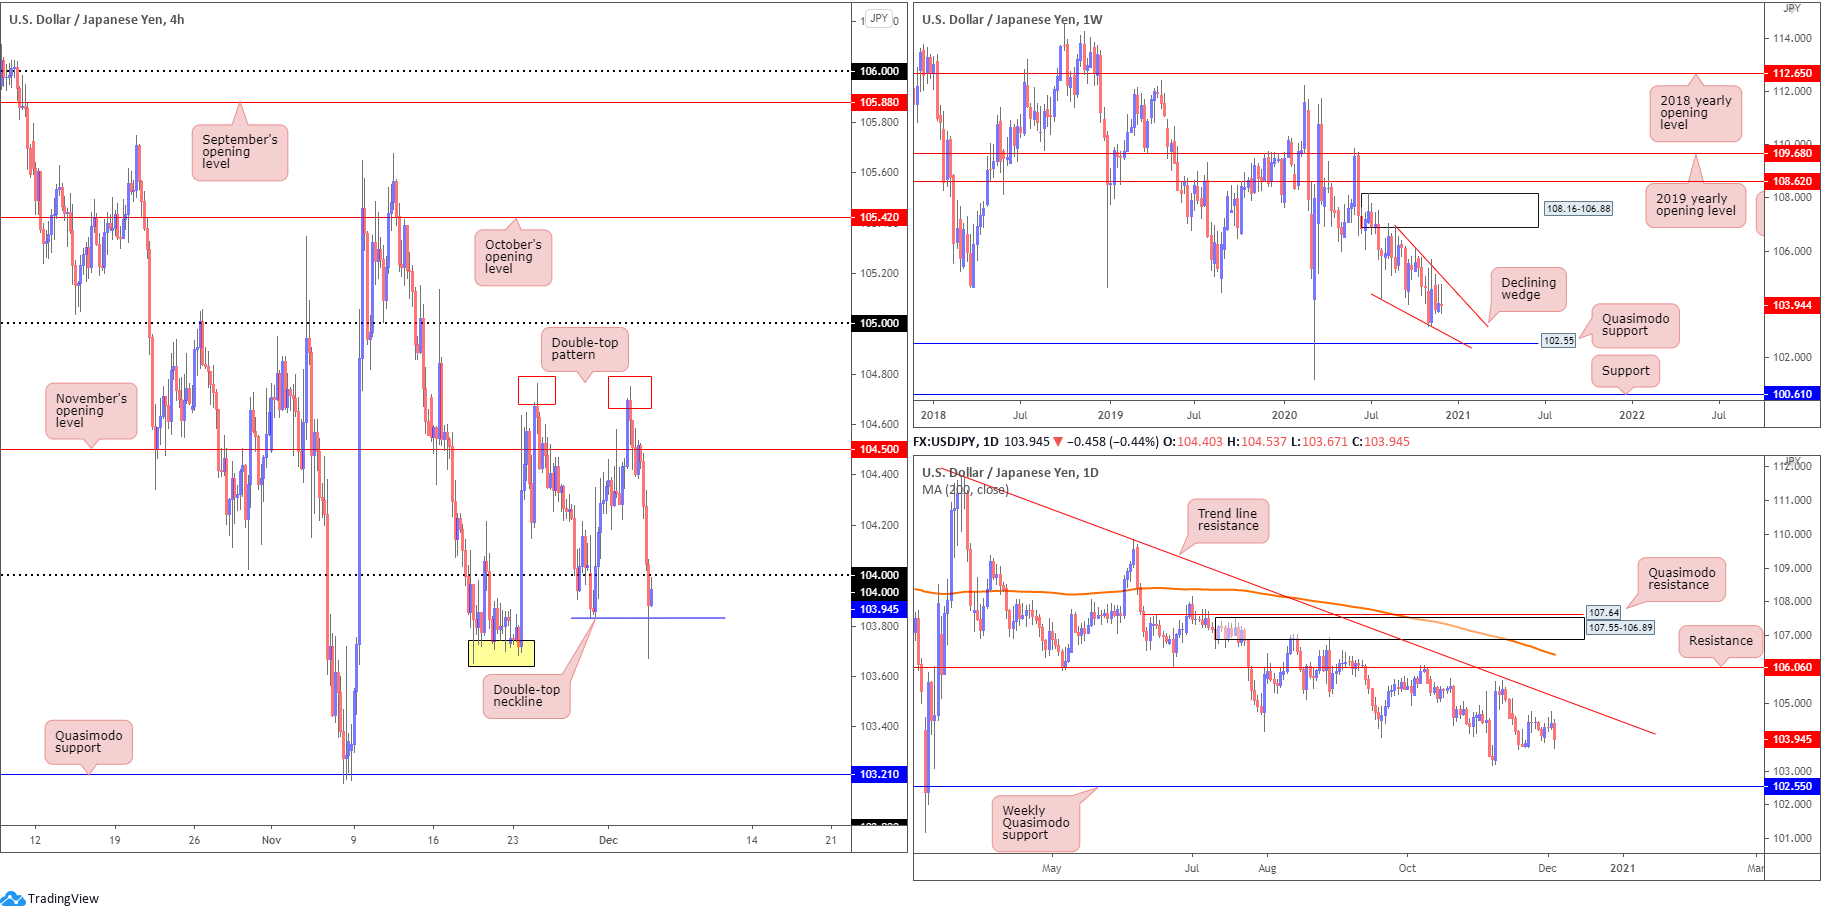
Broad USD softness – the DXY nosedived to lows at 90.51 and registered a third consecutive daily loss – pressured USD/JPY lower on Thursday. Reaching lows at 103.67, and testing a plot of moderate support around 103.70 (yellow), left the 104 handle dismantled on the H4. Also featured on the H4 timeframe is the recent formation of a double-top pattern at 104.75. While these patterns are best found at peaks alongside resistance, in this case, the formation represents a swing high. Though the neckline at 103.83 was tested, a H4 close beneath the base has yet to form. Should a close lower materialise, traders’ crosshairs will likely be fixed on Quasimodo support at 103.21.
Higher timeframe technical action remains unchanged.
From the weekly timeframe (italics):
Since connecting with the underside of supply at 108.16-106.88 in August, price has gradually shifted lower and developed a declining wedge (106.94/104.18).
Quasimodo support at 102.55 is in the picture, with a break revealing support plotted at 100.61. A strong bounce from 102.55 may provide enough impetus for buyers to attempt a breakout above the current declining wedge.
Daily timeframe (italics):
The technical landscape from the daily timeframe reveals scope to close in on trend line resistance, extended from the high 111.71. Sellers taking over, however, could lead price to the 103.17 November 6 low, followed by the noted weekly Quasimodo support at 102.55.
Areas of consideration:
- Reacting at the underside of 104 today could see sellers close price below the H4 double-top neckline at 103.83 to target H4 Quasimodo support at 103.21.
- Closing and holding above 104, on the other hand, suggests a bullish theme back to November’s opening value at 104.50 (H4).
USD/CAD:
The US dollar index refreshing YTD troughs south of 91.00 and WTI rallying beyond $45.50 a barrel directed USD/CAD to multi-year lows on Thursday.
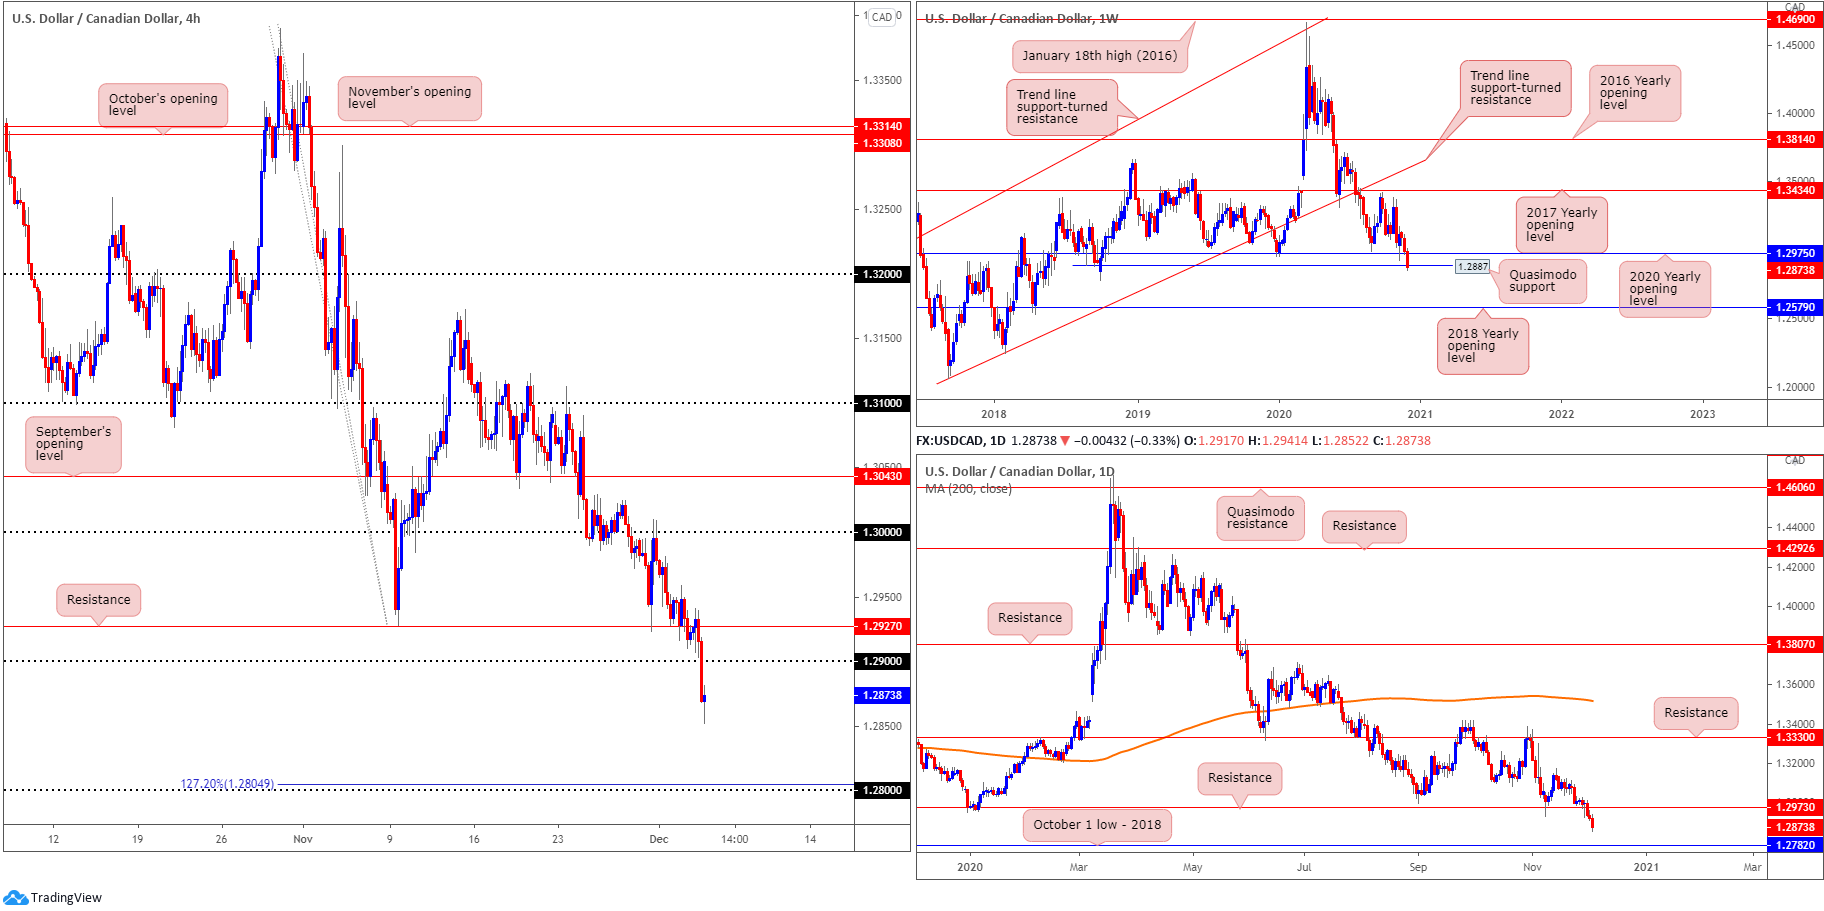
- Quasimodo support on the weekly timeframe at 1.2887 is under pressure at the moment. Any sustained move below 1.2887 places the 2018 yearly opening value at 1.2579 in the firing line.
- Aside from October’s low (2018) at 1.2782 possibly drawing up support, the technical picture on the daily timeframe shows sellers could remain in control.
- H4 made quick work of 1.29 on Thursday, swiftly squeezing out any buyers. Clearance of the round number locates 1.28 on the radar, a psychological level sharing space with a 127.2% Fibonacci projection point at 1.2804.
Areas of consideration:
- 28 on the H4, together with October lows (2018) at 1.2782 (daily timeframe), represents support.
- With weekly Quasimodo support at 1.2887 under pressure, a retest at 1.29 (or H4 resistance at 1.2927) could be enough to lure additional bearish flow. However, given the QM is yet to be fully consumed (low at 1.2782), 1.29 sellers may consider waiting and seeing if price chalks up a bearish candlestick signal before taking action.
USD/CHF:
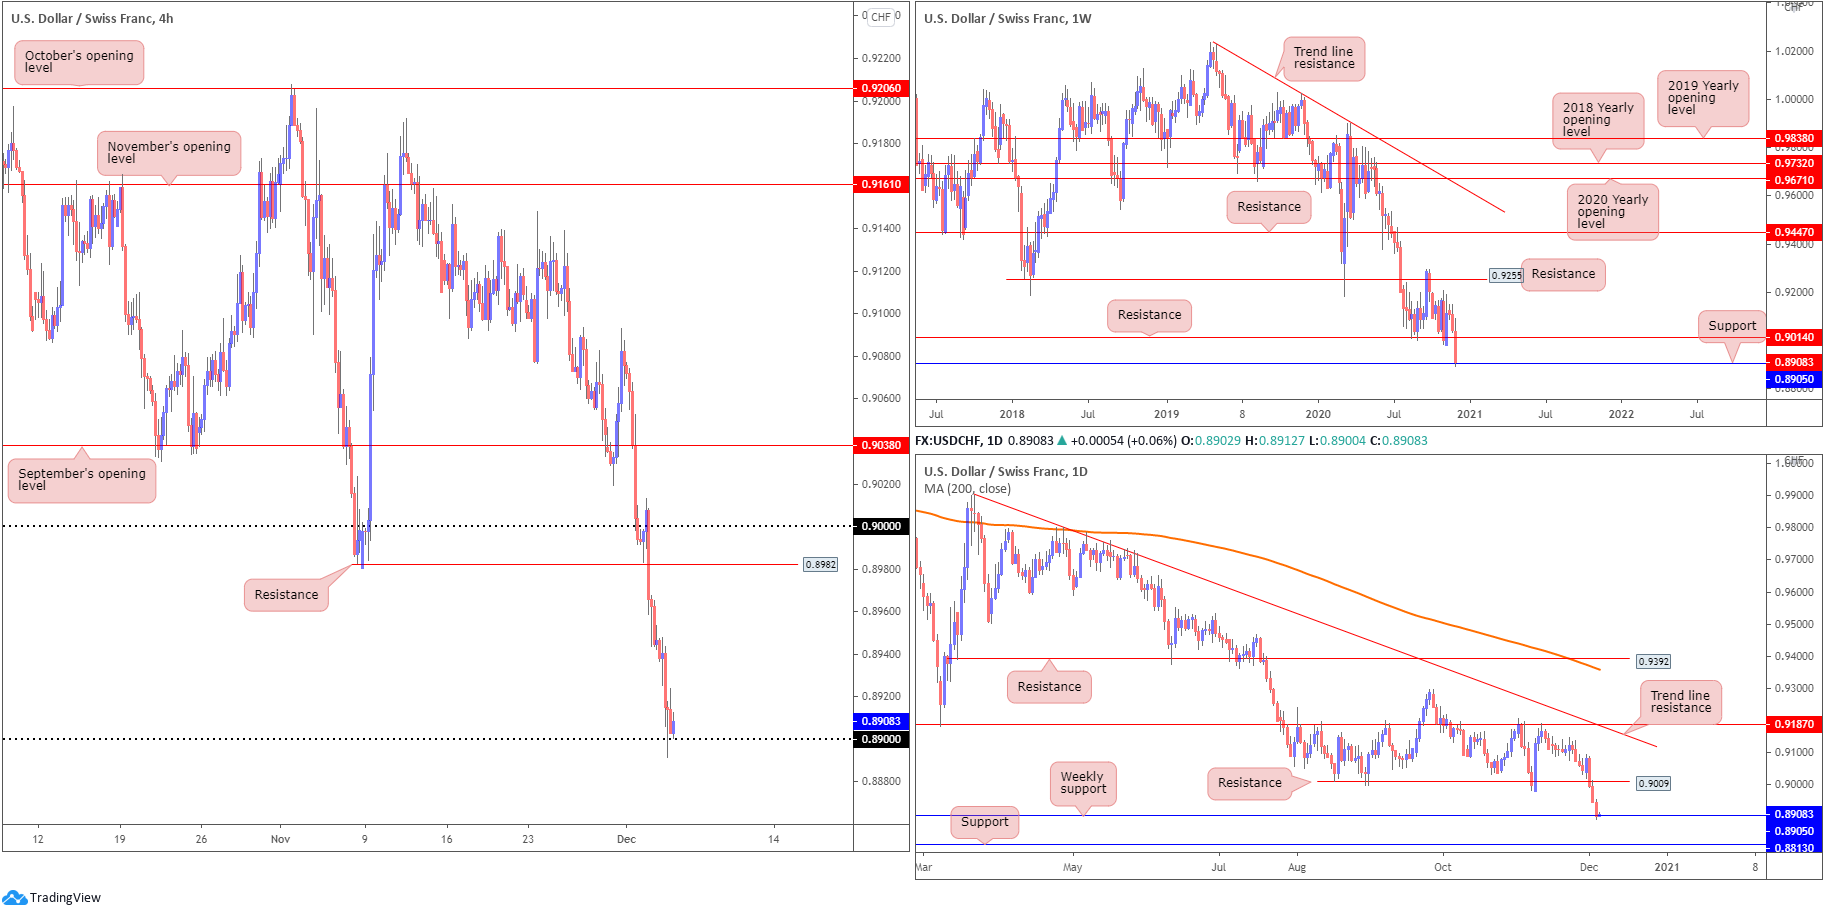
The week’s speedy decline, down 1.5% at the time of writing, has enveloped weekly support at 0.9014 (now possible resistance) and recently crossed swords with another layer of support coming in at 0.8905. Not only is price on track to record a third consecutive weekly loss, the pair now trades at multi-year lows.
The 0.89 handle made an appearance on the H4 timeframe yesterday, providing brief respite in the shape of a hammer candlestick formation, a bullish signal at troughs/dips. In terms of support, the round number 0.89 and weekly support at 0.8905 provides a substantial floor to work with. However, the sheer force of USD selling of late could deter buying and lead to a 0.89 breach taking over.
Beyond weekly support at 0.8905, limited support is seen on the weekly chart until reaching 0.8689, though beyond the weekly level on the daily and H4 scale we can see support resides at 0.8813.
Areas of consideration:
- 89 and weekly support at 0.8905 form strong confluence to be aware of, though the trend in this market has been lower since April 2019.
- 89 giving way underscores a potential bearish scene to daily support at 0.8813. Conservative sellers may seek a retest of 0.89 before considering pulling the trigger.
Dow Jones Industrial Average:
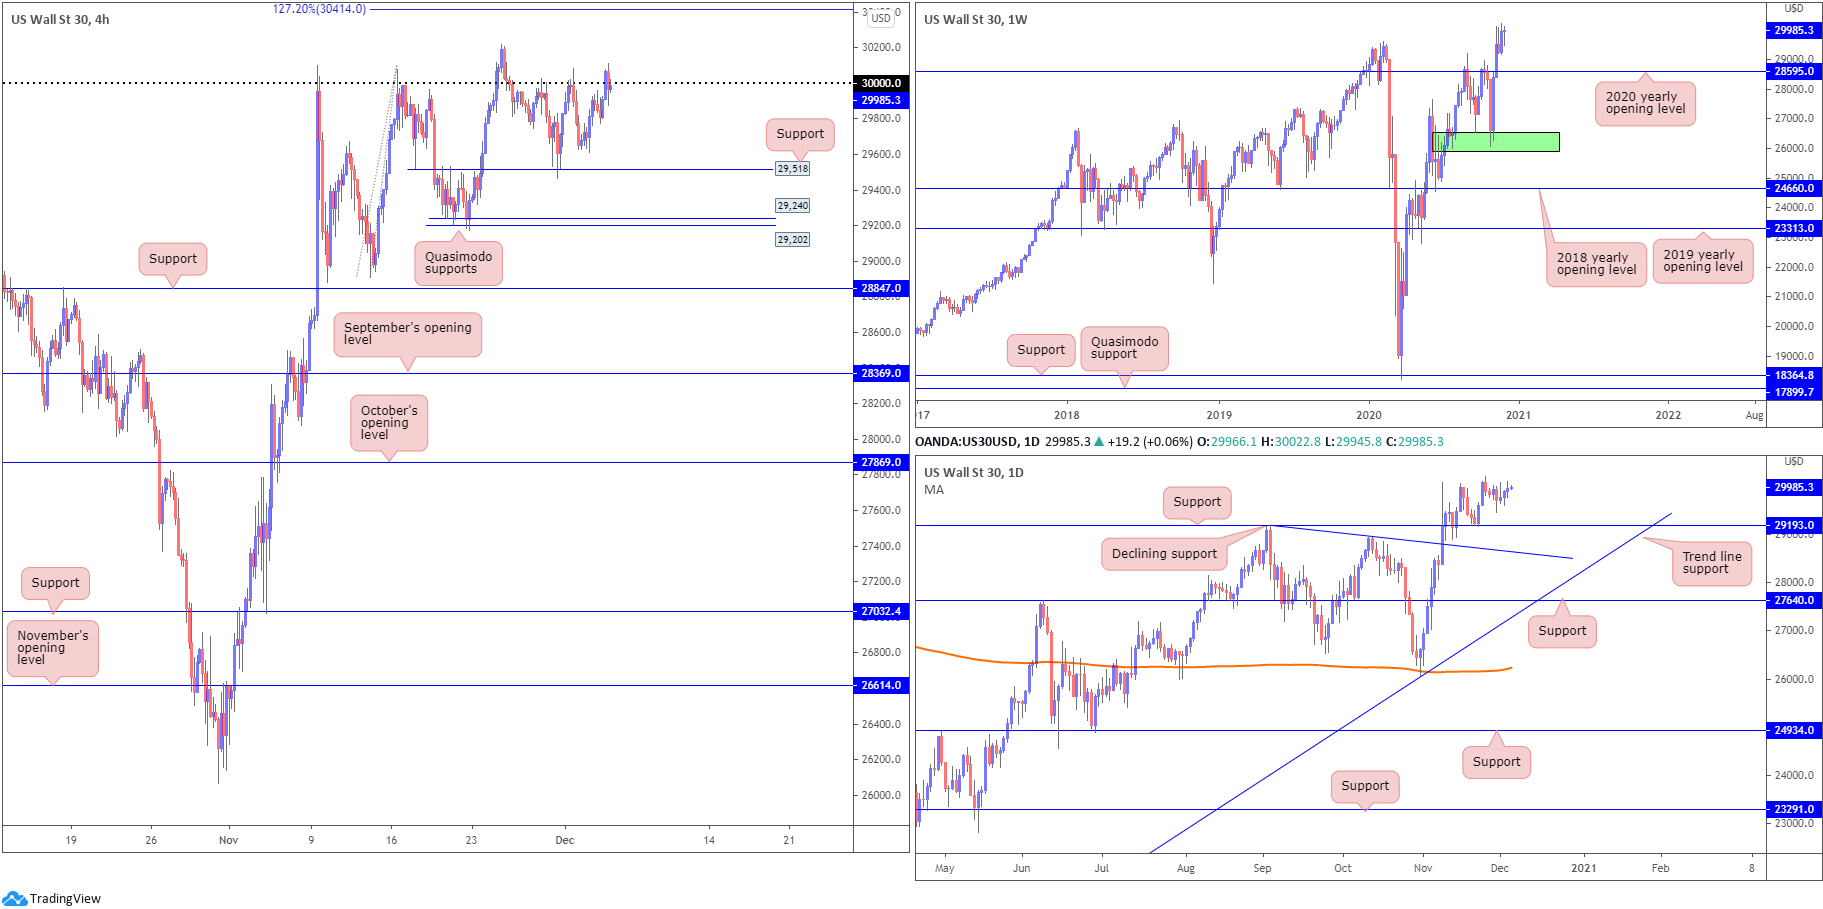
US stocks finished mostly higher Thursday, buoyed on the back of COVID-19 vaccine developments. The Dow Jones Industrial Average added 85.73 points, or 0.29%; the S&P 500 traded lower by 2.29 points, or 0.06% while the Nasdaq rallied by 27.82 points, or 0.23%.
Weekly price shows the week trading off session lows around all-time peaks at 30,217. In the event a correction materialises, the 2020 yearly opening value from 28595 could be an area dip-buyers find interest in. According to the daily timeframe, however, support is seen at 29,193, positioned above a declining support, taken from the high 29,193 (merges closely with 28595 on the weekly scale).
The widely watched 30,000 figure on the H4 is in the spotlight, after buyers left support at 29,518 unchallenged. Subsequent buying may reach for 30,217 and also possibly the 127.2% Fibonacci projection point at 30,414.
Areas of consideration:
- A 30,000 rejection throws 29,518 back into the mix as possible support on the H4, a level dip-buyers may once again find interest in.
- A decisive H4 close above 30,000 may ignite breakout strategies.
XAU/USD (GOLD):
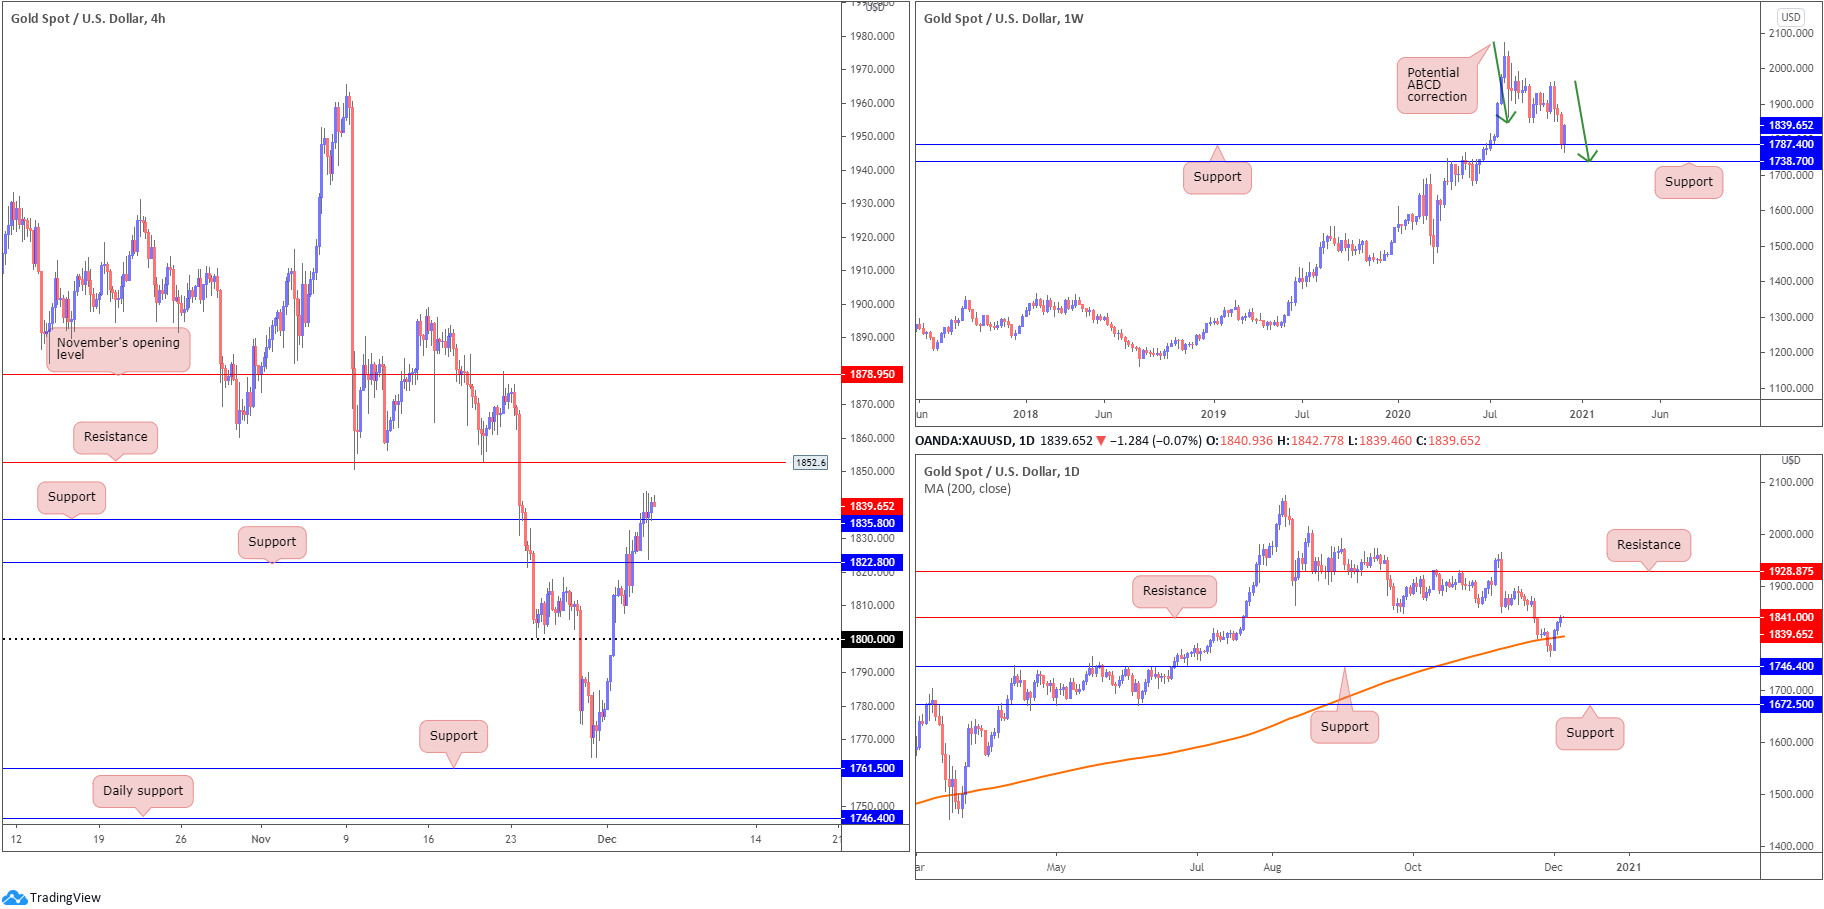
XAU/USD bulls pushed for a third consecutive gain on Thursday, capitalising on the dollar’s deterioration.
The weekly timeframe reveals the prospects of further buying, following the retest of support at $1,787 (sited ahead of another support at $1,738 and a potential ABCD correction [green arrows]). The fact the yellow metal has been decisively trending higher since the beginning of 2016 adds to a bullish narrative off $1,787.
Meanwhile, on the daily chart, we can see buyers conquered the 200-day SMA (orange – $1,803) earlier in the week and eventually shook hands with resistance at $1,841 on Thursday. A break of here, together with the recent move above the 200-day SMA, would help further confirm the weekly timeframe’s bullish vibe.
Across the page on the H4 scale, $1,800 resistance was taken on Tuesday, leaving Wednesday free to overthrow resistance at $1,822 (now possible support). Another layer of resistance was taken at $1,835 on Thursday, with the break exposing resistance at $1,852. In between these two levels, however, traders must acknowledge daily resistance from $1,841.
Areas of consideration:
- Uptrend remains strong (check weekly timeframe).
- Buyers appear free to take things higher, according to the trend and weekly support at $1,787.
- H4 buyers have some room to climb off support at $1,835, targeting resistance at $1,852. Nevertheless, buyers are likely to be cautious given daily resistance entering the fold yesterday at $1,841. Conservative buyers may seek a H4 close above $1,852 before considering bullish positions, targeting November’s opening value at $1,878 (H4).
The accuracy, completeness and timeliness of the information contained on this site cannot be guaranteed. IC Markets does not warranty, guarantee or make any representations, or assume any liability regarding financial results based on the use of the information in the site.
News, views, opinions, recommendations and other information obtained from sources outside of www.icmarkets.com.au, used in this site are believed to be reliable, but we cannot guarantee their accuracy or completeness. All such information is subject to change at any time without notice. IC Markets assumes no responsibility for the content of any linked site.
The fact that such links may exist does not indicate approval or endorsement of any material contained on any linked site. IC Markets is not liable for any harm caused by the transmission, through accessing the services or information on this site, of a computer virus, or other computer code or programming device that might be used to access, delete, damage, disable, disrupt or otherwise impede in any manner, the operation of the site or of any user’s software, hardware, data or property


