
Key risk events today:
EUR CPI Flash Estimate y/y; Canadian GDP m/m and RMPI m/m; US Personal Spending m/m US Core PCE Price Index m/m; Chicago PMI.
EUR/USD:
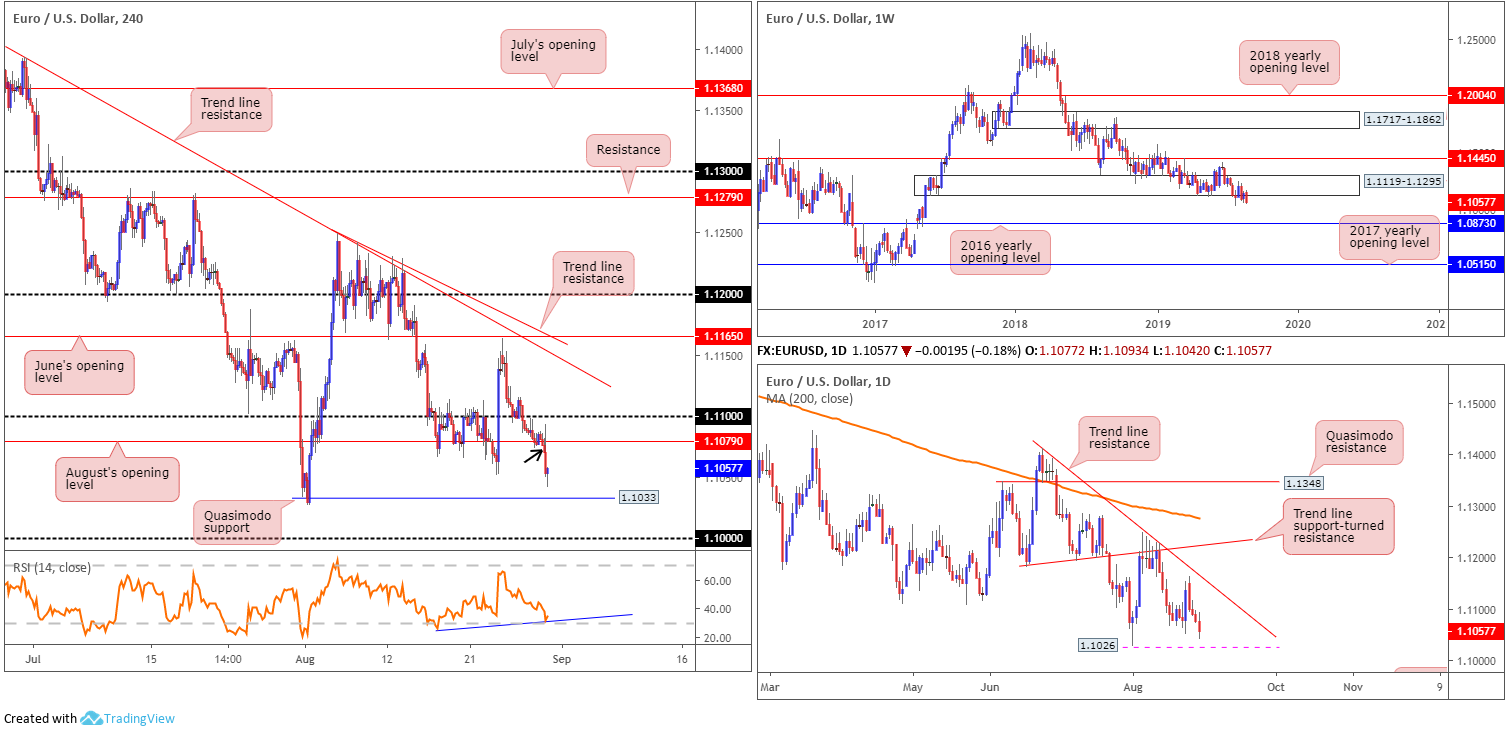
The buck firmed Thursday as newswires cited easing tensions between the US and China, consequently weighing on the single currency. The US dollar index extended gains for a second consecutive session, challenging 98.50. On the data front, the US economy expanded by 2.00%, as anticipated, and weak German inflation data potentially foretells disappointment in Friday’s Eurozone equivalent.
For those who read Thursday’s technical briefing you may recall the following:
Having seen room to press lower on the daily timeframe until 1.1026, the 2019 yearly low, and waning impetus out of weekly demand at 1.1119-1.1295, a break of August’s opening level at 1.1079 on the H4 timeframe may be in store. With this being the case, a H4 close taking shape below 1.1079 unlocks the door to a potentially bearish scenario, either selling based on the breakout candlestick or, more conservatively, at a possible retest motion of 1.1079 as resistance. The next support target from here is the H4 Quasimodo support at 1.1033, closely followed by 1.1026 on the daily scale and then the key figure 1.10 on the H4.
Well done to any of our readers who sold the H4 breakout candle (black arrow). Price dethroned the 1.1051 August 23 low following this, and came within striking distance of testing H4 Quasimodo support at 1.1033 before marginally paring gains.
Areas of consideration:
Traders short this market likely have eyes on the support targets emphasised above in bold. Reducing risk to breakeven and liquidating a portion of the position is certainly an option at 1.1033.
While a response is anticipated from the said support levels, do remain cognisant of weekly flow stressing the possibility of a run as far south as the 2016 yearly opening level at 1.0873.
GBP/USD:
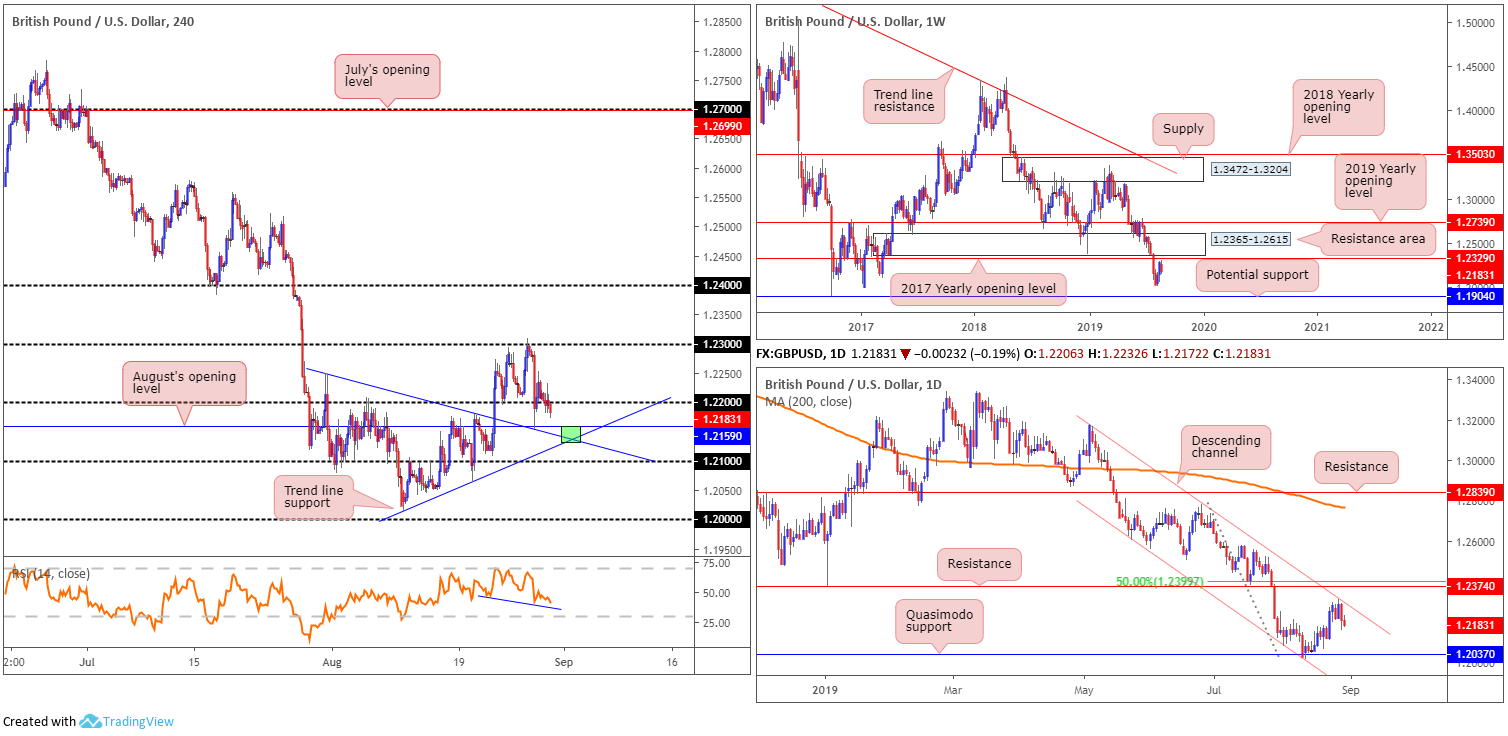
Sterling remained defensive against its US counterpart Thursday, furthering Wednesday’s losses by 0.20%. Rising probabilities of a no-deal Brexit has the GBP/USD a shade below 1.22 this morning, poised to revisit August’s opening level at 1.2159 on the H4 scale. This monthly barrier also comes with two intersecting trend line supports (1.2014/1.2249 – green). Sell stops beneath 1.22 have likely been tripped, causing buyers pain and drawing breakout sellers into profit.
On a wider perspective, the technical landscape on the weekly timeframe has the current candle rotating lower just south of the 2017 yearly opening level at 1.2329 (resistance), set a couple of points south of a major resistance area at 1.2365-1.2615. In conjunction with this, daily channel resistance recently entered the mix (taken from the high 1.3176) and is holding firm. The next port of call in terms of support can be seen at a Quasimodo formation drawn from 1.2037.
Areas of consideration:
Although daily channel resistance suggests sellers may have the upper hand now, a rally to weekly resistance at 1.2329 is certainly not out of the question to draw in longer-term sellers next week. This would also imply a run of buy stops above 1.23 on the H4. For that reason, longs off August’s opening level at 1.2159 today could be an idea, though, given the possible threat of further selling on the daily timeframe, waiting for additional candlestick confirmation to form before pulling the trigger is advised (entry and risk can be determined according to this structure).
AUD/USD:
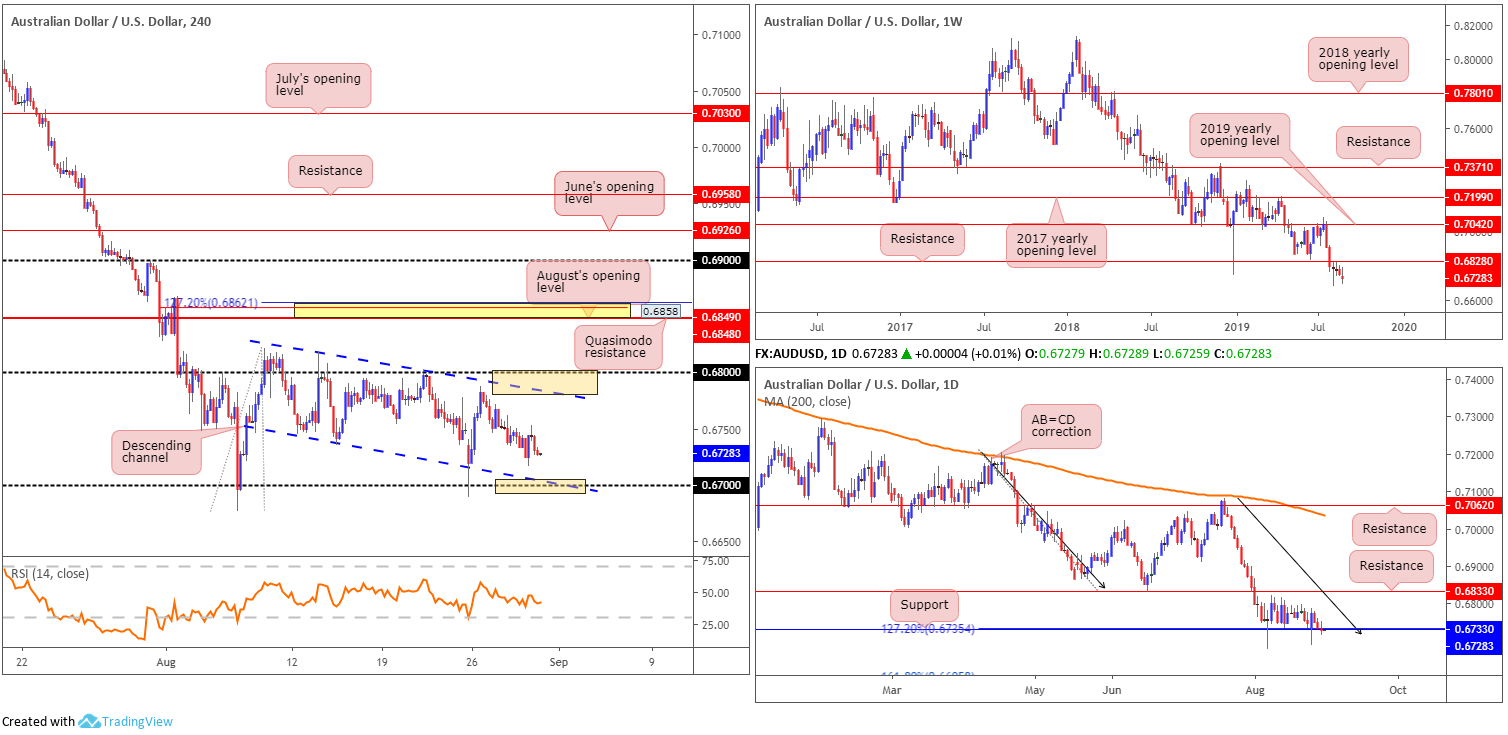
The Australian dollar slumped in the early hours of Thursday, influenced by weaker-than-expected capex data, ahead of next week’s RBA. Further selling emerged into Europe, clocking lows at 0.6717, though reversed course on the back of easing tensions between the US and China to end the day in mildly negative territory.
From a technical standpoint, the end of July witnessed the unit slip beneath notable weekly support at 0.6828, now a serving resistance. The long-term downtrend, intact since the beginning of 2018, remains unbroken, with further selling likely on the cards as the next weekly support is not visible until 0.6395 on this timeframe (not seen on the screen).
Since elbowing beneath weekly support mentioned above at 0.6828, support at 0.6733 on the daily timeframe, along with a 127.2% AB=CD (black arrows) formation at 0.6735, entered the fray and held things higher. In recent sessions, the unit closed beneath the said supports, signalling the possibility of further downside.
Since early August, the H4 candles have been contained beneath 0.68, compressing within the limits of a descending channel formation (0.6817/0.6745). Beyond the 0.68 handle, a close-fitting area of resistance (yellow) resides between a 127.2% Fibonacci ext. point at 0.6862, a Quasimodo resistance at 0.6858 and August’s opening level at 0.6848.
Areas of consideration:
Psychological levels 0.67 and 0.68 remain in the firing range as potentially tradeable barriers, given both merge closely with the H4 descending channel extremes highlighted above. As round numbers are prone to stop runs, traders are urged to wait for additional candlestick confirmation to form before pulling the trigger. This way, not have you only identified buyer/seller intent, you also have structure to base entry/risk levels from. With further selling favoured on the bigger picture, a sell from the 0.68 region is likely the preferred choice.
In the event we push through 0.67 on a H4 closing basis, however, this will also open bearish scenarios towards at least 0.66ish.
USD/JPY:
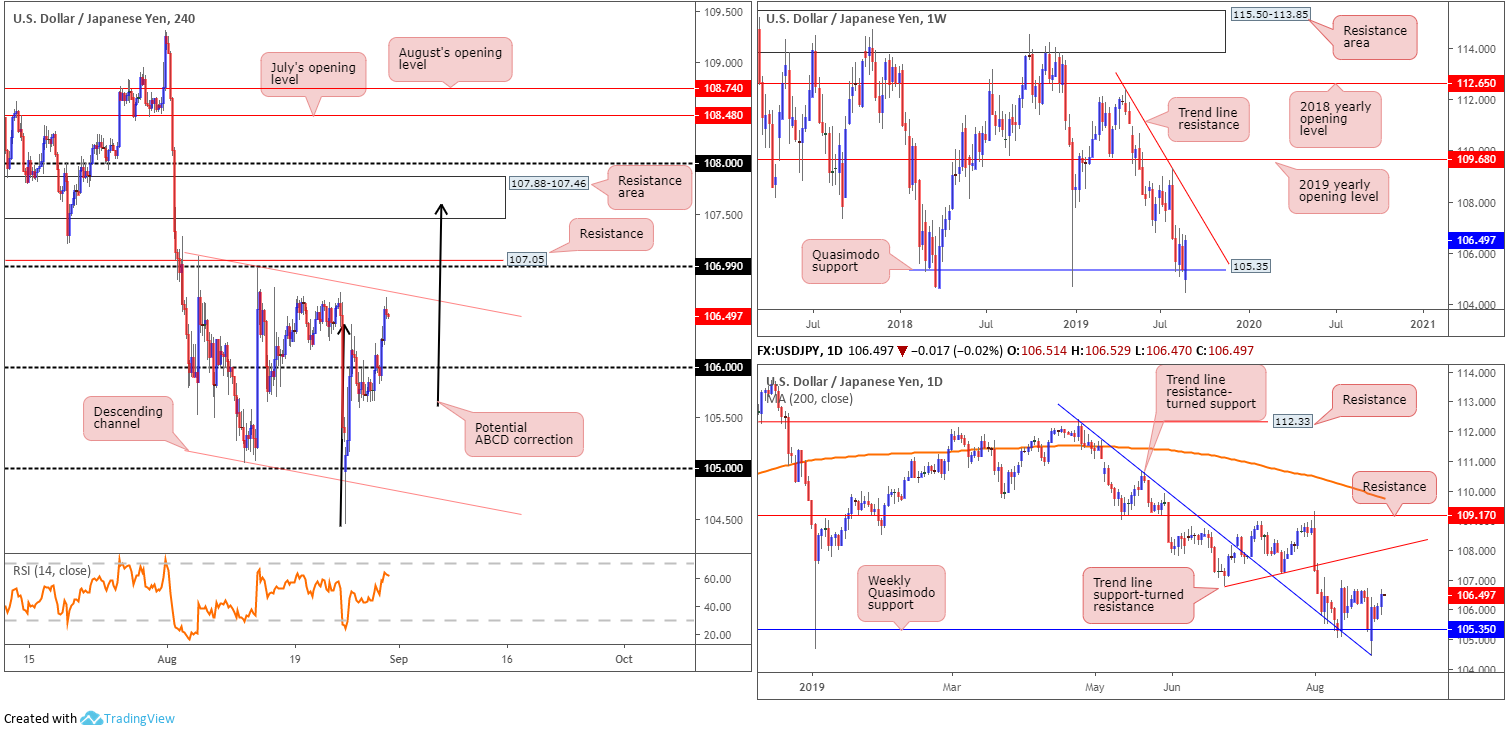
The US dollar advanced against the Japanese yen Thursday, extending Wednesday’s gains. Aided on the back of rising US Treasury yields, a reasonably healthy equity market and the US dollar index climbing to highs above 98.50, the USD/JPY trades firm above 106, eyeing a test of channel resistance (extended from the high 106.01), closely shadowed by the 107 handle and 107.05 resistance. It might also be of interest to some traders the RSI indicator is approaching overbought territory and there’s also possibility for an ABCD completion (black arrows) that terminates within the walls of a H4 resistance area at 107.88-107.46.
Longer term action, as highlighted in previous reports, has weekly price defending Quasimodo support at 105.35 – a level that proved its worth by holding the unit higher at the beginning of the year. Outside of this base, limited support is evident until 100.61, whereas a push north has trend line resistance (extended from the high 112.40) to target. Beyond the weekly Quasimodo support, daily traders have a trend line resistance-turned support (pencilled in from the high 112.40) in motion, which could eventually send the candles to tops set at 106.77, followed by trend line support-turned resistance (taken from the low 106.78).
Areas of consideration:
Although we have weekly price indicating the possibility of further buying from its Quasimodo support at 105.35, tops on the daily scale around 106.77, along with H4 resistances highlighted above in bold, are likely to hamper upside attempts.
Should the H4 candles push through 107, as the weekly timeframe suggests, buyers may look for longs, though with limited space to manoeuvre ahead of the H4 resistance area mentioned above at 107.88-107.46, trading this move is also chancy.
USD/CAD:
Canada’s current account deficit (on a seasonally adjusted basis) narrowed by $10.2 billion to $6.4 billion in the second quarter, the lowest level since Canada returned to a deficit position at the end of 2008. The reduction mainly reflected a much lower deficit on goods, Statistics Canada reported Thursday. The US economy also expanded by 2.00%, as anticipated.
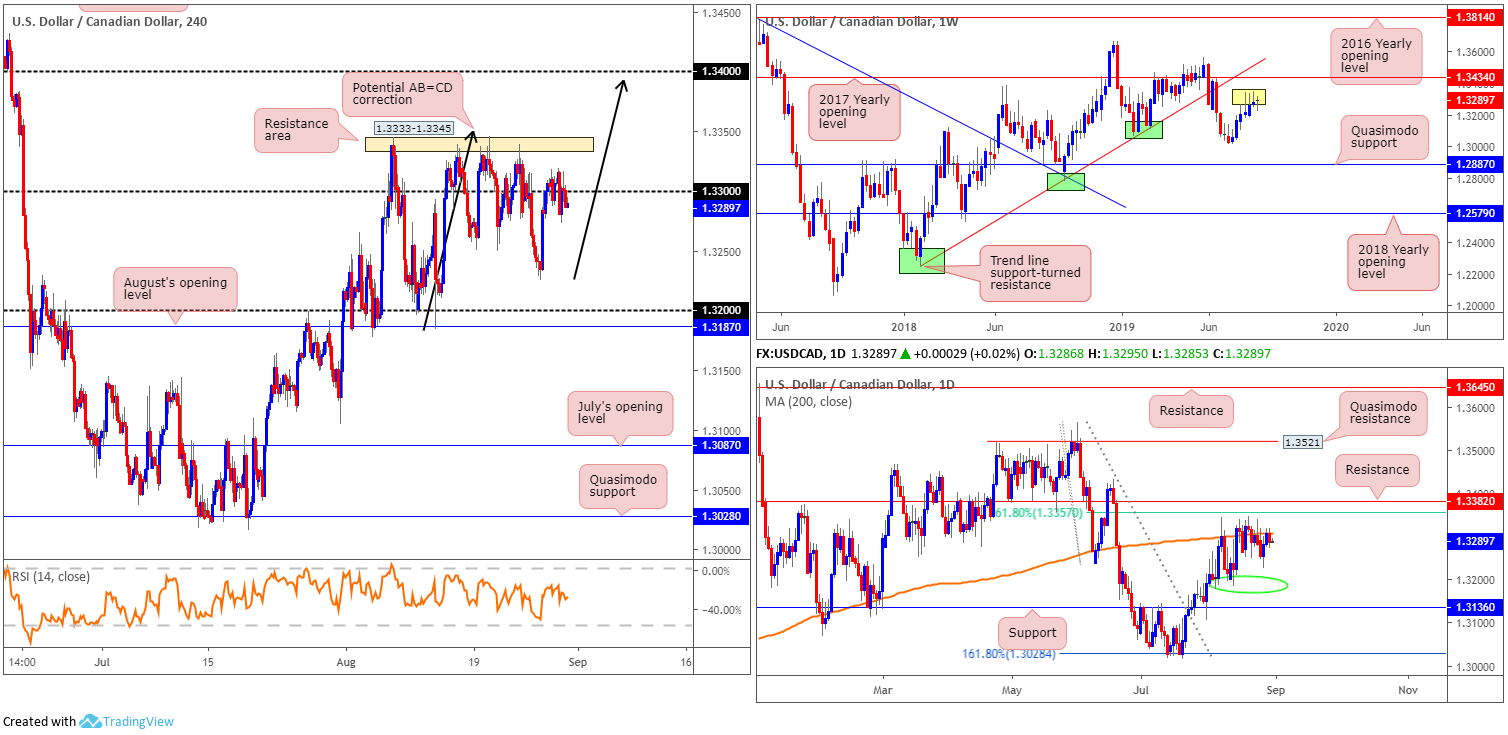
Chart studies reveal the H4 candles remain fluctuating around 1.33, ranging no more than 50 points on the day. To the upside, we have a resistance area coming in at 1.3333-1.3345. Beyond here, the research team notes limited resistance until crossing swords with 1.34, which, if we move this far north, may complete by way of an AB=CD approach (black arrows) at 1.3393. To the downside, Tuesday’s low at 1.3225 is in sight.
Studies based on higher-timeframe structure has weekly price eyeing a test of resistance at 1.3434: the 2017 yearly opening level, followed by trend line support-turned resistance pencilled in from the low 1.2247, despite the prior three weeks chalking up visible selling wicks (yellow). In terms of where we stand on the daily timeframe, the unit is shaking hands with the underside of its 200-day SMA (currently circulating around 1.3309). Overhead, nearby resistance resides at a 61.8% Fibonacci ratio drawn from 1.3357 and resistance coming in at 1.3382.
Areas of consideration:
Shorts from the 1.34 handle, although not likely to enter the fray today, are still possibly of interest for some traders. Not only does it come with a H4 AB=CD approach, nearby resistance on the daily timeframe falls in at 1.3382. Despite this confluence, traders are urged to wait for additional candlestick confirmation before executing a trade, as a fakeout through 1.34 to weekly resistance at 1.3434 may be on the cards.
A selloff below 1.33 could also materialise today, owing to the 200-day SMA recently re-entering the mix. From here, the first port of call, as highlighted above, is Tuesday’s low at 1.3225.
USD/CHF:
For those who read Thursday’s report you may recall the following:
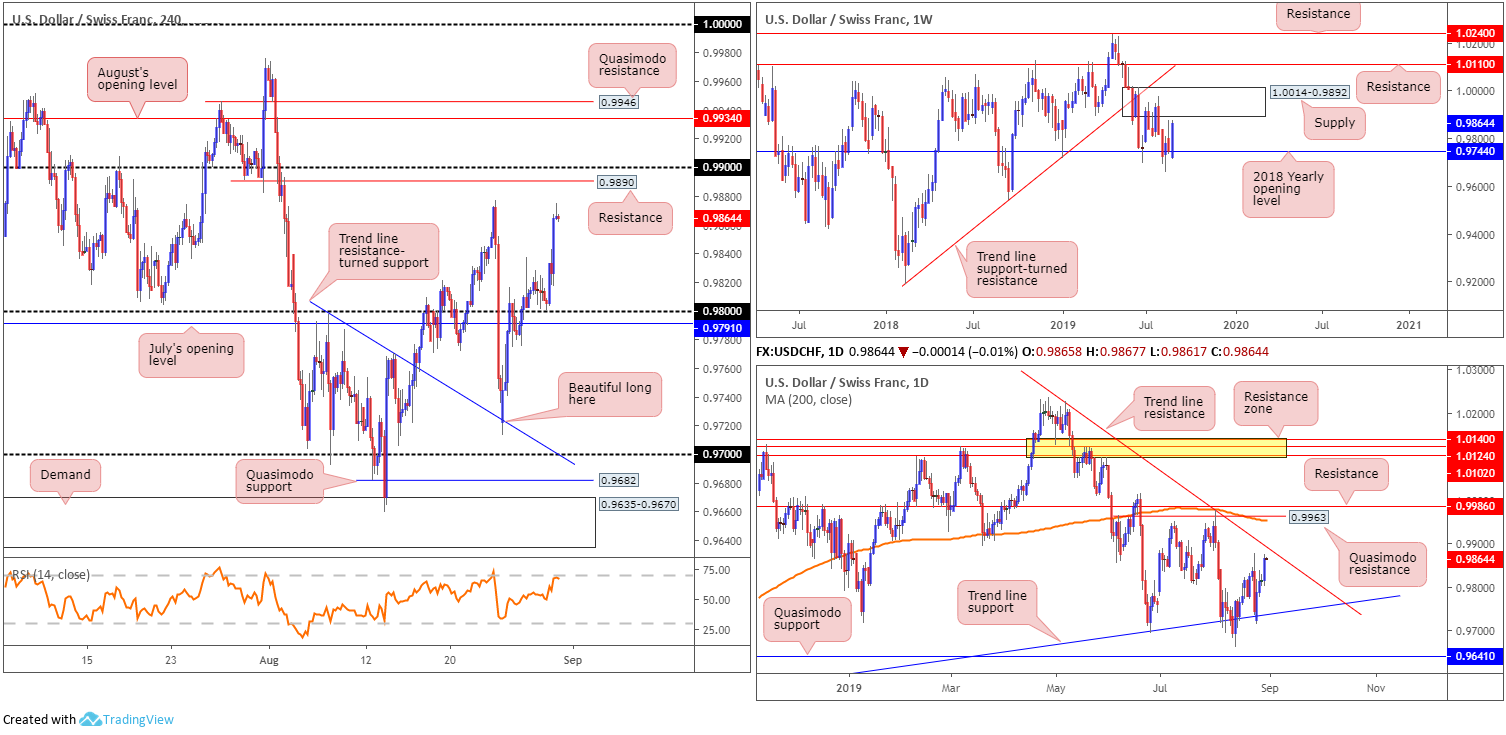
The next upside targets on the H4 timeframe can be seen around the 0.9877 August 23 high, closely trailed by resistance plotted at 0.9890 and then the 0.99 handle as the final port of call.
Weekly impetus derived from the 2018 yearly opening level at 0.9744 (support), which has an upside target set at supply coming in from 1.0014-0.9892, and daily price finding its feet off trend line support taken from the low 0.9542, is likely to fuel upside above 0.98 on the H4 scale. Note the next upside target on the daily timeframe can be seen in the form of a trend line resistance (etched from the high 1.0226).
In the event further buying emerges above 0.98, as the higher-timeframes suggest, a bullish scenario may occur. Conservative traders will likely look for a retest play at 0.98, preferably in the shape of a H4 bullish candlestick signal (entry and risk can be governed according to this structure).
As can be seen on the H4 timeframe, the unit came within touching distance of retesting 0.98 in the shape of a hammer formation. Traders who entered long on the back of this formation ended Thursday in healthy gains. Well done. Just north of current price, we have the first upside target in view: the 0.9877 August 23 high. Therefore, for those long this market, reducing risk to breakeven and liquidating a portion of the position is certainly an option here.
Areas of consideration:
The 0.99 handle on the H4 timeframe is likely of interest for possible shorting opportunities this morning. Its appeal stems from surrounding confluence: the underside of weekly supply at 0.9892, daily trend line resistance and H4 resistance at 0.9890. Therefore, should a H4 bearish candlestick formation emerge from 0.99 today, this, owing to the noted confluence, is considered a strong sell signal. The reason for requiring additional candlestick confirmation is simply due to the threat of price action whipsawing through 0.99 (common viewing around psychological numbers). In addition to this, a bearish candlestick provides entry and risk levels to work with.
Dow Jones Industrial Average:
US stocks notched up additional gains Thursday after comments from Chinese officials spurred hopes among investors for a resolution to Washington’s trade war with Beijing. The Dow Jones Industrial Average added 326.15 points, or 1.25%; the S&P 500 also added 36.64 points, or 1.27% and the tech-heavy Nasdaq 100 climbed 114.42 points, or 1.51%.
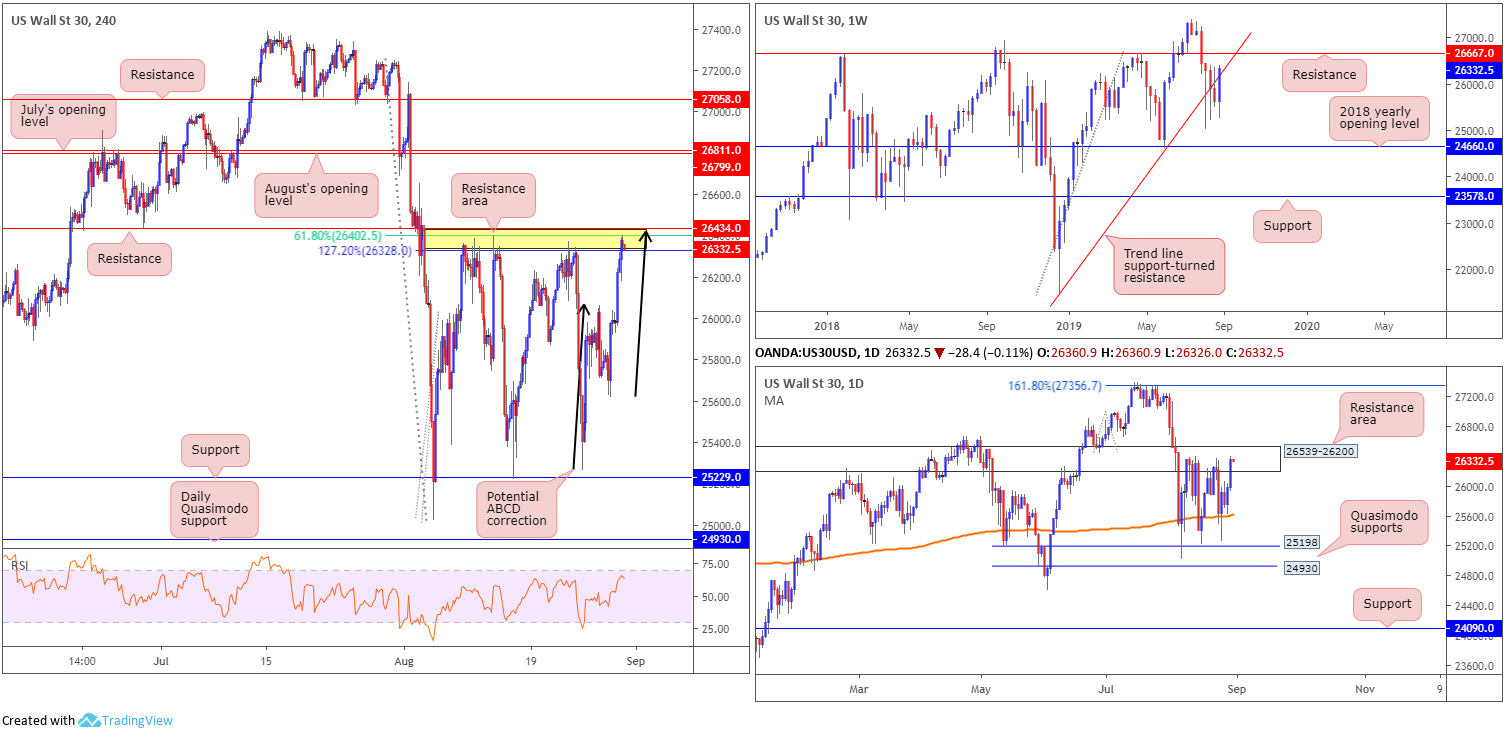
Recent upside drove the H4 candles towards a familiar resistance zone at 26434/26328 (comprised of resistance at 26434, a 127.2% Fibonacci ext. point at 26328 and a 61.8% Fibonacci retracement value at 26402). This is the fourth time the index visited this area this month, with the approach completing by way of an ABCD formation (black arrows). Beyond here, July and August’s opening levels reside reasonably close by at 26811 and 26799, respectively.
Higher-timeframe analysis reveals daily flow recently entered the walls of a resistance area coming in at 26539-26200. The story on the weekly timeframe, however, shows price action testing the underside of a recently broken long-term trend line support (taken from the low 21452). A successful retest at this base could spark another wave of selling. Failing that, traders’ crosshairs will likely be fixed on resistance at 26667.
What’s also notable from a technical perspective is the said daily resistance zone is sited just south of weekly resistance at 26667 and merges with the current weekly trend line resistance.
Areas of consideration:
Longer term, the research team has eyes on the trend line support-turned resistance on the weekly timeframe. A rejection off this line could spell trouble for longs, with the next downside target on this scale coming in at the 2018 yearly opening level at 24660.
Medium term (H4), crosshairs remain on the H4 resistance area at 26434/26328 for additional reactions, owing to the zone being positioned within the limits of the daily resistance area, which as we already know has a connection to the weekly trend line resistance. Therefore, keep an eye open for H4 bearish candlestick patterns out of this zone – think shooting star patterns or bearish engulfing formations. Traders then have the option of setting entry/risk levels based on the H4 or daily resistance areas, or simply on the back of the bearish candlestick structure.
XAU/USD (GOLD):
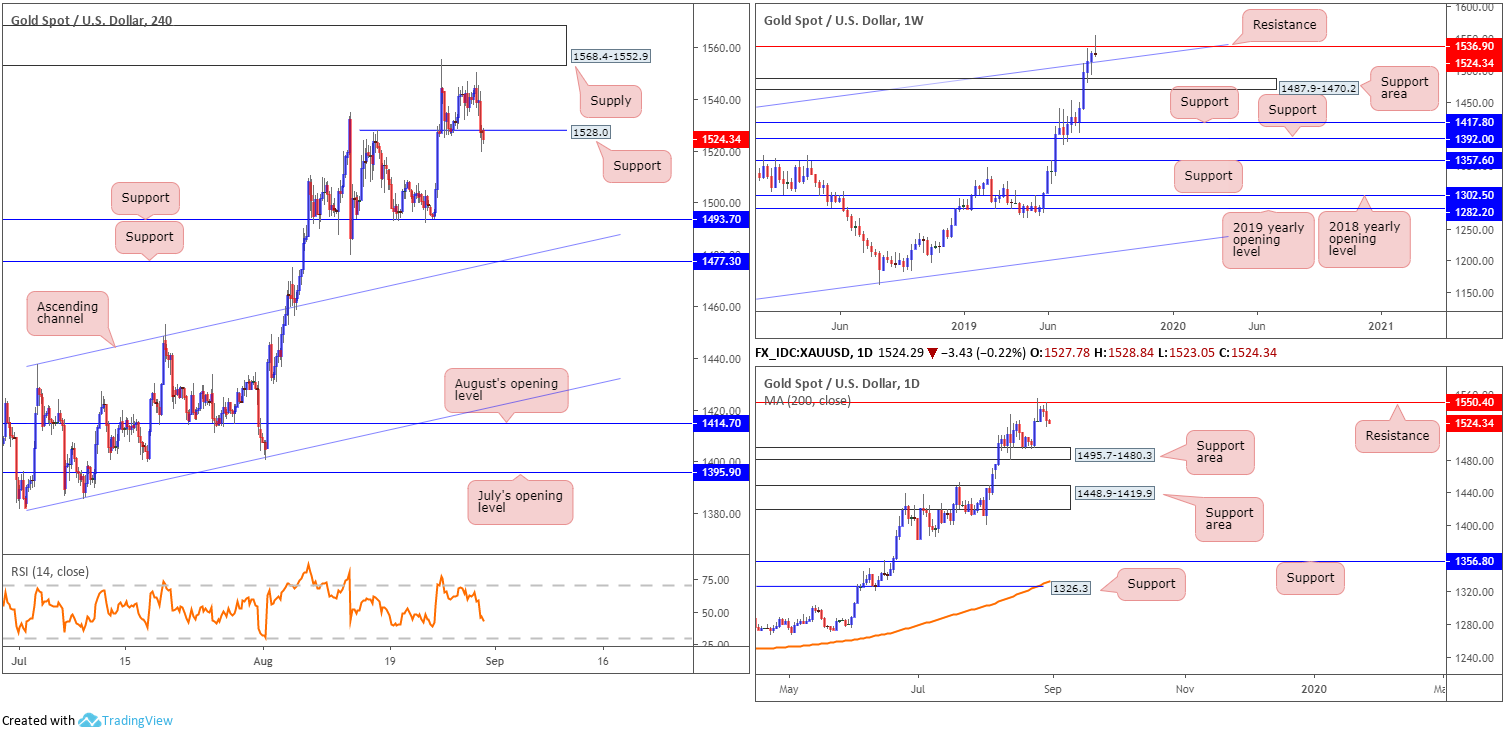
Market sentiment improved modestly Thursday, consequently weakening demand for bullion. Leaving the lower boundary of H4 supply unchallenged at 1568.4-1552.9, the candles turned lower and mildly overthrew support at 1528.0.
Weekly movement is, once again, seen challenging resistance at 1536.9, with price action on track to end the session in the shape of a shooting star formation. Despite this, support resides nearby by way of a channel resistance-turned support line (extended from the high 1375.1).
By the same token, daily price tested resistance at 1550.4 and wrapped up Thursday printing a notable outside bearish day formation. As is evident from the chart, the next downside target from here falls in around a support area at 1495.7-1480.3.
Areas of consideration:
Outlook remains unchanged:
With all three timeframes exhibiting potential to explore lower ground a move lower is on the cards. Given the current uptrend, however, traders may want to consider waiting for the H4 candles to print a decisive close beneath 1528.0 and open the runway south to 1493.7. By doing so, traders have the option of either selling the breakout candle directly or waiting and seeing if a retest at 1528.0 materialises, preferably in the form of a bearish candlestick pattern (entry/risk can be determined according to this formation).
The accuracy, completeness and timeliness of the information contained on this site cannot be guaranteed. IC Markets does not warranty, guarantee or make any representations, or assume any liability regarding financial results based on the use of the information in the site.
News, views, opinions, recommendations and other information obtained from sources outside of www.icmarkets.com.au, used in this site are believed to be reliable, but we cannot guarantee their accuracy or completeness. All such information is subject to change at any time without notice. IC Markets assumes no responsibility for the content of any linked site.
The fact that such links may exist does not indicate approval or endorsement of any material contained on any linked site. IC Markets is not liable for any harm caused by the transmission, through accessing the services or information on this site, of a computer virus, or other computer code or programming device that might be used to access, delete, damage, disable, disrupt or otherwise impede in any manner, the operation of the site or of any user’s software, hardware, data or property.


