
DXY:
The DXY chart is currently exhibiting bullish momentum, with its position above the bullish Ichimoku cloud suggesting further bullish activity. In the short term, the price may decline to the 1st support at 105.41, an overlap support reinforced by a 23.60% Fibonacci Retracement, before experiencing a bounce towards the 1st resistance at 106.76. An additional support level is observed at 104.42, also an overlap support, enhanced by a 38.20% Fibonacci Retracement, offering an additional layer of defense against price declines.
On the resistance side, the chart’s 1st resistance at 106.76, acting as a multi-swing high resistance, plays a crucial role in the potential price movements. Furthermore, an intermediate support level is found at 105.85, serving as a pullback support, providing another potential support zone in the market dynamics.

EUR/USD:
The EUR/USD chart currently displays bearish momentum, primarily due to its position below the bearish Ichimoku cloud. In the short term, there might be a rise towards the 1st resistance at 1.0636 before reversing and declining towards the 1st support at 1.0486. The 1st support at 1.0486, identified as a swing low support, offers a substantial base for the price.
On the resistance side, the 1st resistance at 1.0636, characterized as pullback resistance and aligned with the 61.80% Fibonacci Retracement, presents a potential obstacle to upward movements. Beyond this level, the 2nd resistance is found at 1.0733, acknowledged as a swing high resistance, providing another layer of restriction to the price.
Additionally, an intermediate resistance situated at 1.0581, known as an overlap resistance and associated with the 38.20% Fibonacci Retracement

EUR/JPY:
The EUR/JPY chart currently exhibits a bullish overall momentum, indicating a positive sentiment in the market. There’s potential for a bullish continuation in the price movement towards its first resistance.
The first support level at 157.84 is considered a good level of support due to its characteristics as a pullback support, which suggests that it may act as a foundation for any potential bullish movement. Additionally, the second support at 157.12, also identified as a pullback support, provides further reinforcement for the bullish case, indicating potential stability in this price range.
Looking ahead, the chart faces its first resistance at 158.53, which is characterized as a multi-swing high resistance. This level represents a key obstacle that, if breached, could signify a strong bullish move. Beyond this, there is a second resistance at 159.21, identified as a pullback resistance, which may serve as an additional target for bullish price action.
In summary, the bullish momentum in the EUR/JPY chart, supported by pullback supports, suggests the potential for a bullish continuation towards the first and second resistance levels, indicating opportunities for further price appreciation.

EUR/GBP:
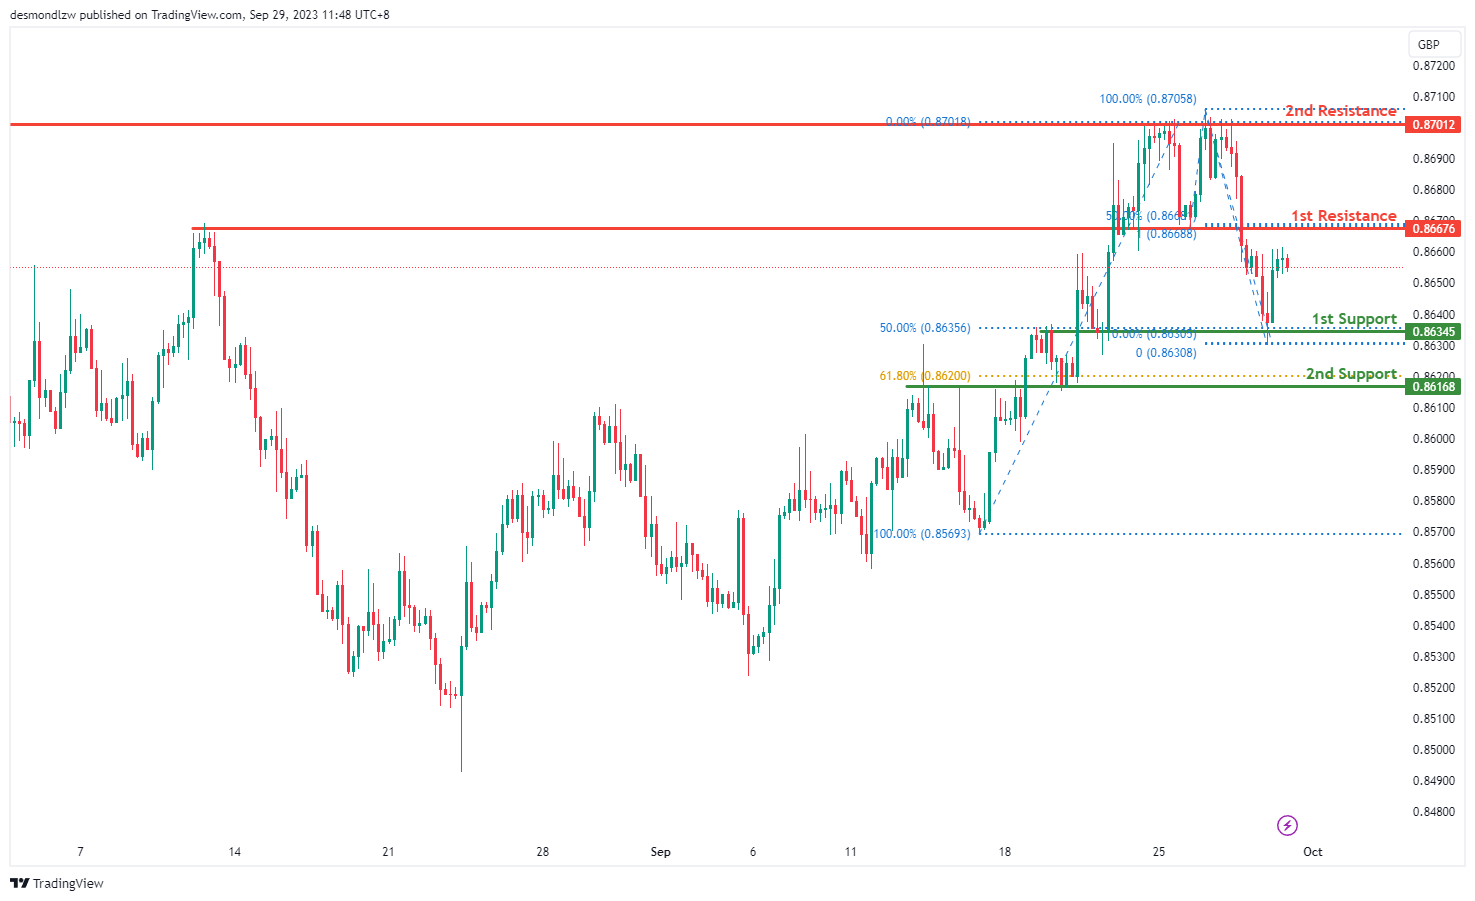
The EUR/GBP chart currently exhibits a bearish overall momentum, suggesting a prevailing downtrend in the market. However, there is a potential short-term price movement anticipated, which could involve a rise towards the first resistance before reversing and declining towards the first support level.
The first support level at 0.8634 is considered a significant support zone as it represents an overlap support and coincides with the 50% Fibonacci Retracement level. This level may act as a foundation for potential price reversals or as a target for bearish movements. Additionally, the second support at 0.8616, identified as an overlap support and aligned with the 61.80% Fibonacci Retracement, provides further support for potential price rebounds.
In the short term, the chart is expected to face its first resistance at 0.8667. This level is characterized as a pullback resistance and coincides with the 50% Fibonacci Retracement, making it a pivotal point where a reversal may occur. Beyond this, there is a second resistance at 0.8701, which is identified as a multi-swing high resistance, signifying a formidable barrier for bullish advances.
In summary, while the overall momentum of the EUR/GBP chart remains bearish, there is a short-term scenario in which the price may rise towards the first resistance before encountering potential selling pressure, leading to a subsequent drop towards the first and second support levels.
GBP/USD:
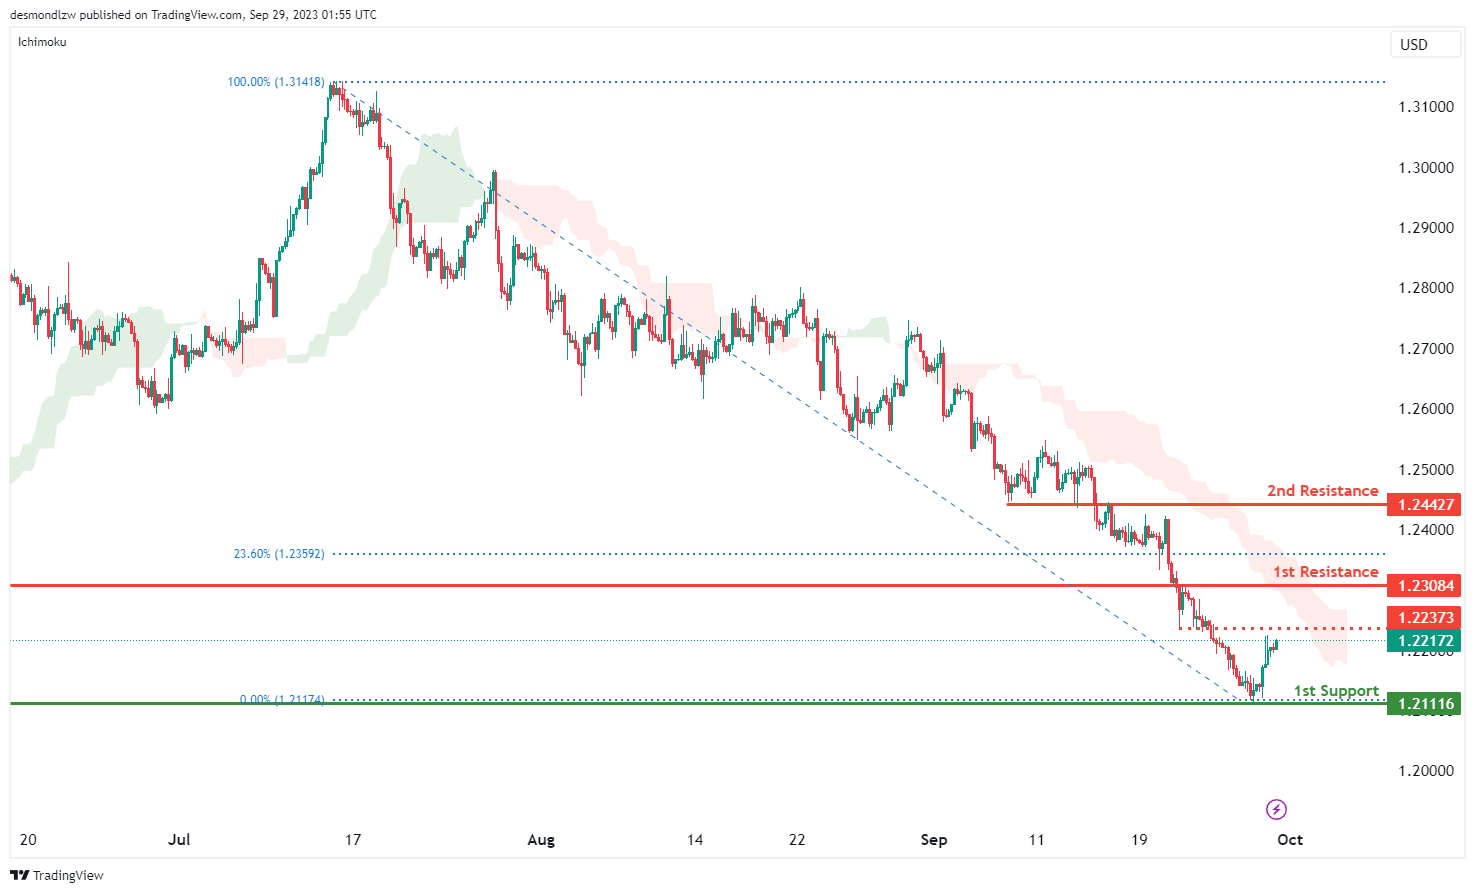
The GBP/USD chart is currently manifesting bearish momentum, with its positioning below the bearish Ichimoku cloud being a significant contributor to this trend. A potential scenario envisions a bullish bounce off the 1st support level at 1.2111, subsequently heading towards the 1st resistance. The 1st support level is crucial, identified as an overlap support, serving as a foundational base for price movements.
On the resistance side, the 1st resistance level is pegged at 1.2308, acting as a pullback resistance, poised to potentially limit initial upward trajectories. Following closely, the 2nd resistance at 1.2442, characterized as an overlap resistance, introduces another potential ceiling to bullish price advances. Furthermore, an intermediate resistance is observed at 1.2237, serving as a pullback resistance
GBP/JPY:
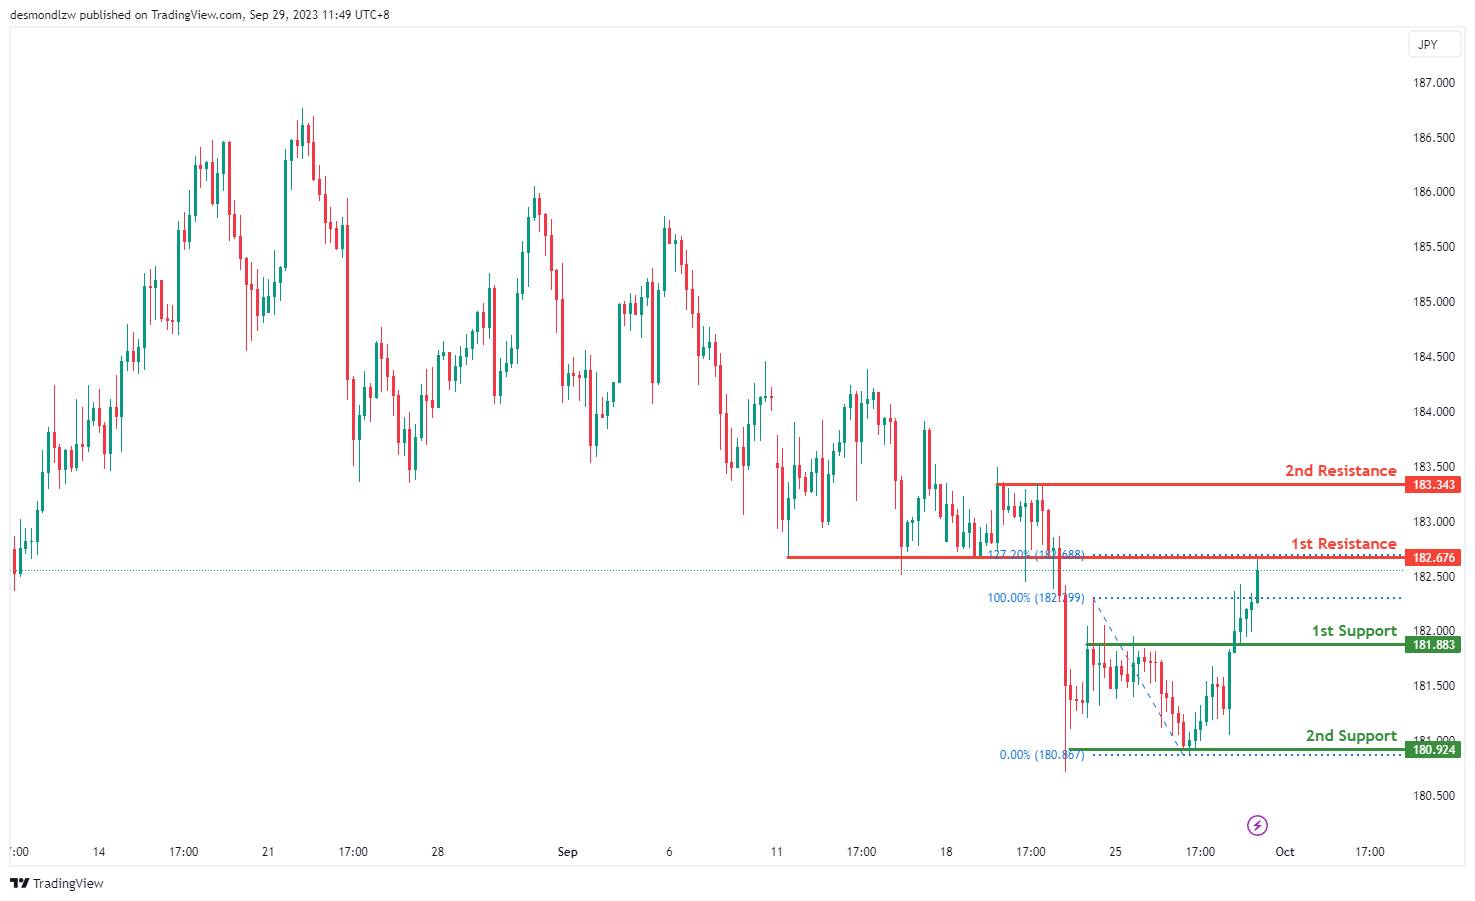
The GBP/JPY chart currently exhibits a bearish overall momentum, indicating a prevailing downtrend in the market. It is anticipated that the price may experience a bearish reaction off the first resistance level, potentially leading to a decline towards the first support.
The first support level at 181.88 is considered a significant support zone, characterized as an overlap support. This level holds historical significance and may act as a strong foundation for potential price rebounds or as a target for bearish movements. Additionally, the second support at 180.92 is identified as a multi-swing low support, reinforcing its significance as a potential level where buyers could step in.
In terms of resistance, the chart is expected to encounter its first resistance at 182.67. This level is defined as a pullback resistance and is further strengthened by the presence of the 127.20% Fibonacci Extension, making it a critical zone for potential reversals or bearish reactions. Beyond this, there is a second resistance at 183.34, identified as a multi-swing high resistance, indicating a substantial barrier for bullish advances.
In summary, while the overall momentum of the GBP/JPY chart remains bearish, there is a scenario in which the price could react bearishly off the first resistance and decline towards the first and second support levels.
USD/CHF:
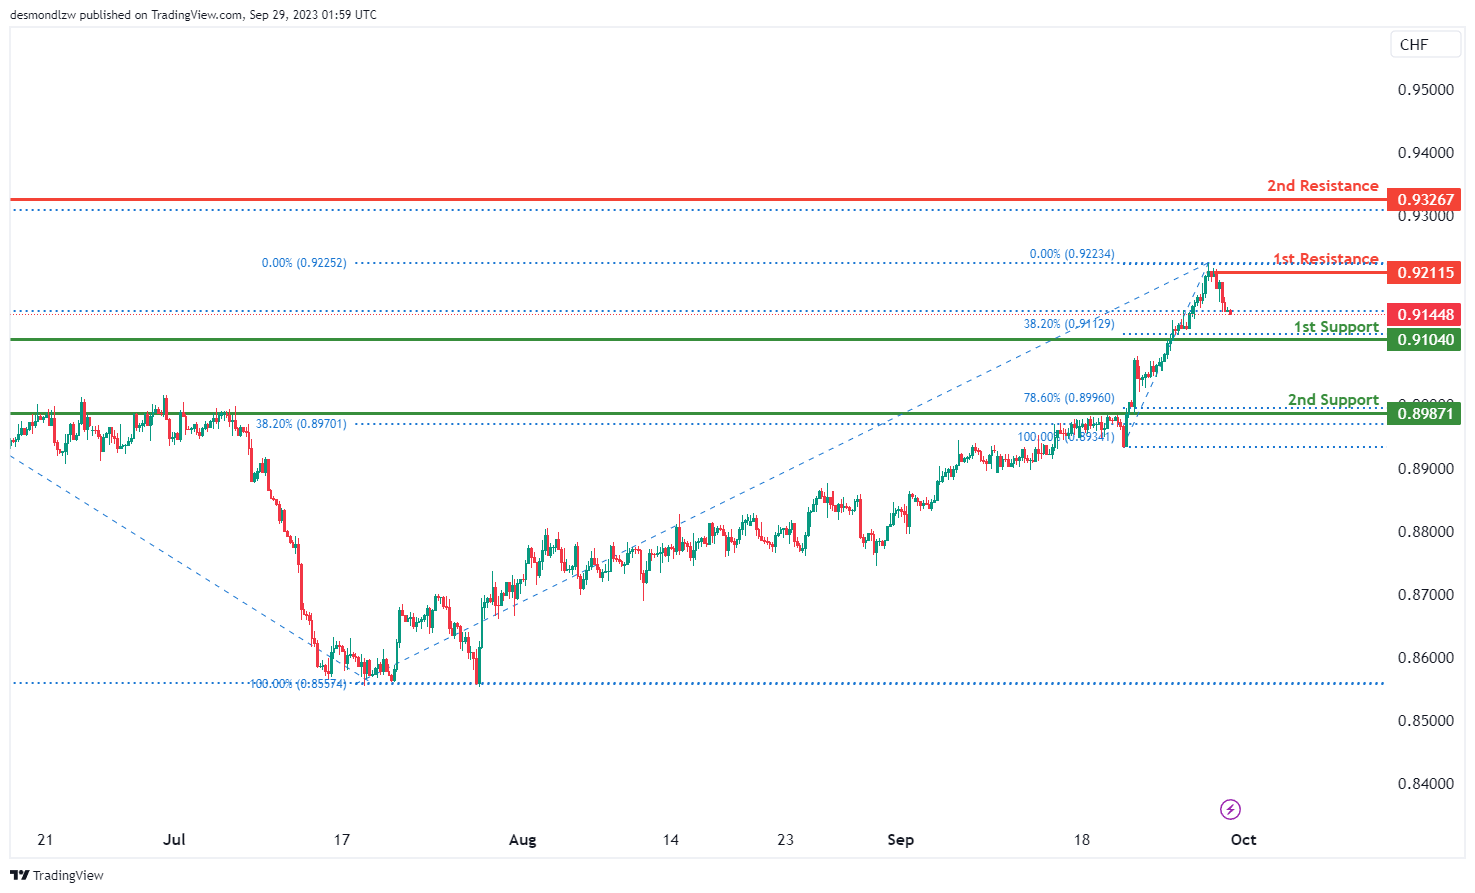
The USD/CHF chart currently exhibits bearish momentum with an anticipated bearish continuation towards the 1st support at 0.9104. This support level is significant, serving as a pullback support and aligning with the 38.20% Fibonacci Retracement, providing a possible foundation for the price. Additionally, the 2nd support at 0.8987, acting as another pullback support and coinciding with the 78.60% Fibonacci Retracement, further underpins the price.
On the resistance side, the 1st resistance at 0.9211 is noteworthy, identified as a multi-swing high resistance that may act as an initial barrier to upward movements. Beyond this level, the 2nd resistance at 0.9326, characterized as a swing high resistance and aligning with the 127.20% Fibonacci Extension, presents another potential limit to bullish price advancements.
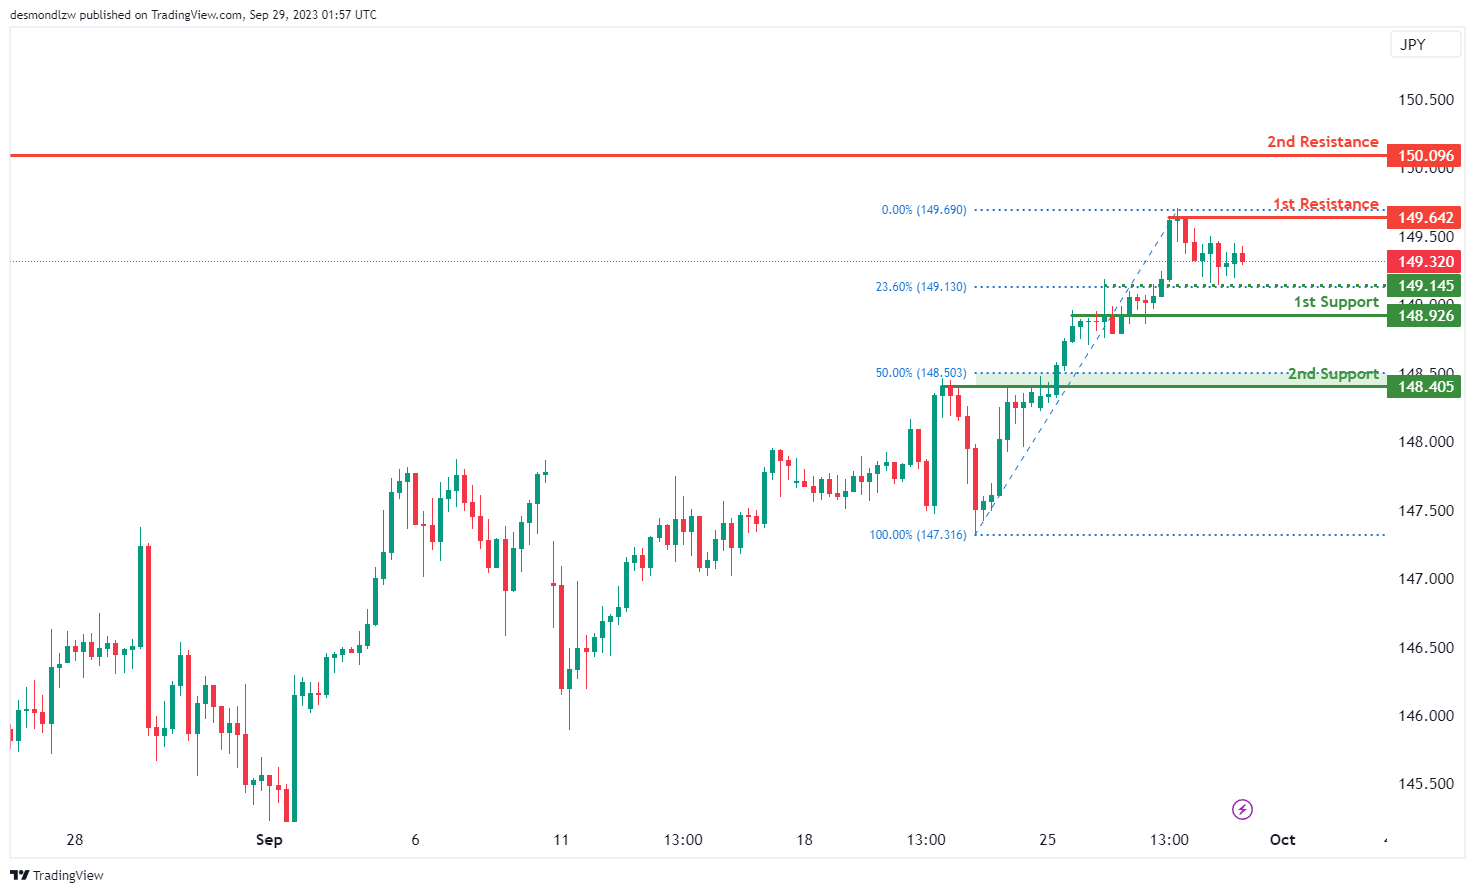
USD/JPY:
The USD/JPY chart is currently demonstrating bearish momentum, with expectations of a bearish continuation towards the 1st support at 148.92. This level is significant, and recognized as an overlap support, providing a reliable foundation for the price. Additionally, the 2nd support at 148.40 is notable, functioning as a pullback support and aligning with the 50% Fibonacci Retracement, further strengthening its role as a key support level.
On the resistance side, the 1st resistance at 149.32 is crucial, identified as a swing-high resistance, potentially limiting initial upward movements. Beyond this, the 2nd resistance at 150.09, also a swing-high resistance, represents another potential barrier to upward price movements. Additionally, an intermediate support level is identified at 149.14, acting as an overlap support, offering further price stability
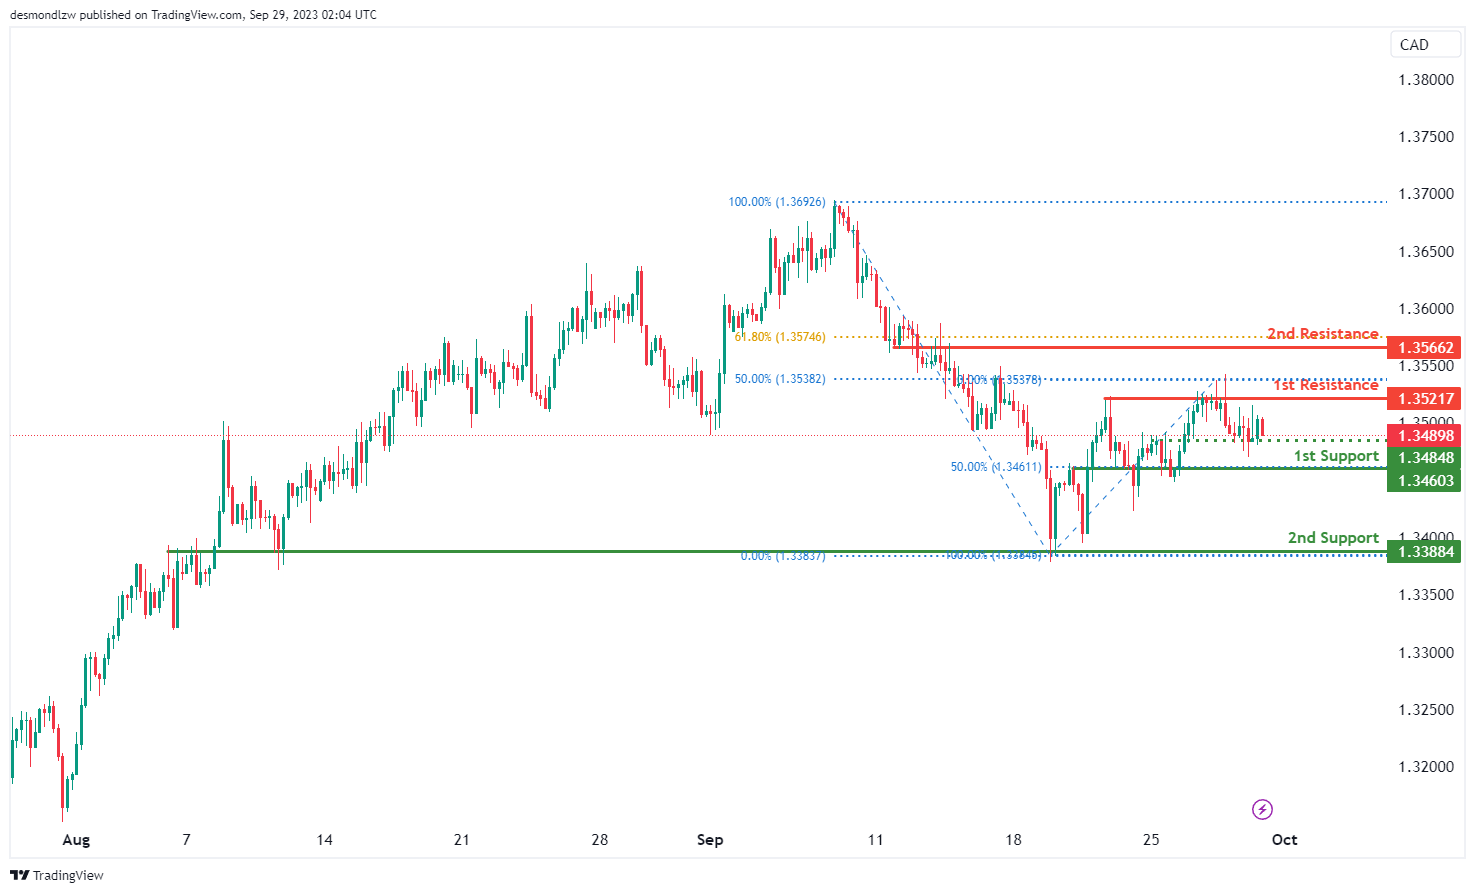
USD/CAD:
The USD/CAD chart is currently exhibiting bearish momentum with expectations for a continued downward movement towards the 1st support at 1.3460. This support level is significant, recognized as an overlap support, and aligns with the 50% Fibonacci Retracement, providing a robust foundation for the price. Further supporting the price, there’s the 2nd support level at 1.3388, also identified as an overlap support, offering additional reinforcement for the bearish trend.
On the resistance side, the chart highlights the 1st resistance at 1.3521, a critical level marked as a multi-swing high resistance and coinciding with the 50% Fibonacci Retracement. This convergence underlines its potential role as a significant barrier to any bullish price movements. Beyond this level, the 2nd resistance at 1.3566, is noted as an overlap resistance and aligning with the 61.80% Fibonacci Retracement
AUD/USD:
The AUD/USD chart is currently showcasing bullish momentum with expectations for a bullish continuation towards the 1st resistance at 0.6470. This resistance level is vital, serving as a pullback resistance and aligning with the 78.60% Fibonacci Retracement, highlighting its importance in the market dynamics. Furthermore, the 2nd resistance is located at 0.6510, acting as a multi-swing high resistance, further emphasizing its role as a significant barrier to upward movements in the price.
On the support side, the 1st support level is pinpointed at 0.6391, characterized as a pullback support, providing a potential floor for the price. An additional support level is observed at 0.6332, recognized as a multi-swing low support,

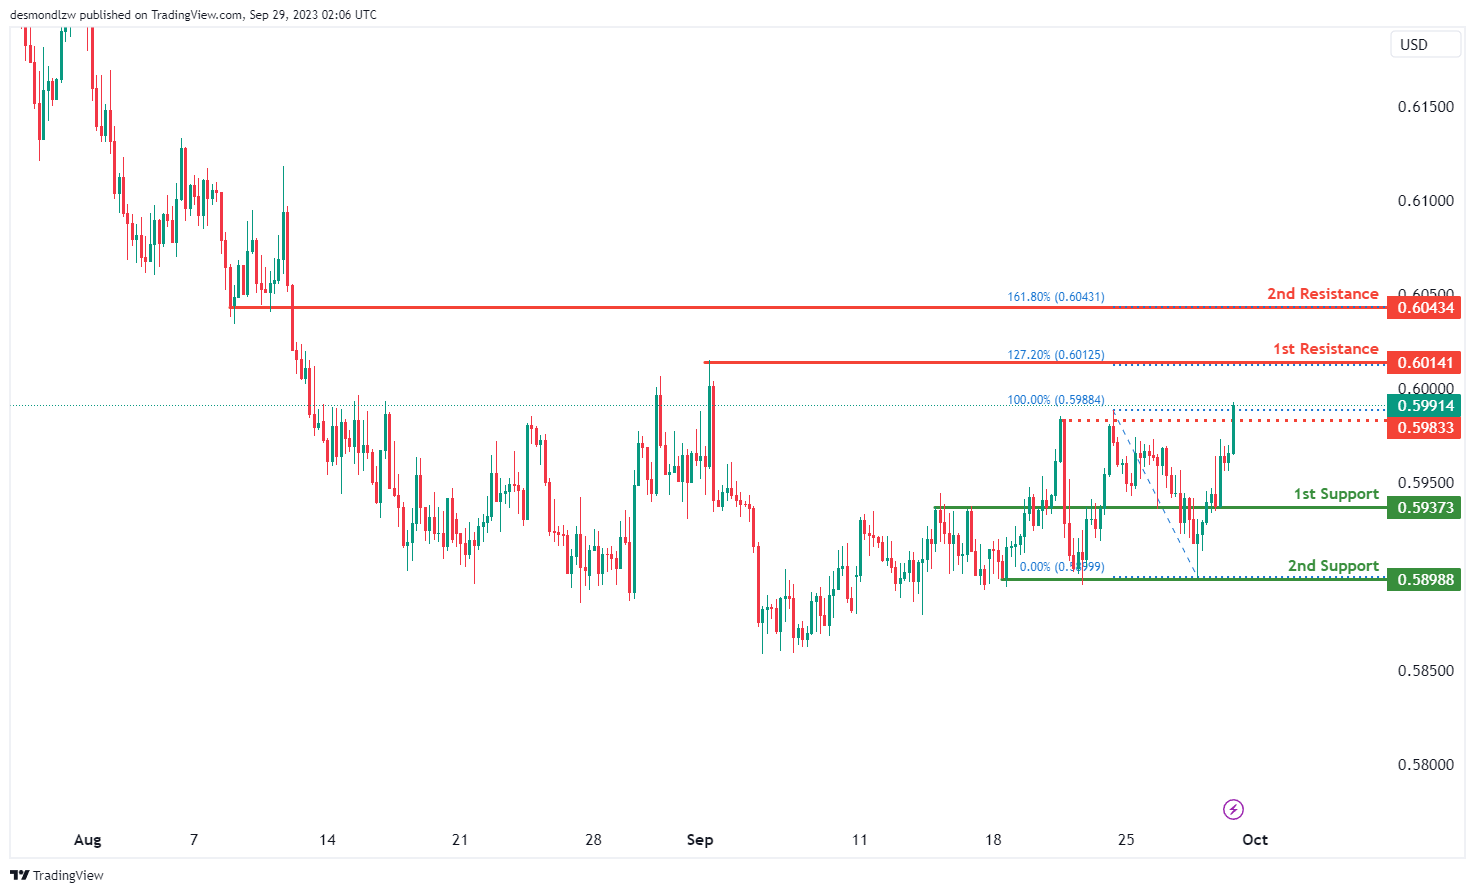
NZD/USD
The NZD/USD chart is exhibiting bullish momentum with expectations of a bullish continuation towards the 1st resistance at 0.6014. This resistance level is significant, acting as a multi-swing high resistance and aligning with the 127.20% Fibonacci Extension, providing a potential barrier to the price’s upward movement. Additionally, there is a 2nd resistance also set at 0.6014, serving as a pullback resistance and enhanced by the 161.80% Fibonacci Extension, fortifying its role as a significant resistance level. An intermediate resistance is observed at 0.5983, recognized as a multi-swing high resistance, providing additional potential limitation to upward movements.
On the support side, the 1st support is identified at 0.5937, marked as an overlap support, offering a strong foundation for the price. Further down, the 2nd support located at 0.5898 is significant, characterized as a multi-swing low support
DJ30:
The DJ30 (Dow Jones Industrial Average) chart currently shows a bearish overall momentum, and there is a potential scenario where the price could react bearishly from the 1st resistance and decline towards the 1st support.
The 1st support level at 33,306.43 is considered a significant level because it corresponds to a swing low support. Swing lows represent historical price levels where buying interest has previously emerged, making this level a strong candidate for providing support in a bearish scenario.
There is an intermediate support level at 33,624.15, which is identified as an overlap support. This level coincides with the 38.20% Fibonacci Retracement, adding to its significance. Fibonacci retracement levels are frequently watched by traders for potential reversals or areas of support and resistance.
On the resistance side, the 1st resistance level at 33,790.58 is recognized as an overlap resistance. Overlap resistances often act as barriers to further price increases, as traders may use these levels to take profits or establish short positions.
Above the 1st resistance, the 2nd resistance level at 34,063.44 is noted as an overlap resistance and is also positioned at the 50% Fibonacci Retracement level.

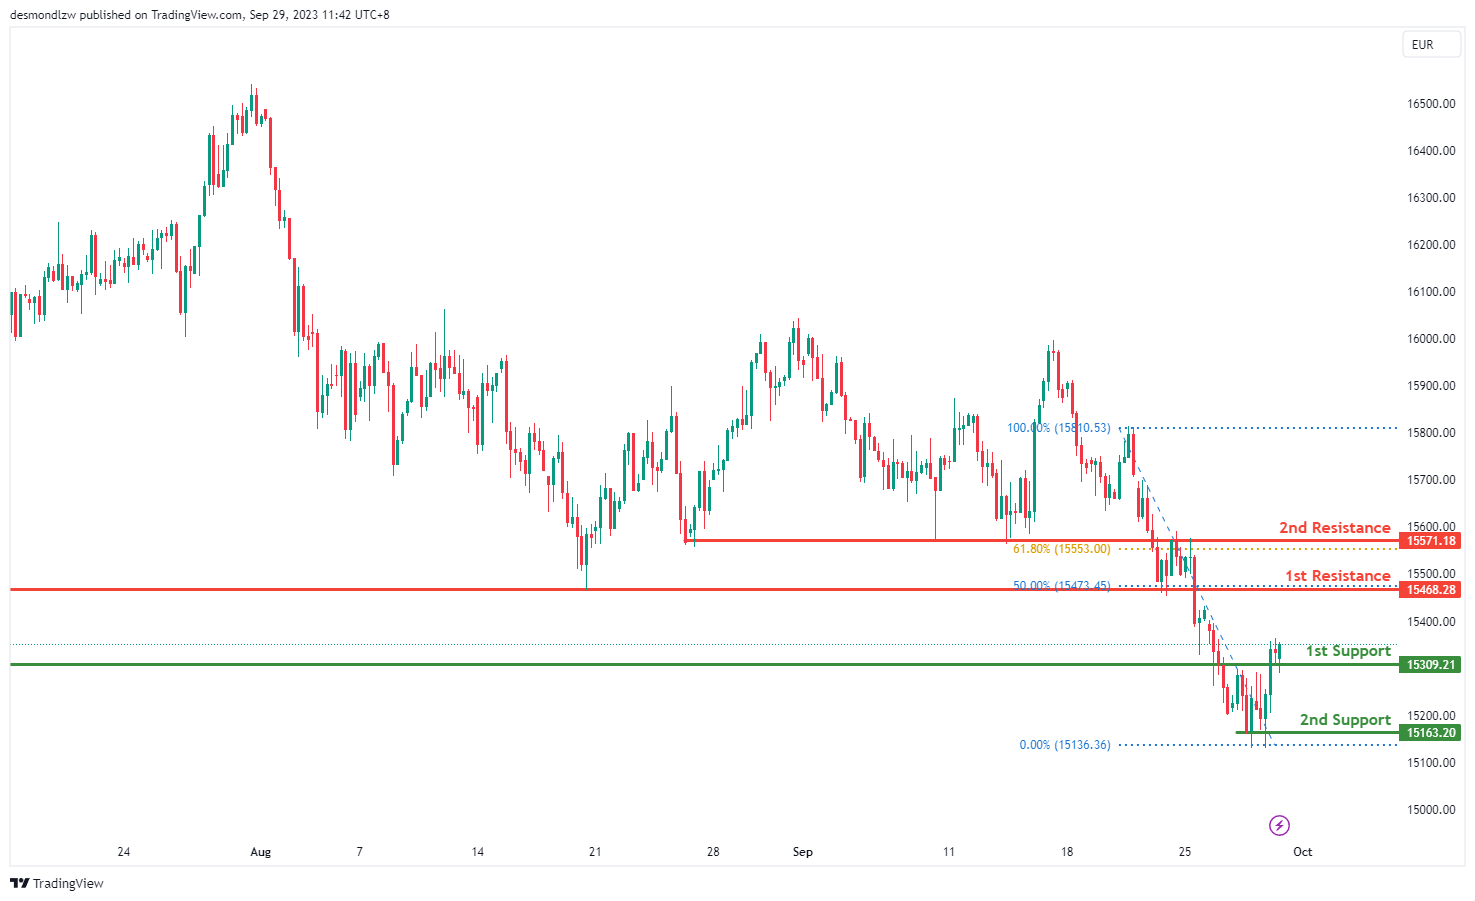
GER30:
The GER30 (Germany 30) chart currently displays a bullish overall momentum, suggesting a positive sentiment in the market. There is a potential scenario in which the price could experience a bullish bounce off the 1st support and subsequently move towards the 1st resistance.
The 1st support level at 15,309.21 is considered a strong support zone as it corresponds to an overlap support. Overlap supports often indicate areas where the price has previously found support and may attract buying interest again.
The 2nd support level at 15,163.20 is another notable support level, identified as a multi-swing low support. This level reinforces the potential for support in the event of a price pullback.
On the resistance side, the 1st resistance level at 15,468.28 is identified as a pullback resistance. This level coincides with the 50% Fibonacci Retracement, a key technical level used by traders to identify potential reversals or areas of resistance.
Above the 1st resistance, the 2nd resistance level at 15,571.18 is marked as an overlap resistance and is also positioned at the 61.80% Fibonacci Retracement.
`US500
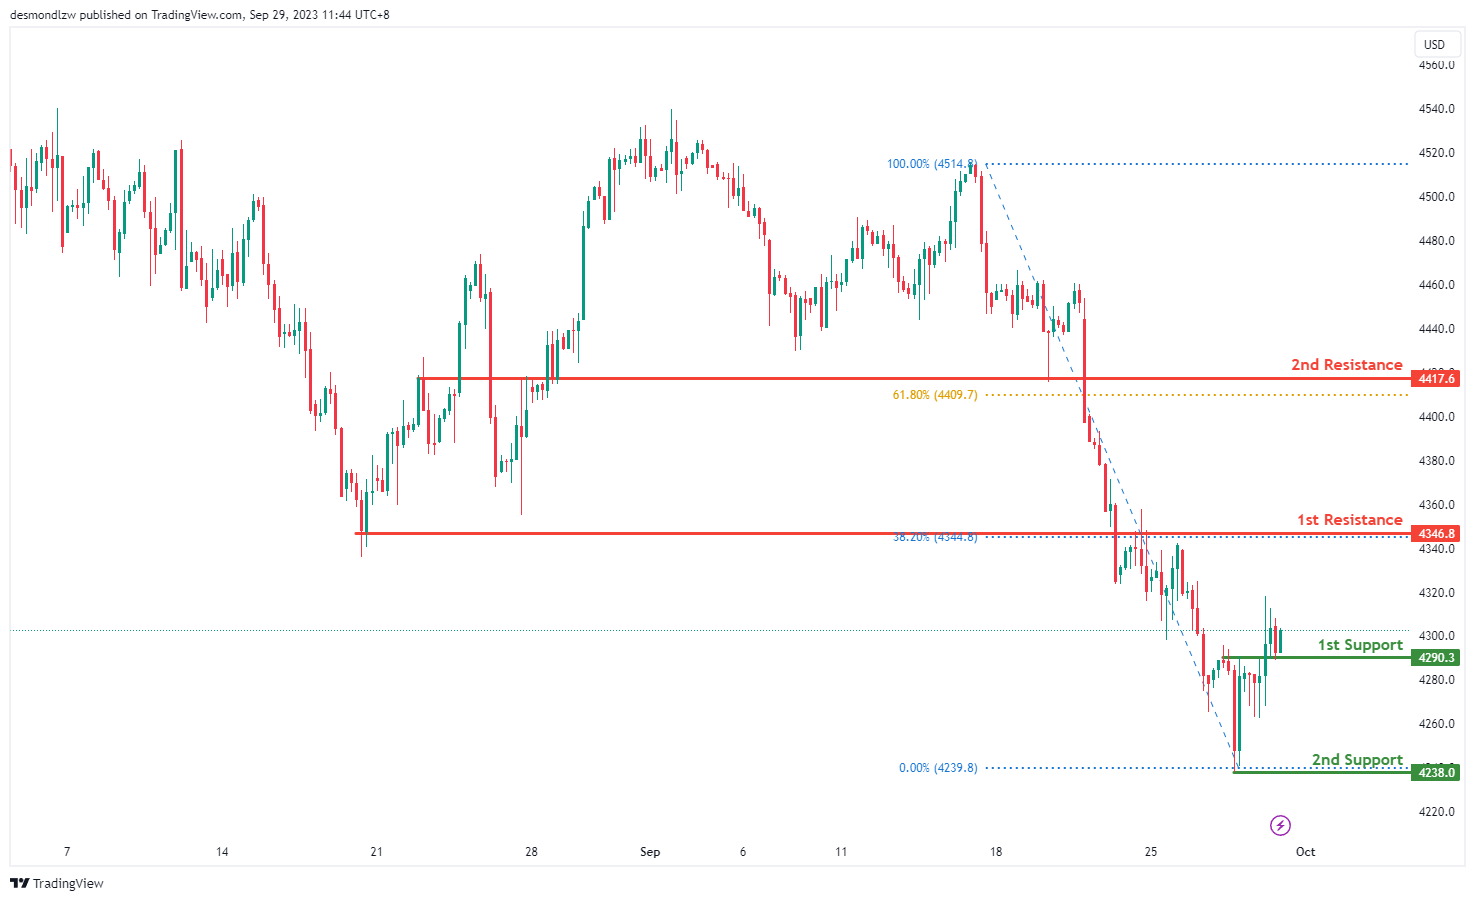
The US500 chart currently exhibits a bullish overall momentum, with several factors contributing to this positive sentiment. Notably, the price has the potential to experience a bullish bounce off its first support level at 4290.3, which is identified as an overlap support. Additionally, the presence of a swing low support at 4238.0 further strengthens the case for a bullish move.
Looking ahead, the chart faces its first resistance at 4346.8, which is characterized by both an overlap resistance and a 38.20% Fibonacci Retracement level. This level represents a significant obstacle that, if overcome, could propel the price higher. Beyond this, there is a second resistance at 4417.6, which serves as a pullback resistance and aligns with a 61.80% Fibonacci Retracement, offering another potential target for bullish movement.
In summary, the US500 chart’s bullish momentum, supported by overlap and swing low supports, suggests the possibility of a bullish bounce at the first support level and a subsequent move towards the first and second resistance levels, which present opportunities for further price appreciation.
BTC/USD:
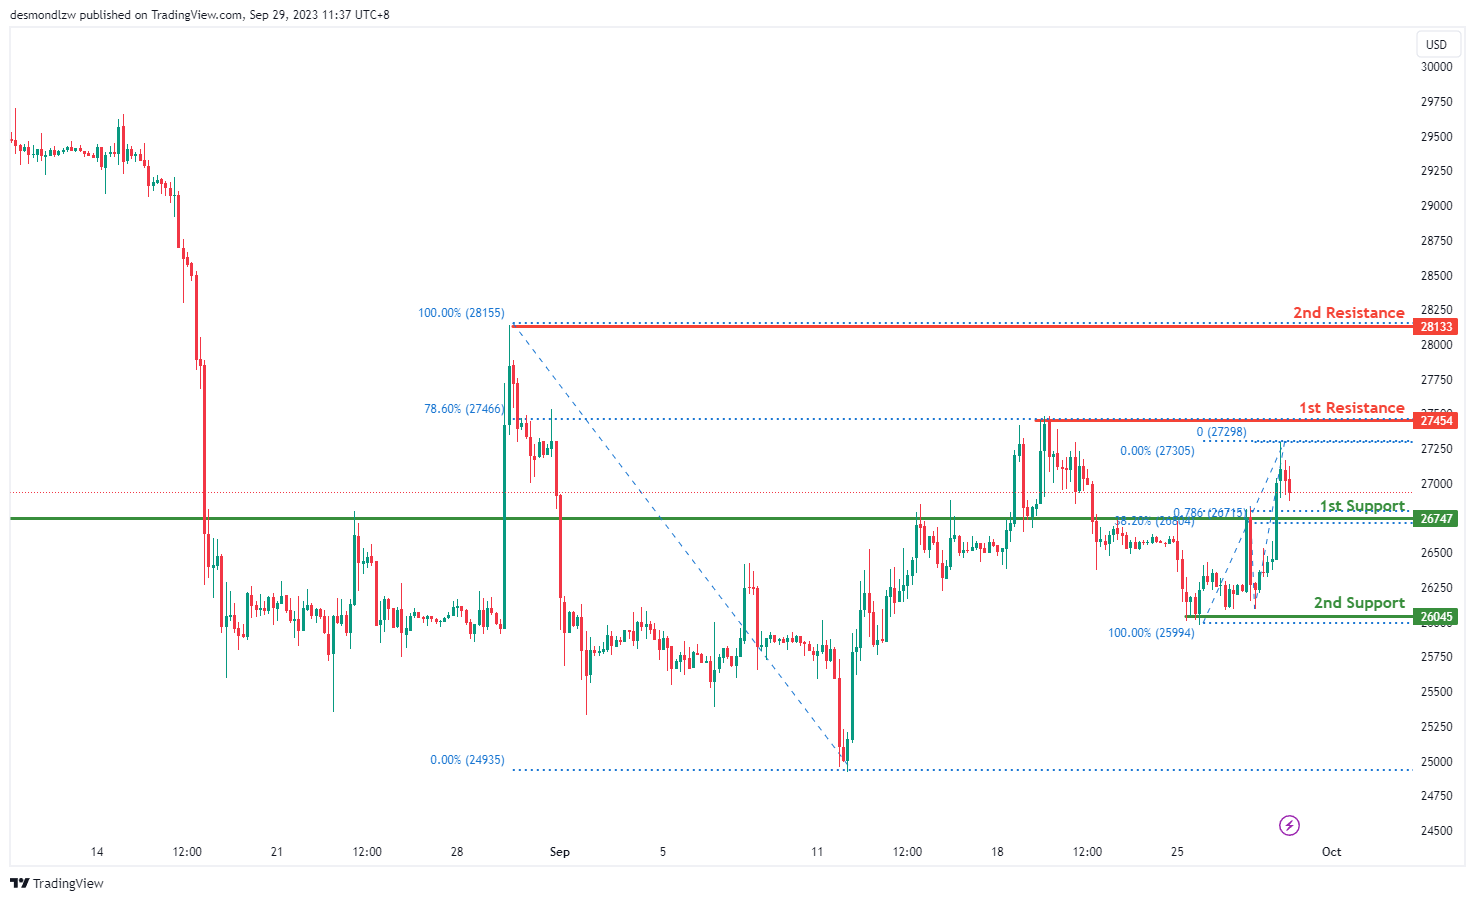
The BTC/USD chart currently exhibits a bullish overall momentum, with several factors contributing to this positive outlook.
The 1st support level at 26,747 is considered a pullback support. This level holds significance as it aligns with the 38.20% Fibonacci Retracement and the 78.60% Fibonacci Projection, indicating a strong Fibonacci confluence. Traders often look at such confluence areas as potential reversal zones where buying interest may surge, leading to a bullish bounce.
Further reinforcing this support is the 2nd support level at 26,045, which corresponds to a swing low support. Swing lows are historical price levels where buying interest has emerged, making this level a strong candidate for providing support in a bullish scenario.
On the resistance side, the 1st resistance level at 27,454 is identified as a swing high resistance. This level could potentially act as a barrier to further price advancement, as traders who missed earlier opportunities to sell may enter the market at this point.
Above that, the 2nd resistance level at 28,133 is also noted as a swing high resistance. This level presents an additional hurdle for bullish price movements.
.
ETH/USD:
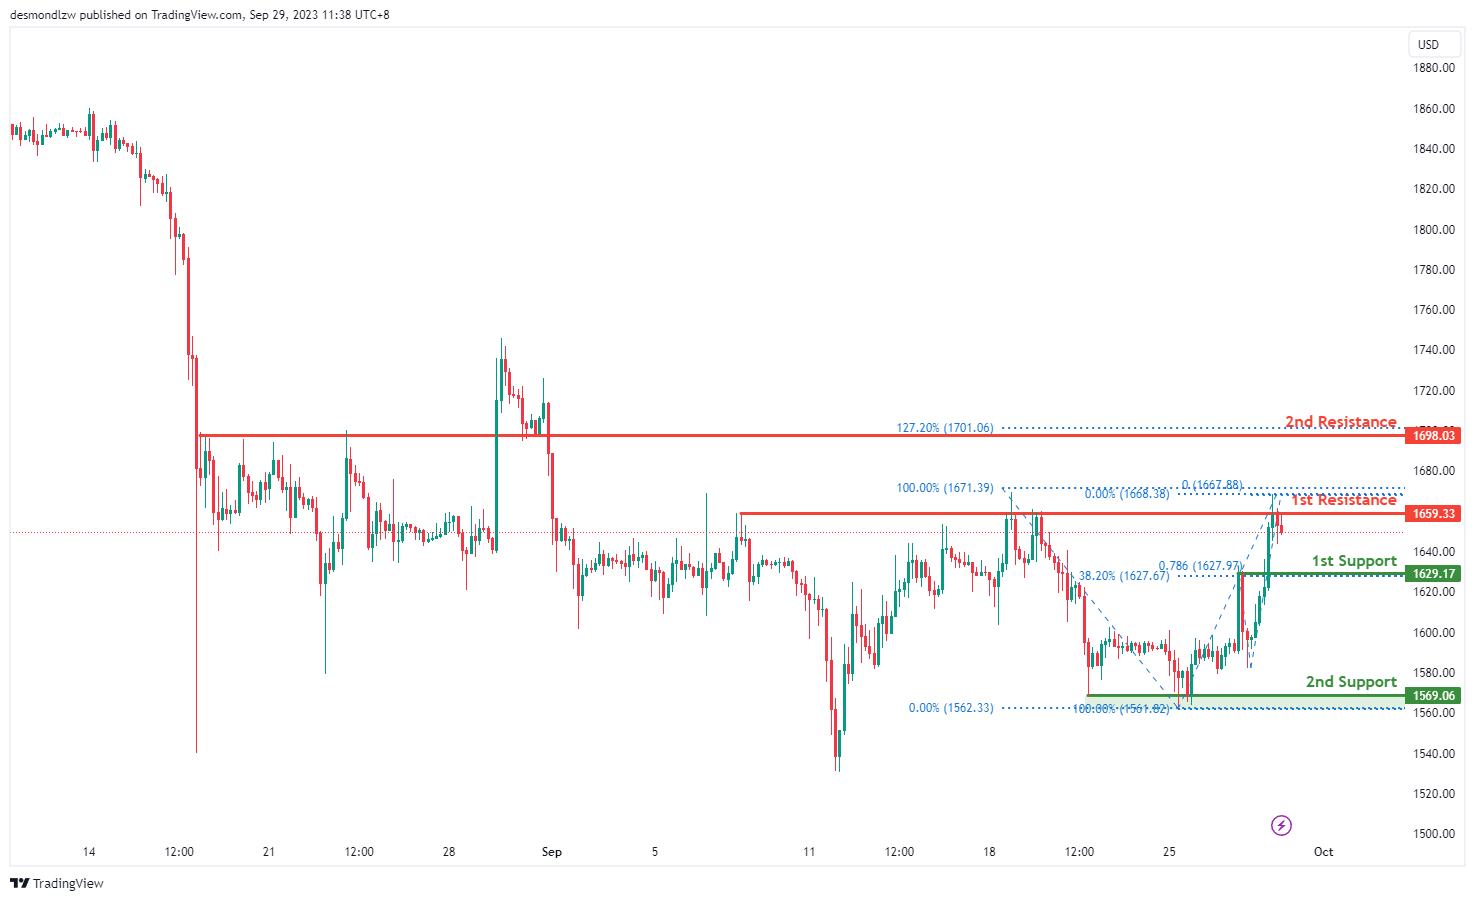
The ETH/USD chart currently exhibits a bullish overall momentum, but there is a potential short-term bearish scenario to consider, followed by a subsequent bullish move.
The 1st support level at 1,629.17 is identified as a pullback support. This level holds significance as it aligns with the 38.20% Fibonacci Retracement and the 78.60% Fibonacci Retracement, indicating a strong Fibonacci confluence. Traders often look at such confluence areas as potential reversal zones where buying interest may surge, leading to a bounce in prices.
The 2nd support level at 1,532.48 corresponds to a swing low support. Swing lows are historical price levels where buying interest has emerged, making this level a strong candidate for providing support in a bearish scenario.
In the short term, the price could potentially drop further to test the 1st support level. This move may be driven by profit-taking or short-term bearish sentiment.
However, the chart’s overall bullish momentum suggests that after reaching the 1st support, there is a possibility of a bounce. Traders may see this as an opportunity to enter bullish positions.
On the resistance side, the 1st resistance level at 1,659.33 is identified as a multi-swing high resistance. This level could potentially act as a barrier to further price advancement, as traders who missed earlier opportunities to sell may enter the market at this point.
Above that, the 2nd resistance level at 1,698.03 is noted as a pullback resistance. This level presents an additional hurdle for bullish price movements.
WTI/USD:
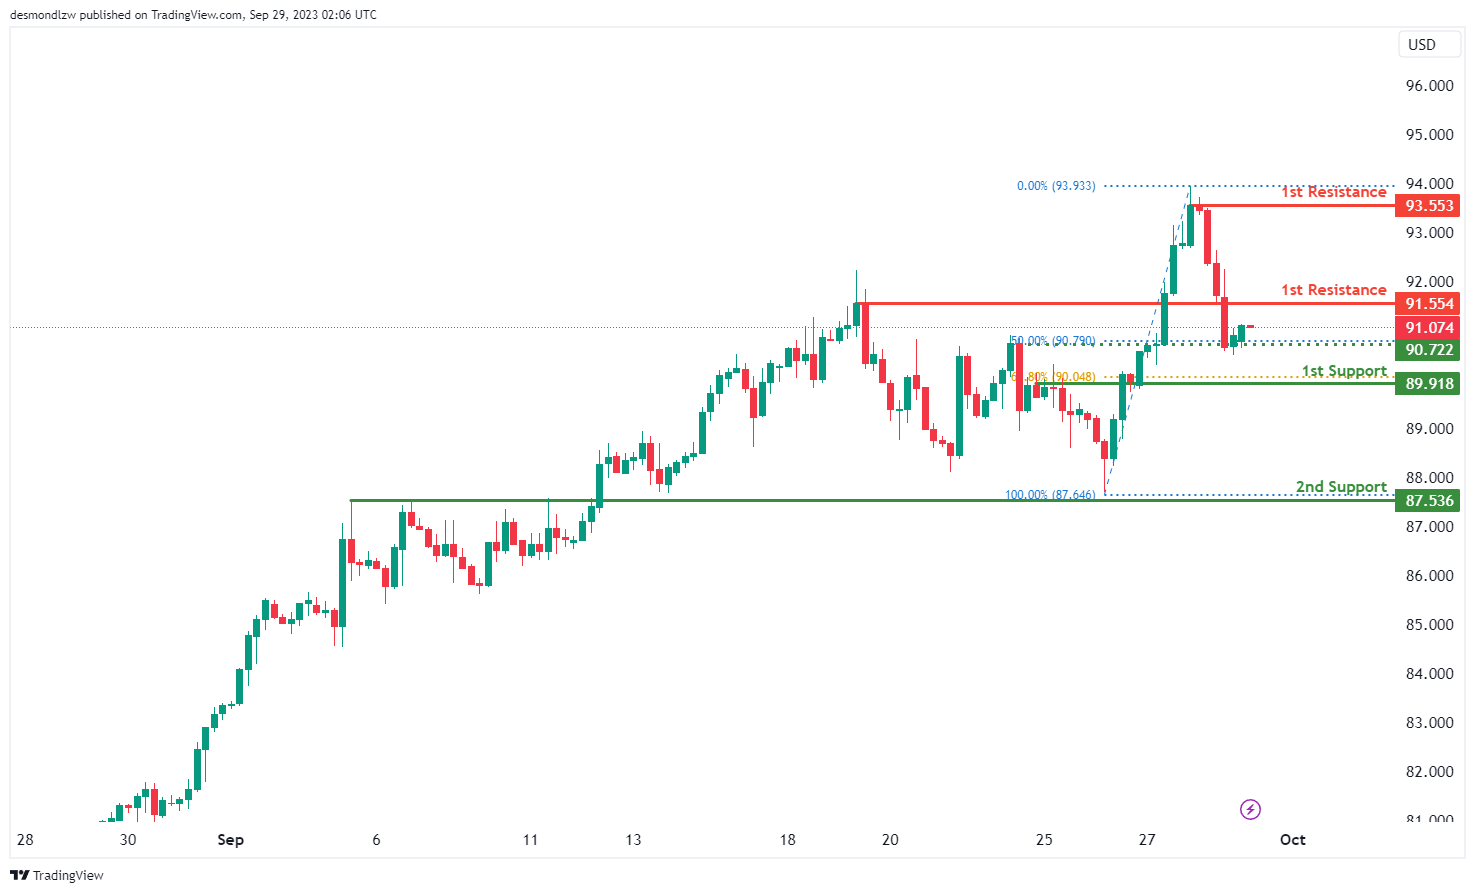
The WTI chart is currently displaying bearish momentum, expecting to continue its bearish movement towards the 1st support at 89.91. This support level, characterized as a pullback support, aligns with the 61.80% Fibonacci Retracement, underpinning its importance as a potential supportive base for prices. Additionally, the chart reveals a 2nd support at 87.53, identified as an overlap support, offering another protective floor for prices.
On the resistance side, the 1st resistance at 91.55 serves as a pullback resistance, potentially limiting bullish movements in the short term. Further, the 2nd resistance positioned at 93.55 acts as a swing high resistance, presenting a subsequent barrier to price ascents. Notably, there’s also an intermediate support situated at 90.72, marked as an overlap support and coinciding with the 50% Fibonacci Retracement
XAU/USD (GOLD):
The XAU/USD chart currently exhibits bullish momentum, with an anticipated bullish bounce off the 1st support at 1859.11 heading towards the 1st resistance at 1887.74. The 1st support is crucial, serving as a pullback support and aligning with the 78.60% Fibonacci Retracement, providing a strong foundation for the price. Additionally, there’s a 2nd support at 1843.67, acting as another pullback support and coinciding with the 161.80% Fibonacci Extension, reinforcing its role as a supportive base.
On the resistance side, the 1st resistance at 1887.74 is significant, identified as a pullback resistance that might impede immediate upward movements. The 2nd resistance located at 1900.00, also characterized as a pullback resistance, presents an additional hurdle for potential bullish advances. An intermediate support level is also identified at 1877.38, serving as a multi-swing high resistance and aligning with the 23.60% Fibonacci Retracement, adding an extra layer of significance.

The accuracy, completeness and timeliness of the information contained on this site cannot be guaranteed. IC Markets does not warranty, guarantee or make any representations, or assume any liability regarding financial results based on the use of the information in the site.
News, views, opinions, recommendations and other information obtained from sources outside of www.icmarkets.com, used in this site are believed to be reliable, but we cannot guarantee their accuracy or completeness. All such information is subject to change at any time without notice. IC Markets assumes no responsibility for the content of any linked site.
The fact that such links may exist does not indicate approval or endorsement of any material contained on any linked site. IC Markets is not liable for any harm caused by the transmission, through accessing the services or information on this site, of a computer virus, or other computer code or programming device that might be used to access, delete, damage, disable, disrupt or otherwise impede in any manner, the operation of the site or of any user’s software, hardware, data or property.


