
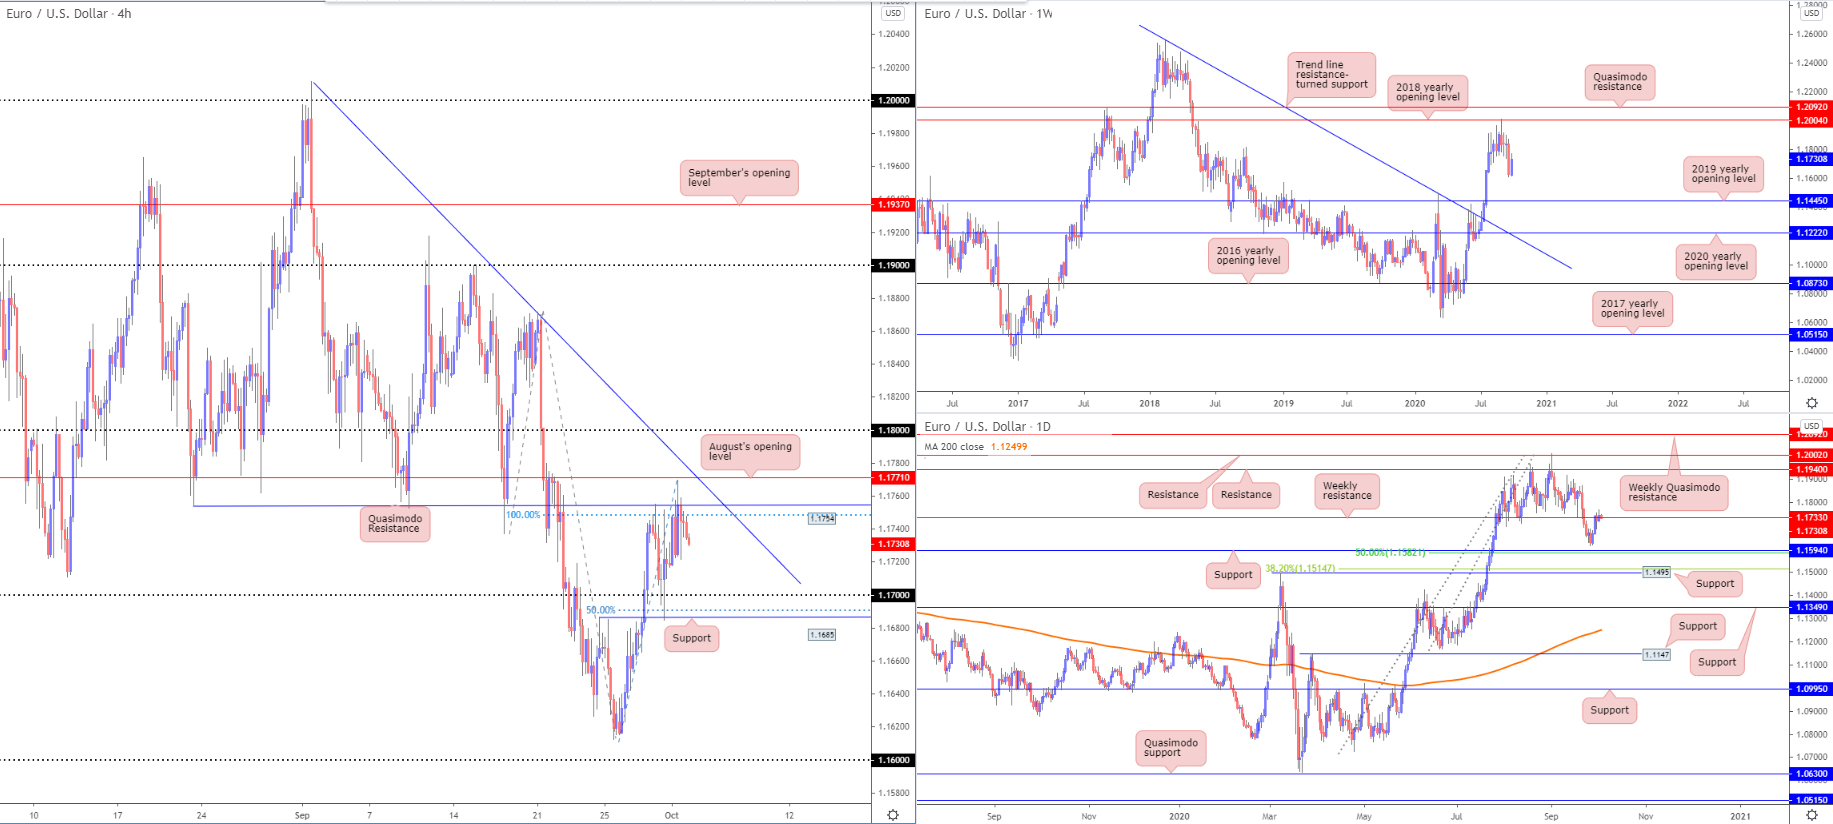
EUR/USD:
Area of consideration:
Short term resistance at the 1.1754 level which is a quasimodo resistance level that also coincides with the H4 100% AB=CD Correction. Recent price action around that area suggests it’s a strong area of supply flowing in. A descending resistance line from the start of September is also indicative of potential bearish momentum with prices forming lower highs since then. With this in mind, H4 gaining much beyond the 1.1754 area is unlikely.
That brings us to the support we’re seeing at 1.1685 which coincides with the recent 50% Fibonacci Retracement. This would be an interesting level for sellers and poses the first major support below 1.1754.
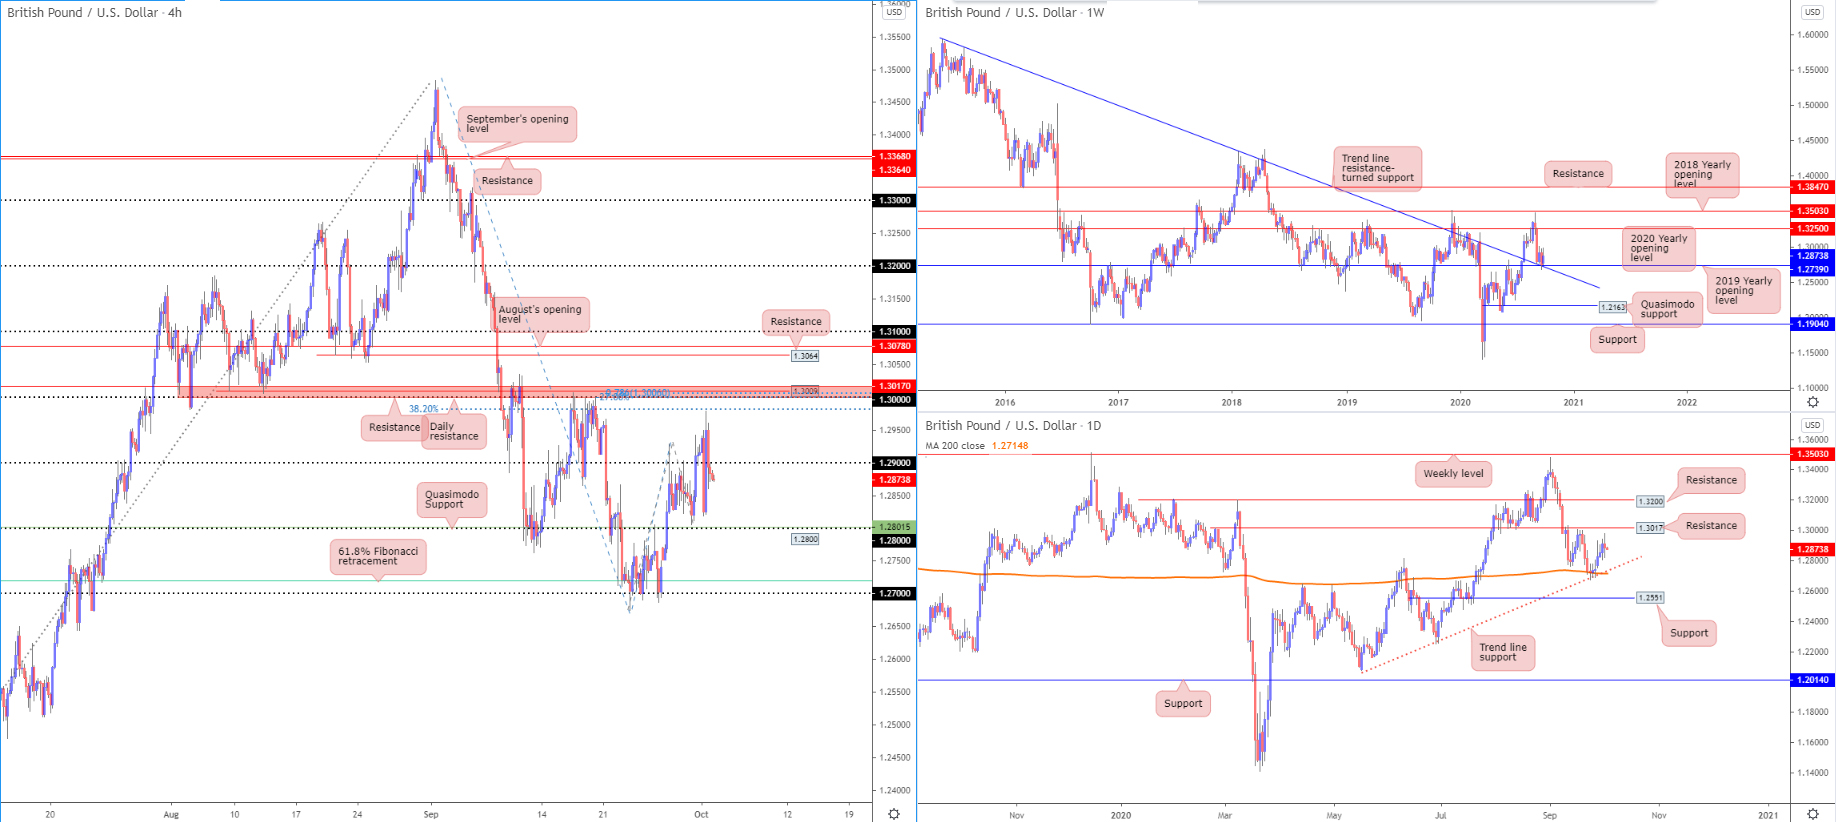
GBP/USD:
Area of consideration:
Price is fast approaching the quasimodo resistance area at 1.3000 having previously seen a reaction off the 38.2% Fibonacci Retracement at 1.2980 yesterday. 1.3000 remains the potential resistance zone for sellers with a recent -27% Fibonacci Retracement along with a 78.6% Fibonacci Extension lining up there nicely to form a FIbonacci confluence area.
First major level of support remains at 1.2800 which has prices respecting it multiple times since June 2020. It’s also worth noting that on the D1 time frame, price has been holding really well above the ascending support line stretching all the way back from May 2020. This could cap the downside of potential sellers looking to play the reversal from the 1.3000 resistance area.
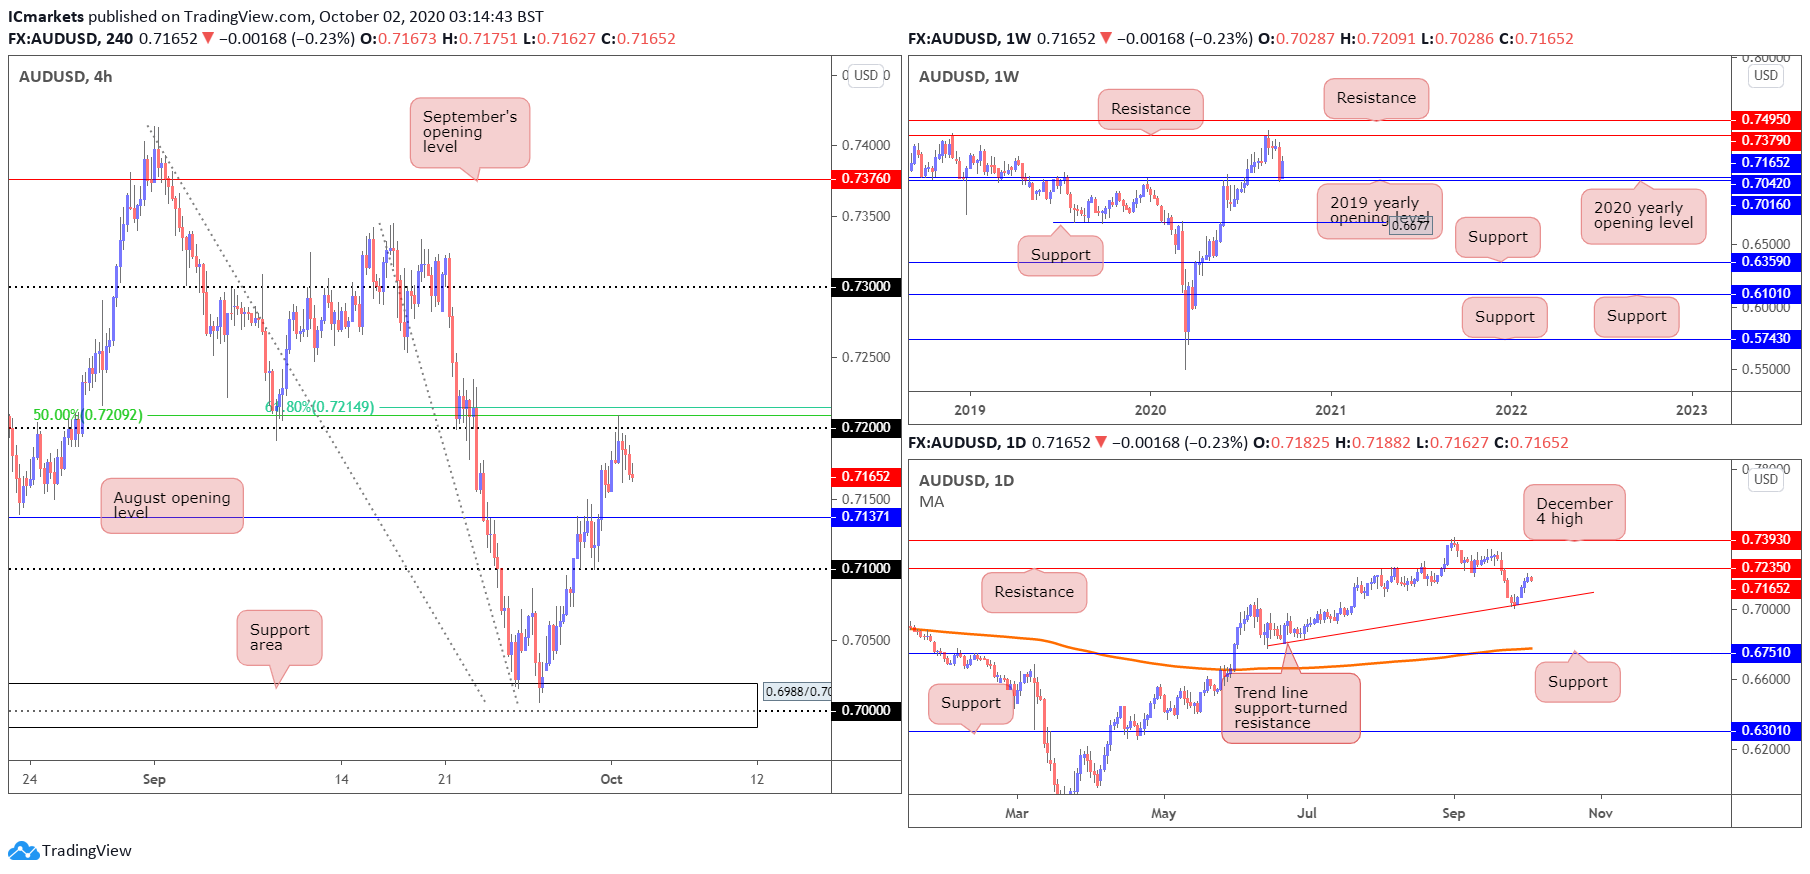
AUD/USD:
Areas of consideration:
Thursday had AUD/USD bulls regain some dominance.With higher time frame supports recently elbowing into the spotlight, the pendulum appears to be swinging in favour of shorters right now. Price has tested and reversed from the key resistance zone from 0.72092 to 0.72149 on the H4 chart where the 50% fibonacci retracement and 61.8% fibonacci retracement are, it might go up to test it again. If it could break above this key resistance zone, more upside could be opened up from there.
In terms of upside targets, if price breaks above the key resistance zone, the nearest (obvious) resistance on the higher timeframes rests at 0.7235, while on the H4 chart resistance is found at the 0.73 handle, where the September’s opening level is.
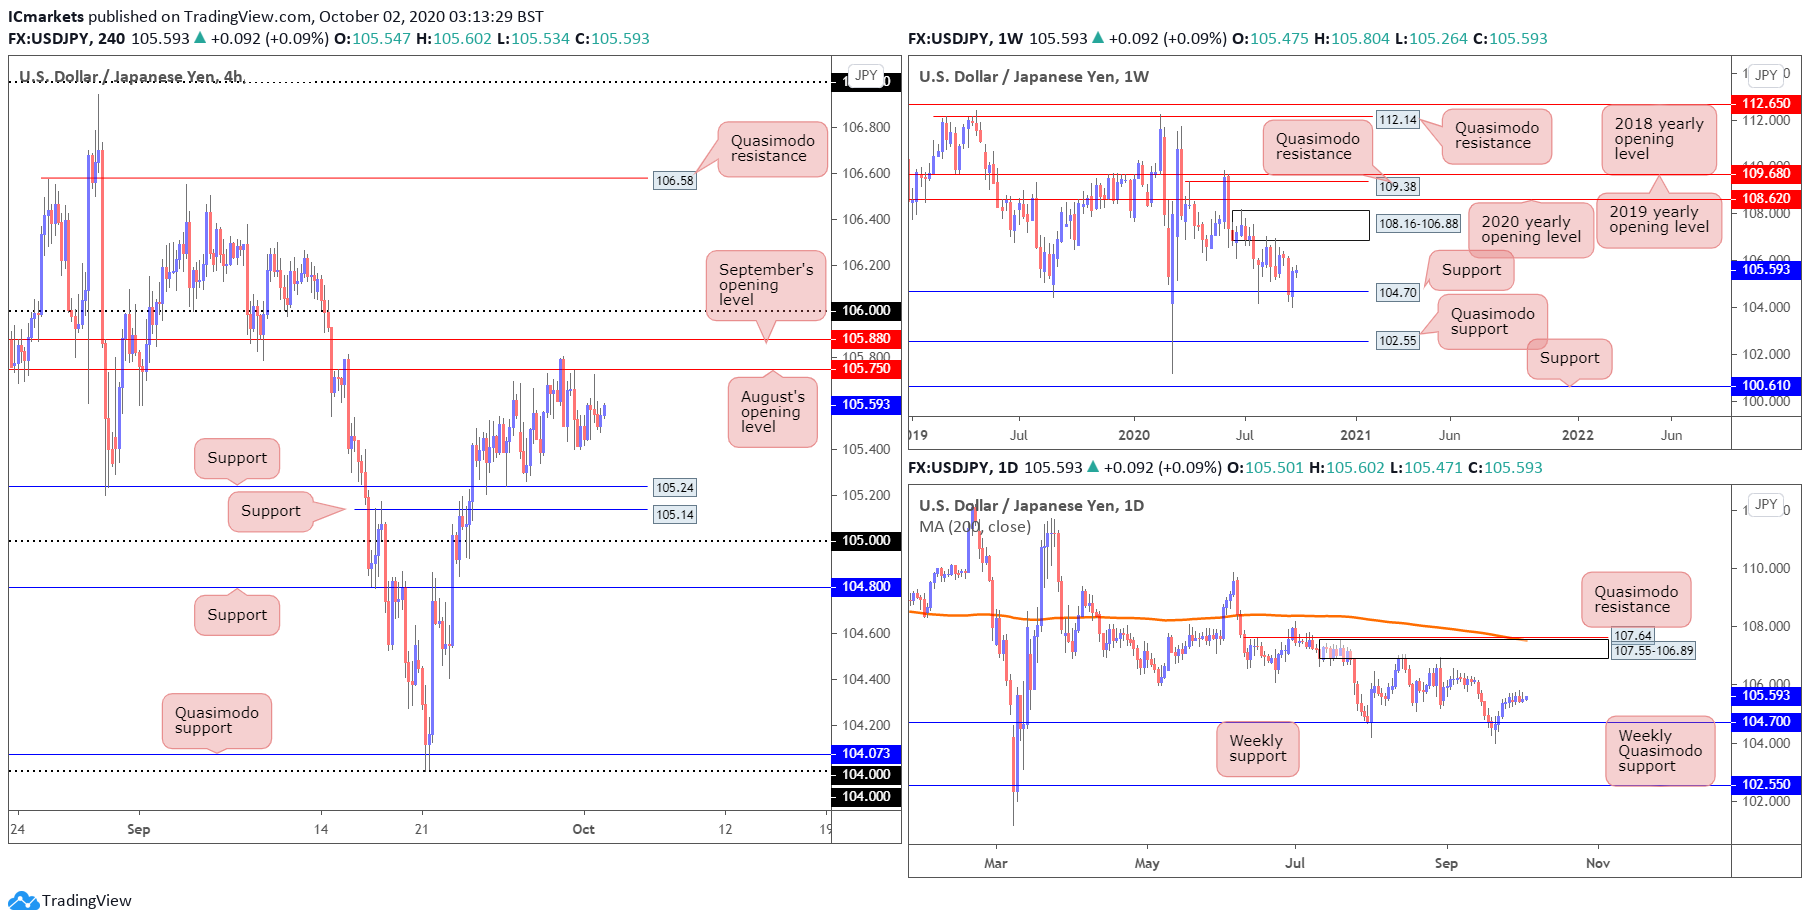
USD/JPY
Areas of consideration:
Weekly support at 104.70 elbowing its way back into the spotlight, together with both the weekly and daily timeframes displaying room to reach 107ish (the underside of weekly/daily supply [106.88/89), underpins the possibility of further buying materialising north of 106 (H4). However, before that on H4 chart, we couldn’t ignore the resistance at 105.75 where the August’s opening level is and 105.88 where the September’s opening level is. If price is able to break above this 105.75 to 105.88 resistance zone, then we could expect the price to go north of 106 (H4) and 106.88 (weekly and daily).
Given the prospect of higher levels, most buyers have likely held long positions off 105.24 (though the majority would have reduced risk to breakeven by now) in favour of a possible 106 break.
USD/CAD:
Areas of consideration:
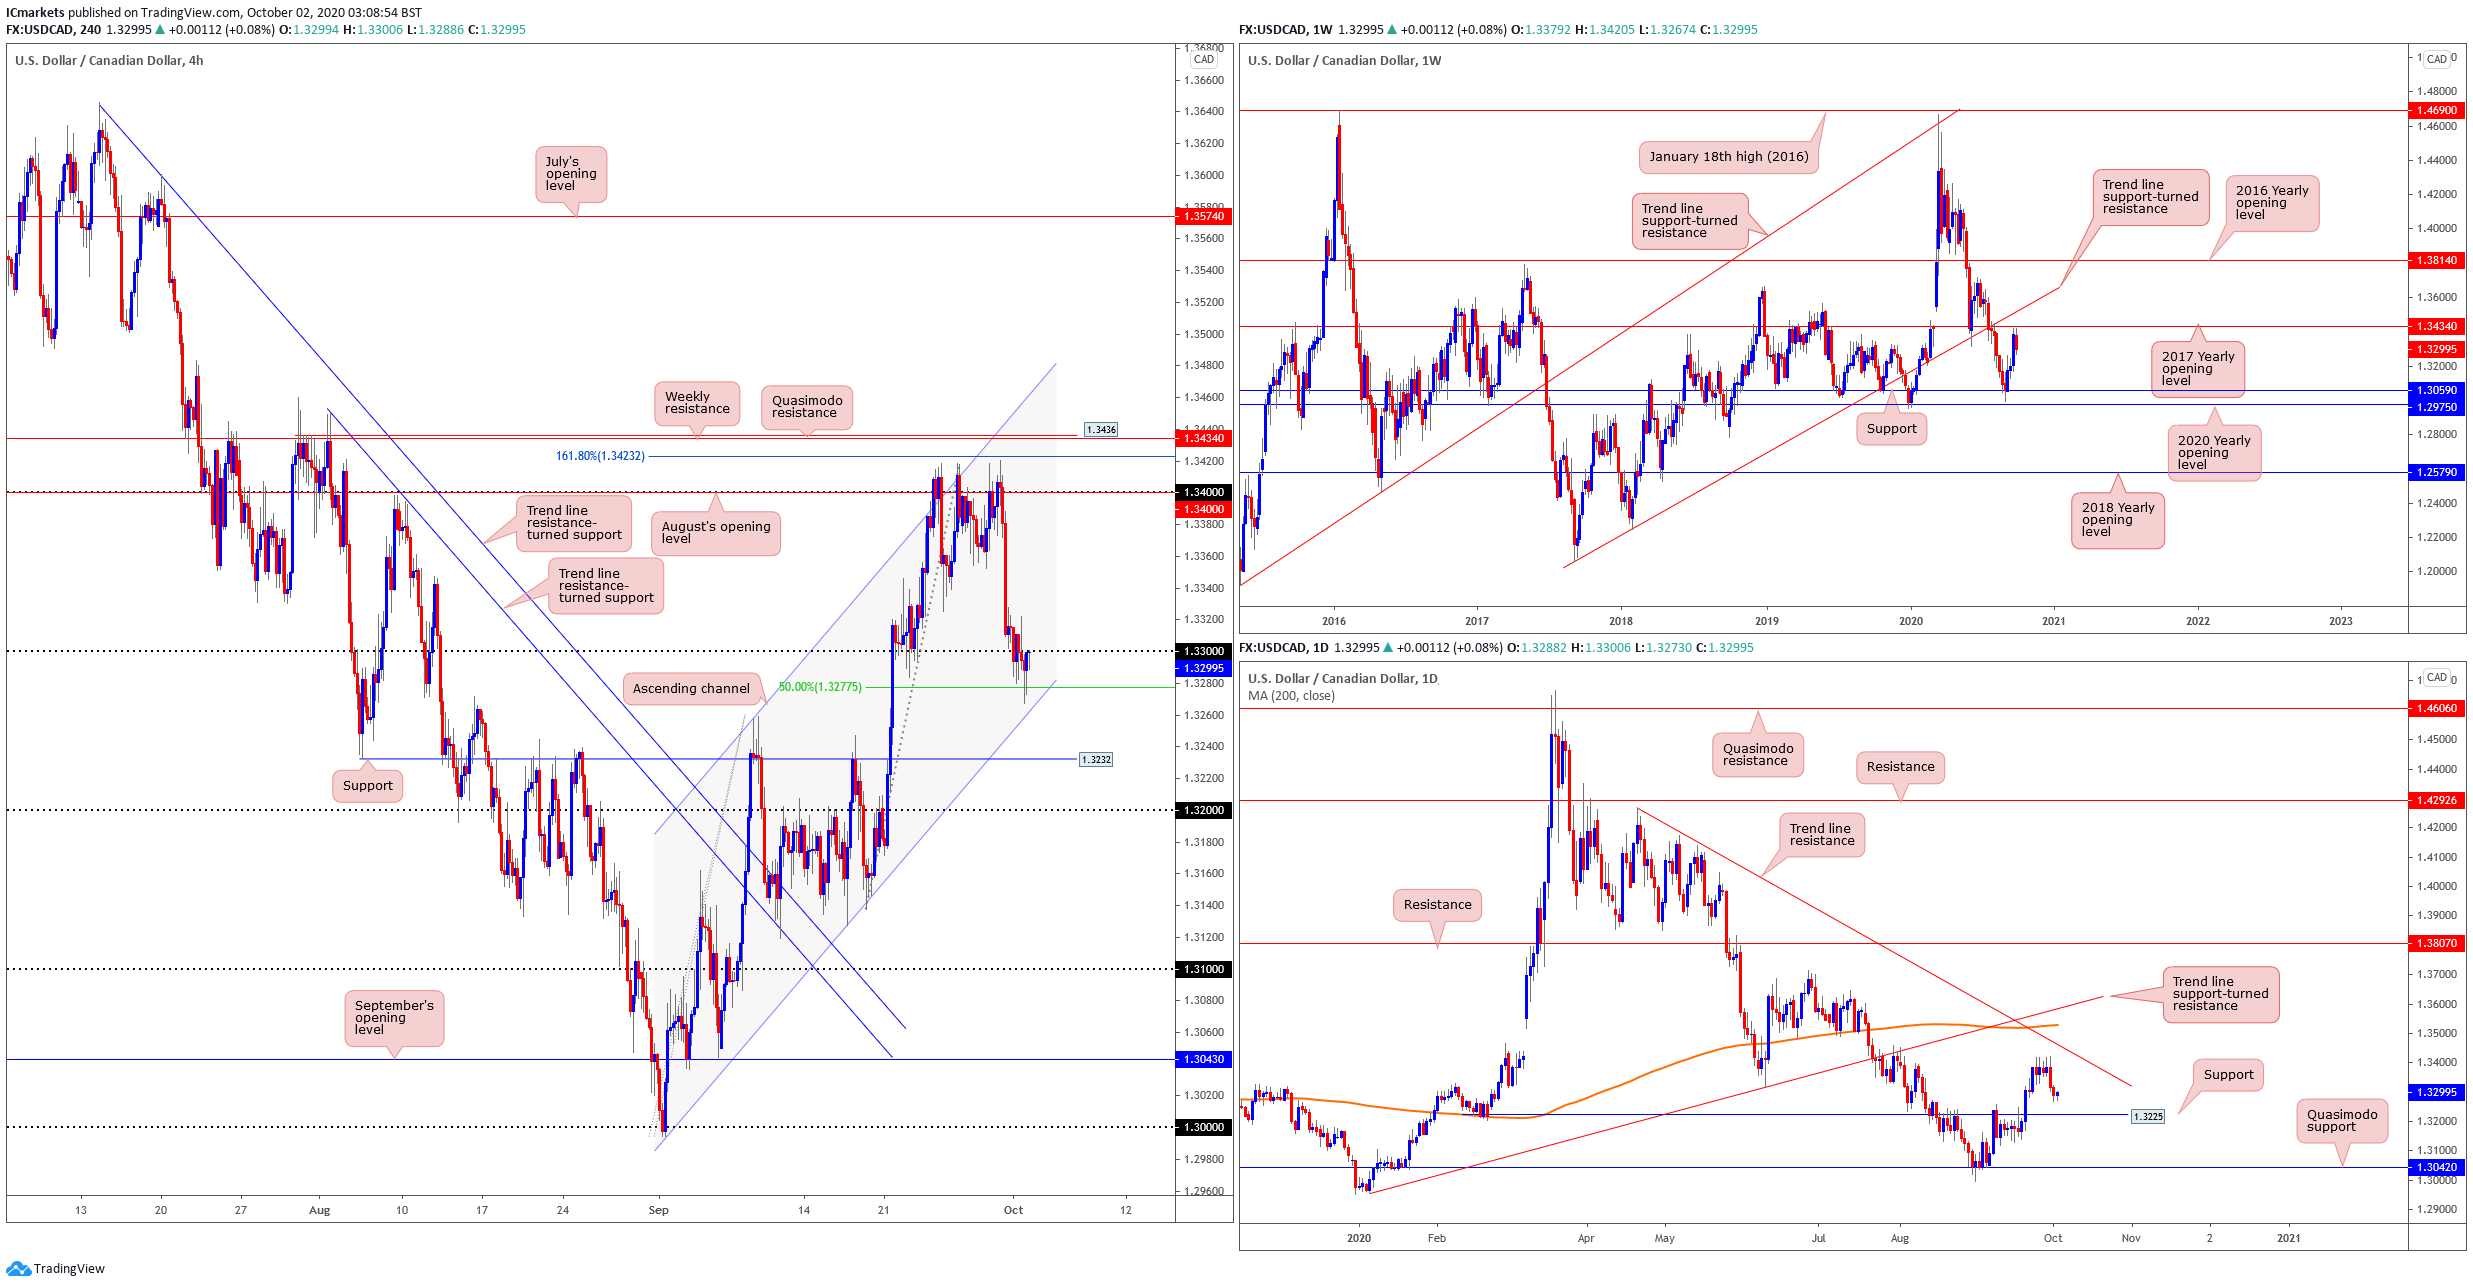
On the weekly, price tested the 2017 yearly opening level at the 1.34340 and rejected it. A pullback towards the support zone between 1.30590 – 1.29750 (2020 yearly opening level) could be likely in the event sellers continue to add to their shorts. On the daily timeframe, we see that the price is still holding below the moving average and also the trendline resistance. It could be possible to also see sellers add to their shorts to push price slightly lower towards the 1.3225 support level.
On the H4, we see price testing ascending channel support level which is also in line with the 50% Fibonacci retracement level at 1.32775. This support level can be a platform for the intra-day buyers to consider. From here, 1.34000 August opening level can be a potential upside target for buyers to buy towards and could also be the level where we see the neighbourhood sellers come in and add to their shorts. Should price break below the ascending channel support, the next level for traders to watch would be the graphical price overlap support level at 1.3232.
USD/CHF:
Areas of consideration:
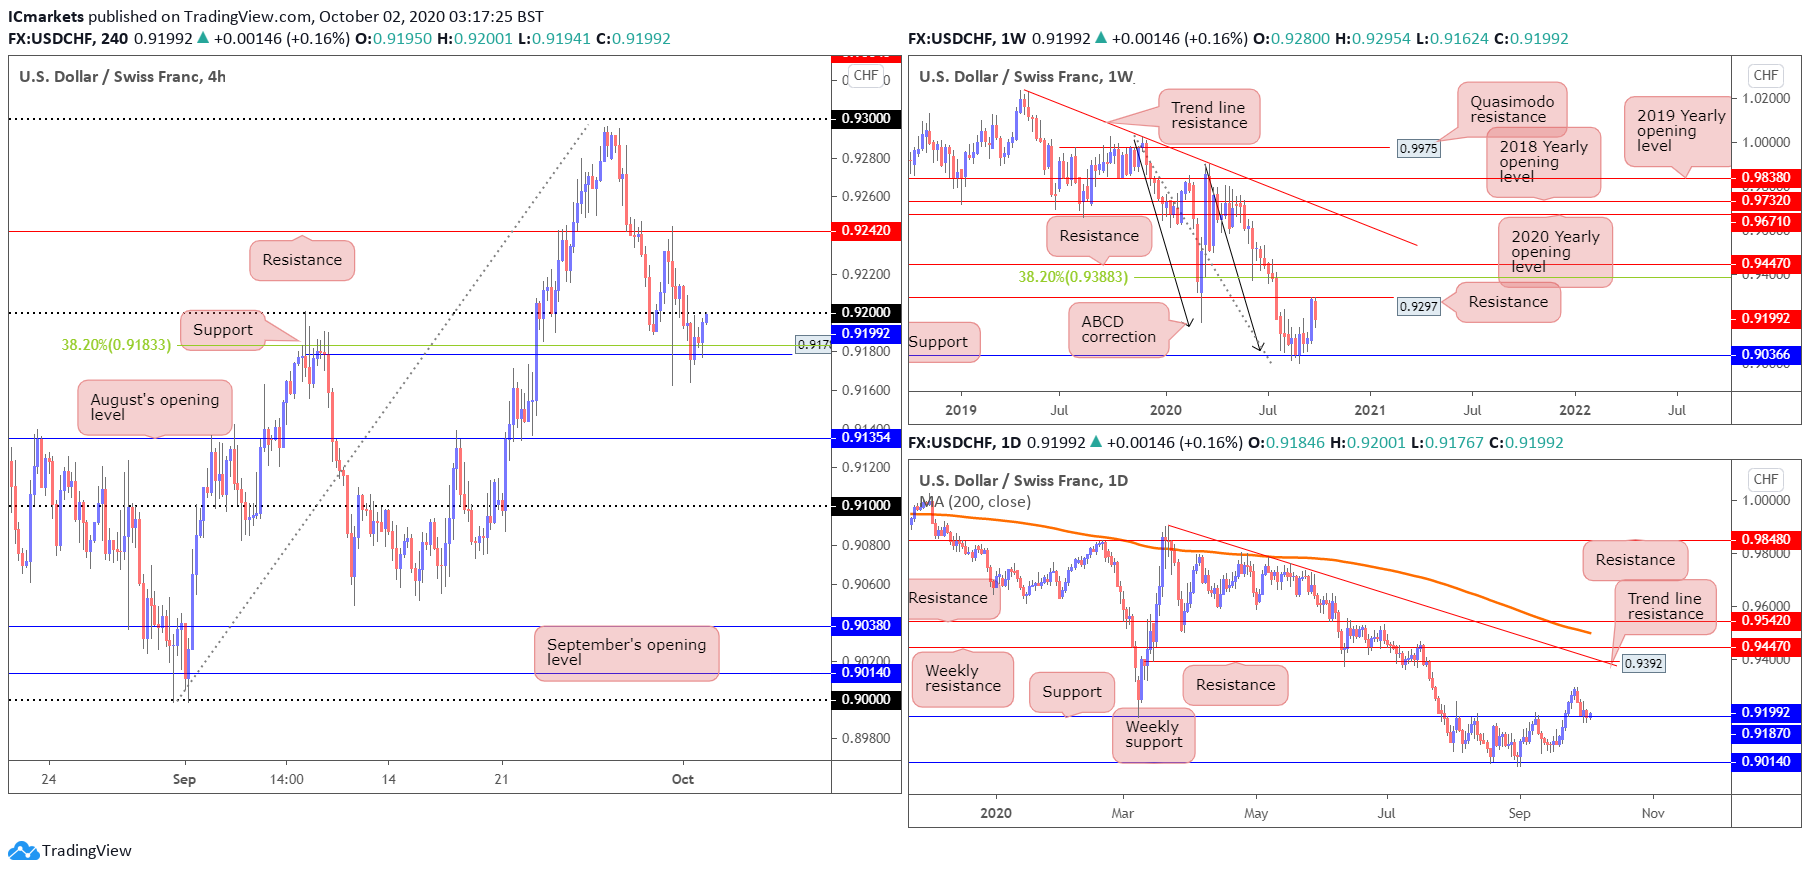
Upside pressure remained unabated Thursday, as USD/CHF challenged weekly resistance at 0.9297 and retested resistance at 0.9242 on the H4 timeframe and bounced at support at 0.9178 on H4. As evident from the H4 chart, price action is seen retesting the 0.92 handle, with 0.9242 set as the next upside target.
Movement on the weekly timeframe reveals buyers recently staged an impressive recovery off support at 0.9014, potentially gleaning additional impetus from ABCD support at 0.9051 (black arrows). If price can break above the 0.92 handle on the H4 chart, the next upside target is 0.9242 on H4. On the weekly chart, the next upside target beyond the weekly resistance level is the daily falling wedge take-profit target at 0.9297, conveniently aligning with the next upside target on the H4: the 0.93 handle.
Dow Jones Industrial Average:
Areas of consideration:
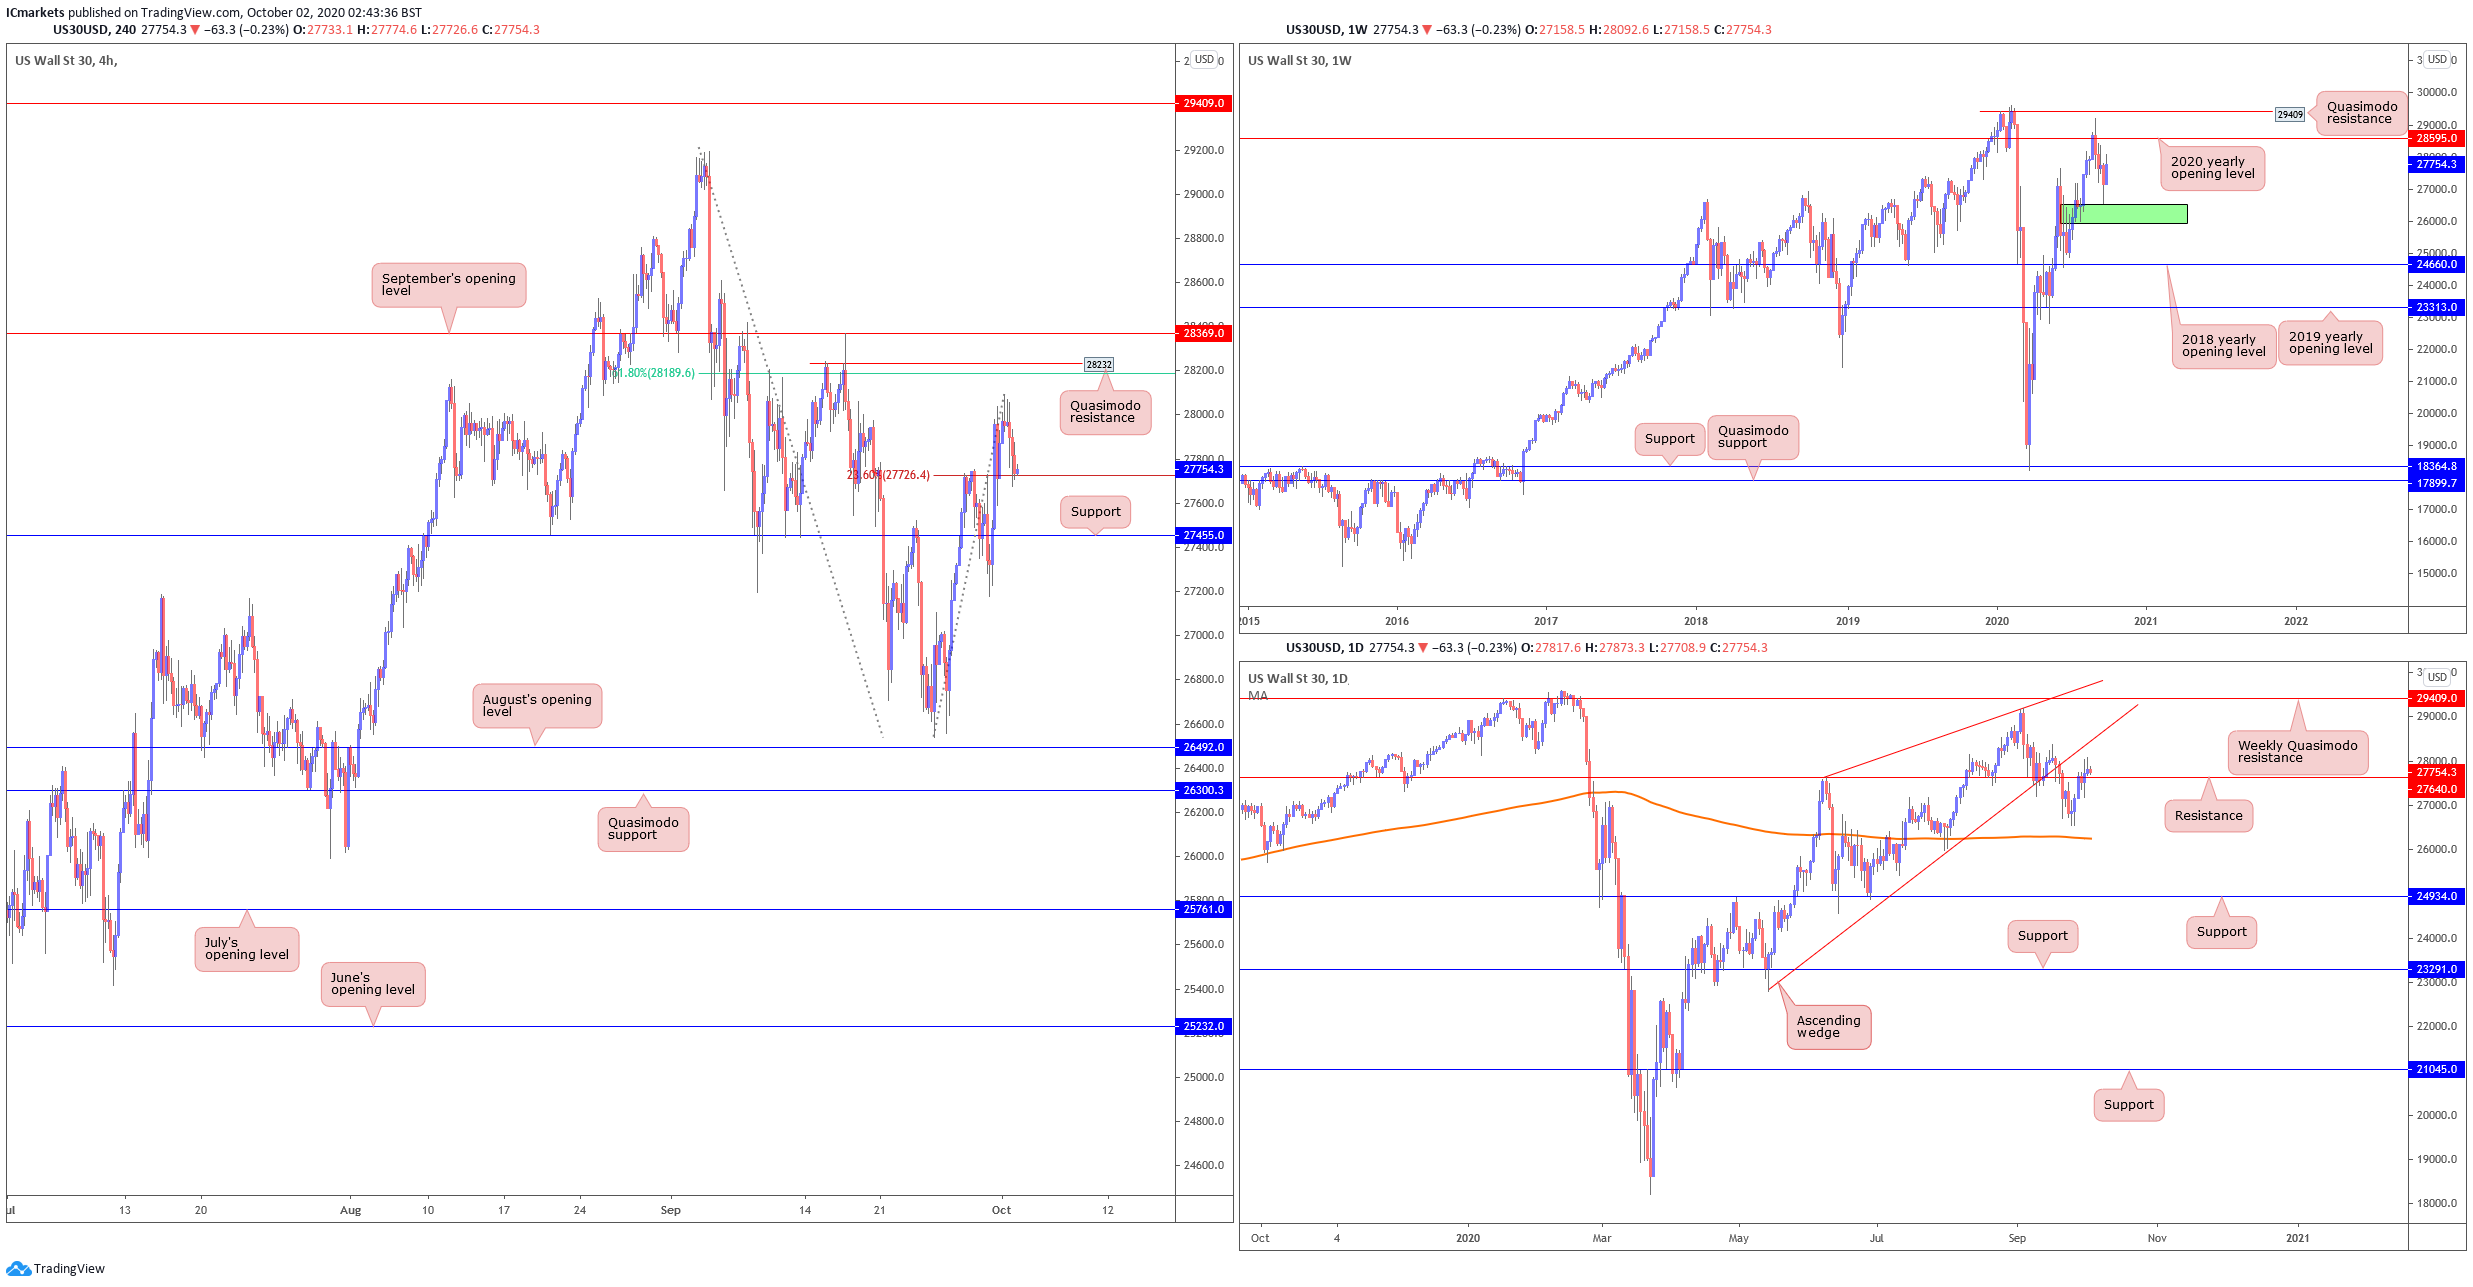
The weekly timeframe shows that price could very well be consolidating sideways as long as it continues to hold between 29409 quasimodo resistance and also 2018 yearly opening level at 24660. For the daily however, we think that with price now above resistance at 27640, price could possibly drift slightly higher and test the ascending wedge resistance line. It remains to be seen if price will actually re-integrate the ascending wedge.
On the H4, price tried to reach for 61.8% Fibonacci retracement level and Quasimodo resistance at around the 28189-28232 price level. However the price failed to do so and pulled back slightly lower. As long as price is above support at 27455, the push up towards our 61.8% Fibonacci retracement level at 28189 is still possible.
Buyers can consider the recent 23.6% Fibonacci retracement level at 27726 as a platform to consider adding to their longs for a limited push higher. However should price fail to hold a bid above this 27726 support level, it is possible to see sellers enter the market and see the price pendulum swing lower towards the next support at 27455.
XAU/USD (GOLD):
Areas of consideration:
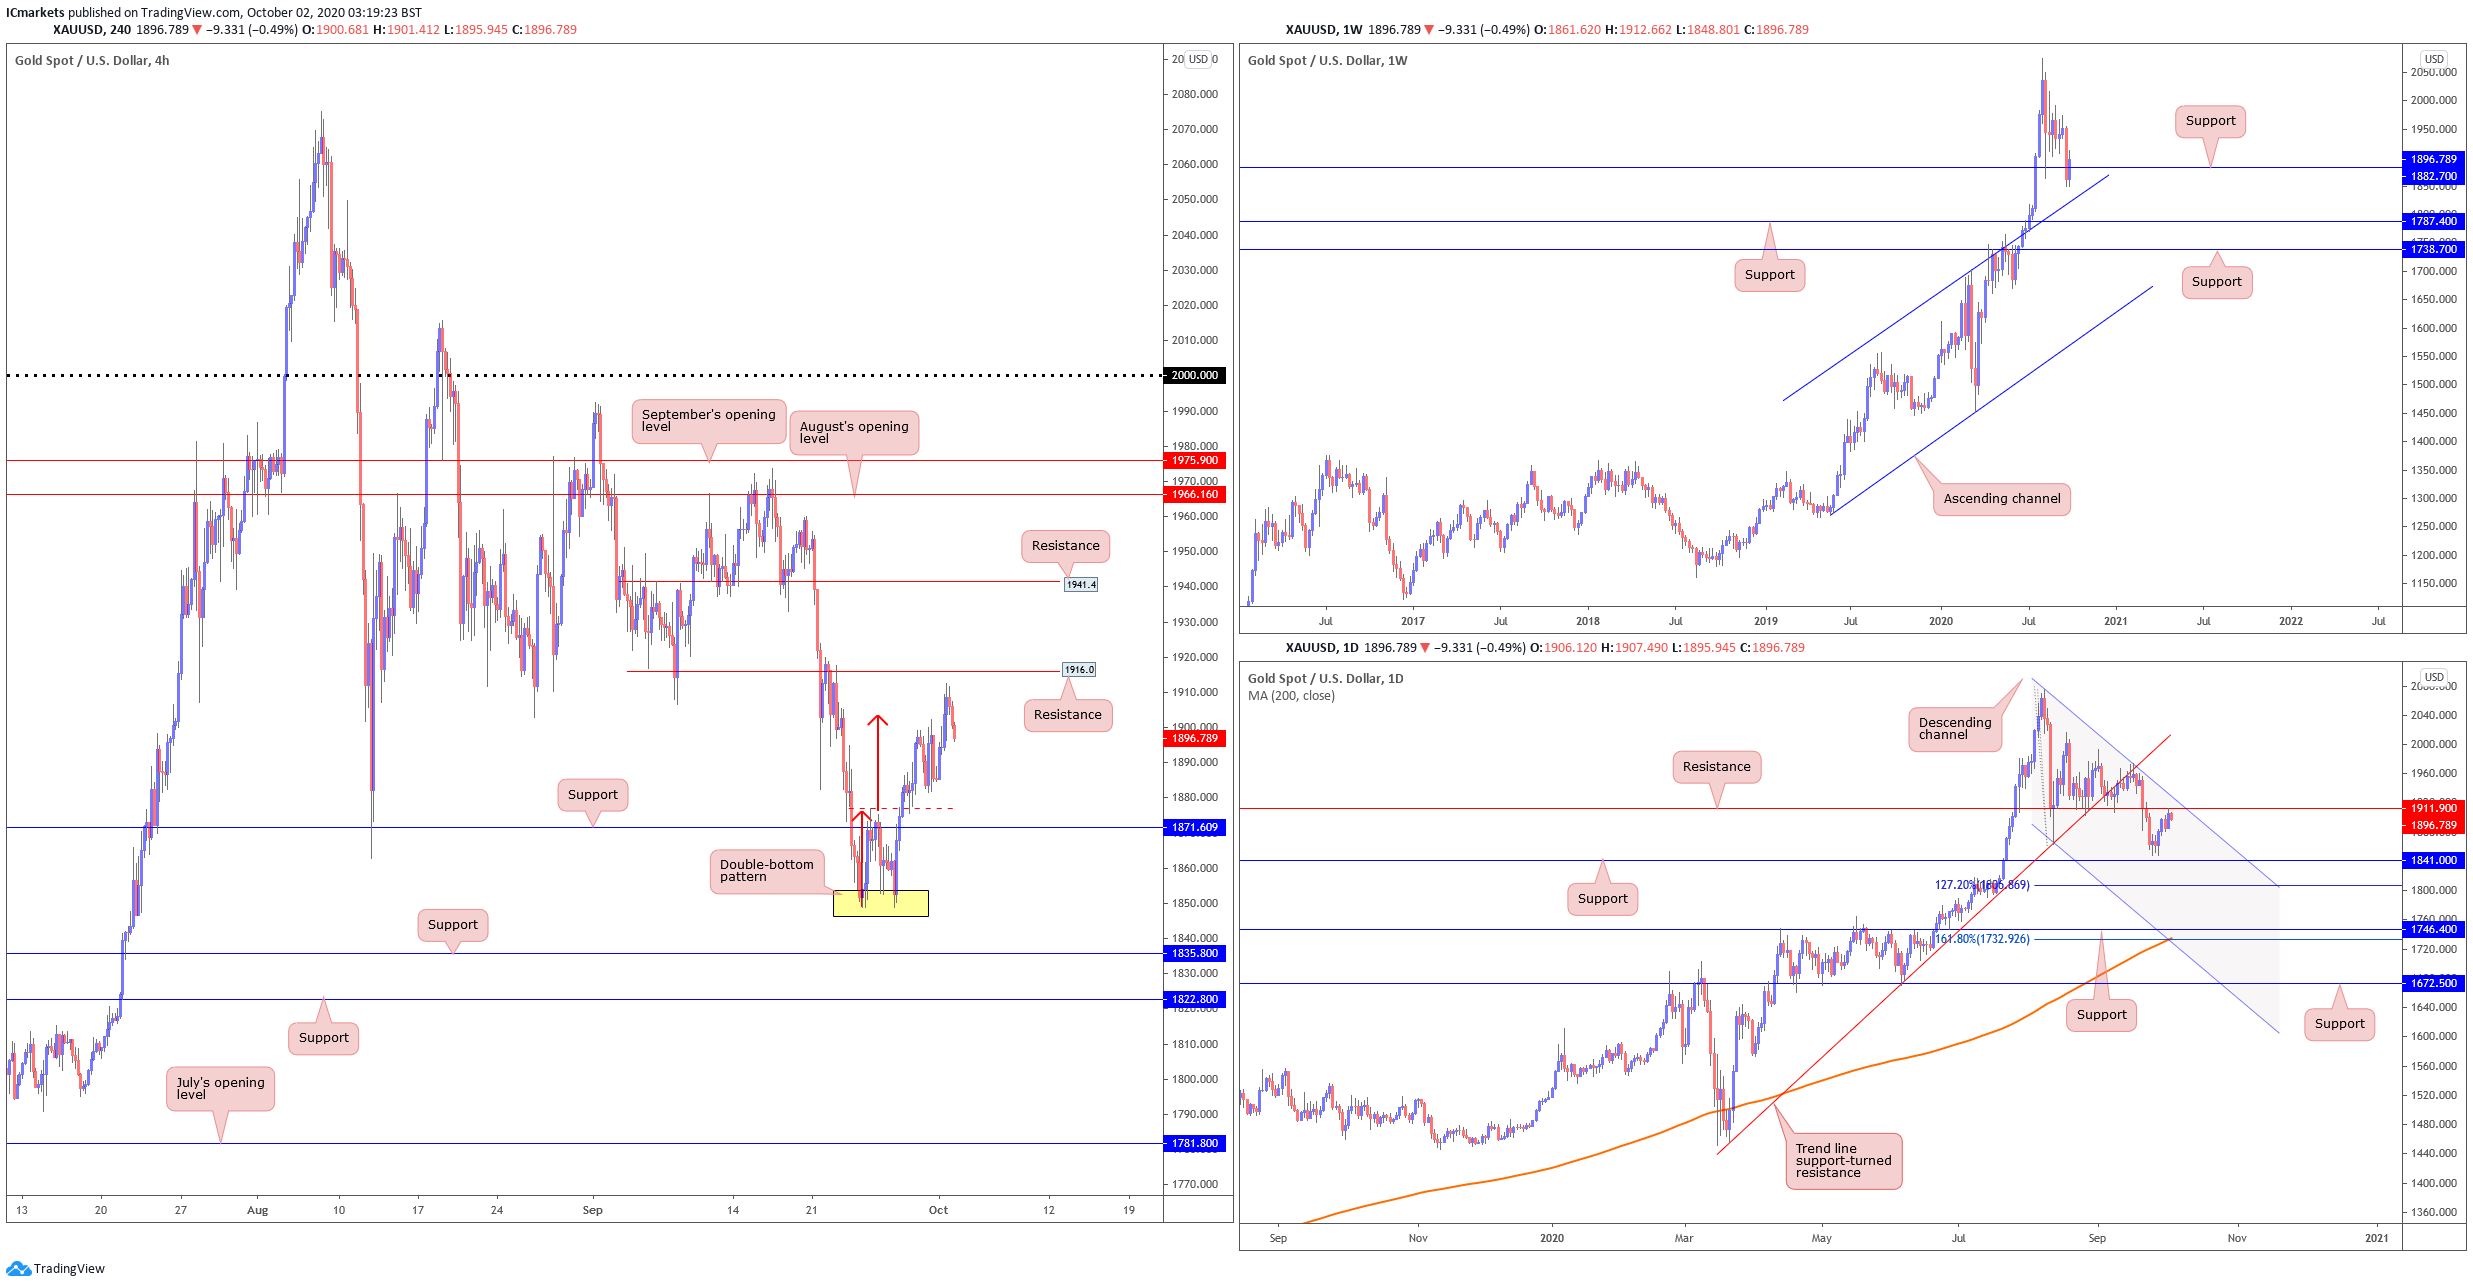
On the weekly timeframe, we have the gold price currently testing support at the 1882.7 price level. This can be seen as a healthy pullback as gold has been pushing higher since May 2019 and even broke out of its ascending channel to the upside. As long as price is holding above this ascending channel resistance, we can still expect the long term bullish momentum to still be in play. The pullback which we see on the weekly is actually price holding within a descending channel on the daily. With price coming close to testing 1911.90 resistance which is also in line with descending channel resistance, a medium-probability bearish scenario for price to drop towards the closest support at 1841.00 is quite possible.
On the 4H timeframe, we see that gold has broken out and completed its double-bottom pattern formation and even reached its breakout target potential. Despite the overnight drop, it is possible to see buyers add to their longs and buy on the way up for price to push towards 1916 resistance. This resistance then can be a level for sellers to consider as well. Should price fail to push higher, it is also possible to see the price pendulum swing lower and back towards the double-bottom neckline support level or the 1871.609 support level.
The accuracy, completeness and timeliness of the information contained on this site cannot be guaranteed. IC Markets does not warranty, guarantee or make any representations, or assume any liability regarding financial results based on the use of the information in the site.
News, views, opinions, recommendations and other information obtained from sources outside of www.icmarkets.com.au, used in this site are believed to be reliable, but we cannot guarantee their accuracy or completeness. All such information is subject to change at any time without notice. IC Markets assumes no responsibility for the content of any linked site.
The fact that such links may exist does not indicate approval or endorsement of any material contained on any linked site. IC Markets is not liable for any harm caused by the transmission, through accessing the services or information on this site, of a computer virus, or other computer code or programming device that might be used to access, delete, damage, disable, disrupt or otherwise impede in any manner, the operation of the site or of any user’s software, hardware, data or property.


