
Key risk events today:
UK Retail Sales m/m; French Flash Services PMI and Flash Manufacturing PMI; German Flash Manufacturing PMI and Flash Services PMI; EUR Flash Manufacturing PMI and Flash Services PMI; UK Flash Manufacturing PMI and Flash Services PMI; US Flash Manufacturing PMI and Flash Services PMI.
(Previous analysis as well as outside sources – italics).
EUR/USD:
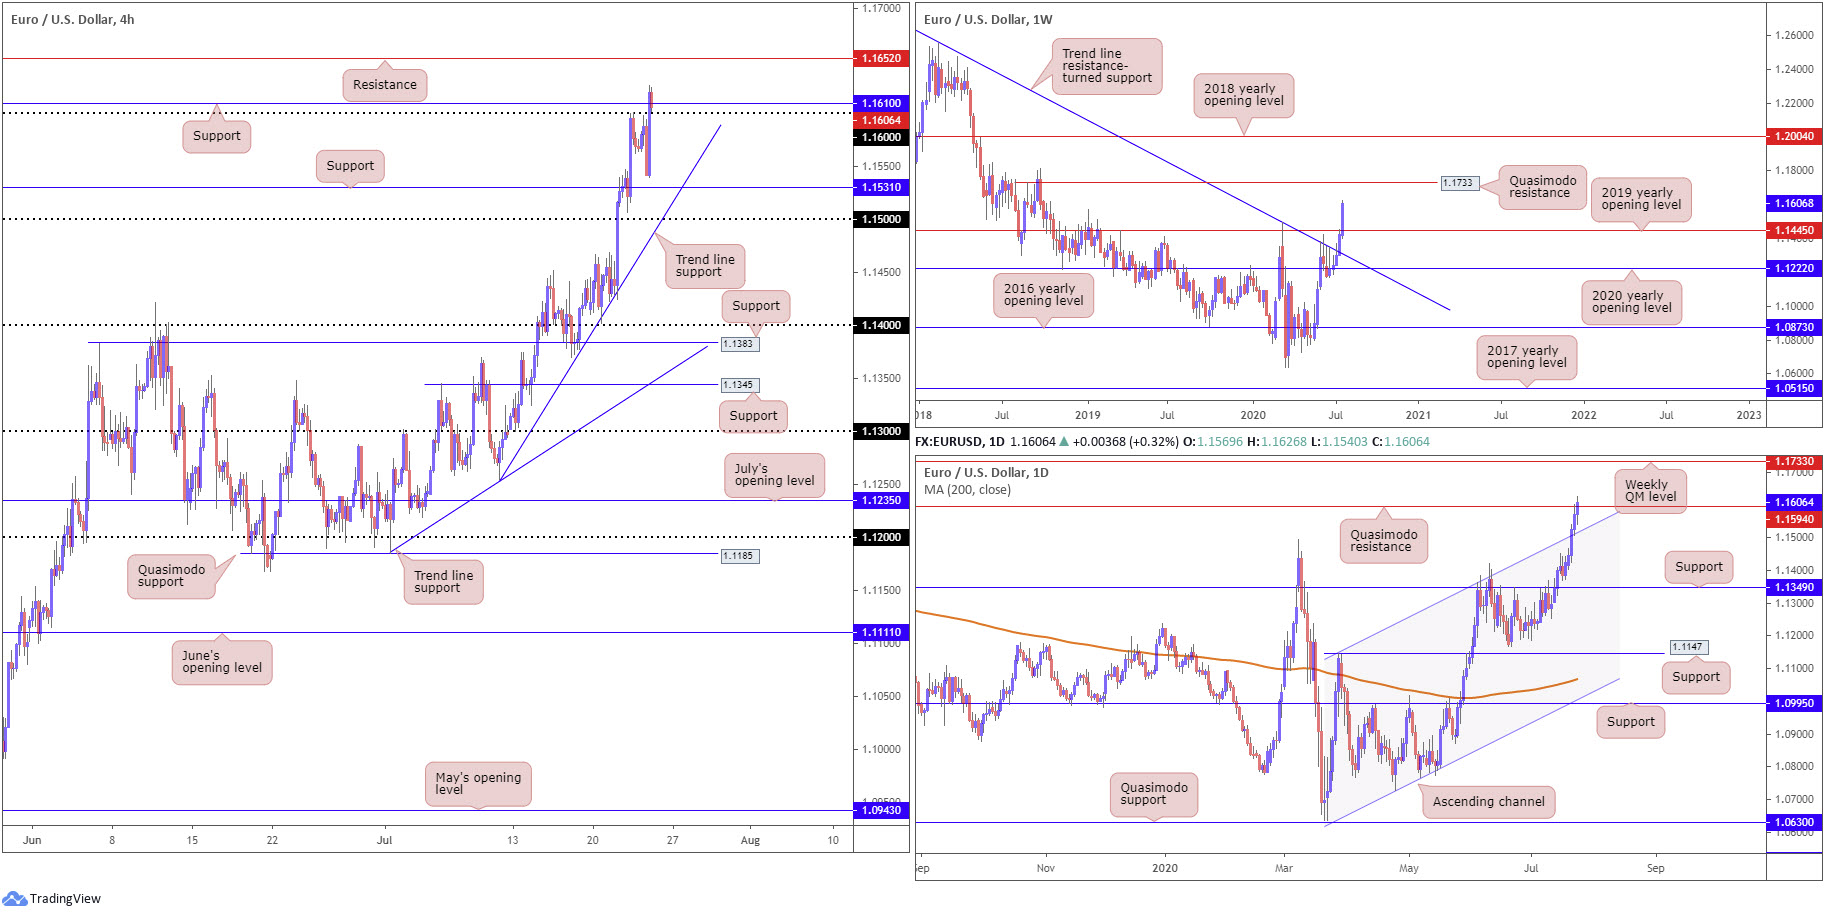
Despite an early attempt to recapture 95.00, the US dollar index continued to soften Thursday, deteriorating to lows at 94.59 and recording a fifth consecutive daily loss. Meanwhile, EUR/USD, albeit after a pop to lows ahead of H4 support at 1.1531, muscularly engulfed 1.16 and Quasimodo resistance at 1.1610. With buy-stops filled north of the round number, traders’ crosshairs are likely fixed on H4 resistance at 1.1652 as the next upside target.
Higher on the curve, weekly price is making considerable headway north of resistance at 1.1445, the 2019 yearly opening level. In the event buyers remain in the driver’s seat, Quasimodo resistance at 1.1733 lines up as the next potential upside target.
Price movement on the daily timeframe reveals the unit soaked up offers at Quasimodo resistance from 1.1594 yesterday, and pencilled in a fifth consecutive gain. Beyond here, chart studies display limited resistance until crossing swords with the weekly Quasimodo formation mentioned above at 1.1733.
Areas of consideration:
For those who read Thursday’s technical briefing you may recall the following (italics):
Should 1.1531 make an appearance, dip-buyers are likely to make a show. Conservative buyers may factor in the possibility of a fakeout through 1.1531 into 1.15 before taking action.
Alternatively, a H4 close above Quasimodo resistance at 1.1610 could stir breakout buyers, in hope of reaching 1.17 (H4) and 1.1733 on the weekly timeframe.
The recent H4 close above 1.16 and 1.1610, as well as both weekly and daily timeframes shifting focus to the possibility of further upside towards 1.1733, could be enough to seduce additional buyers into the market. A retest at 1.16/1.1610 may also tempt conservative buyers.
H4 resistance nearby at 1.1652 rests as an initial upside target, with a break uncovering 1.17 and then weekly Quasimodo resistance at 1.1733.
GBP/USD:
GBP/USD remains an interesting market.
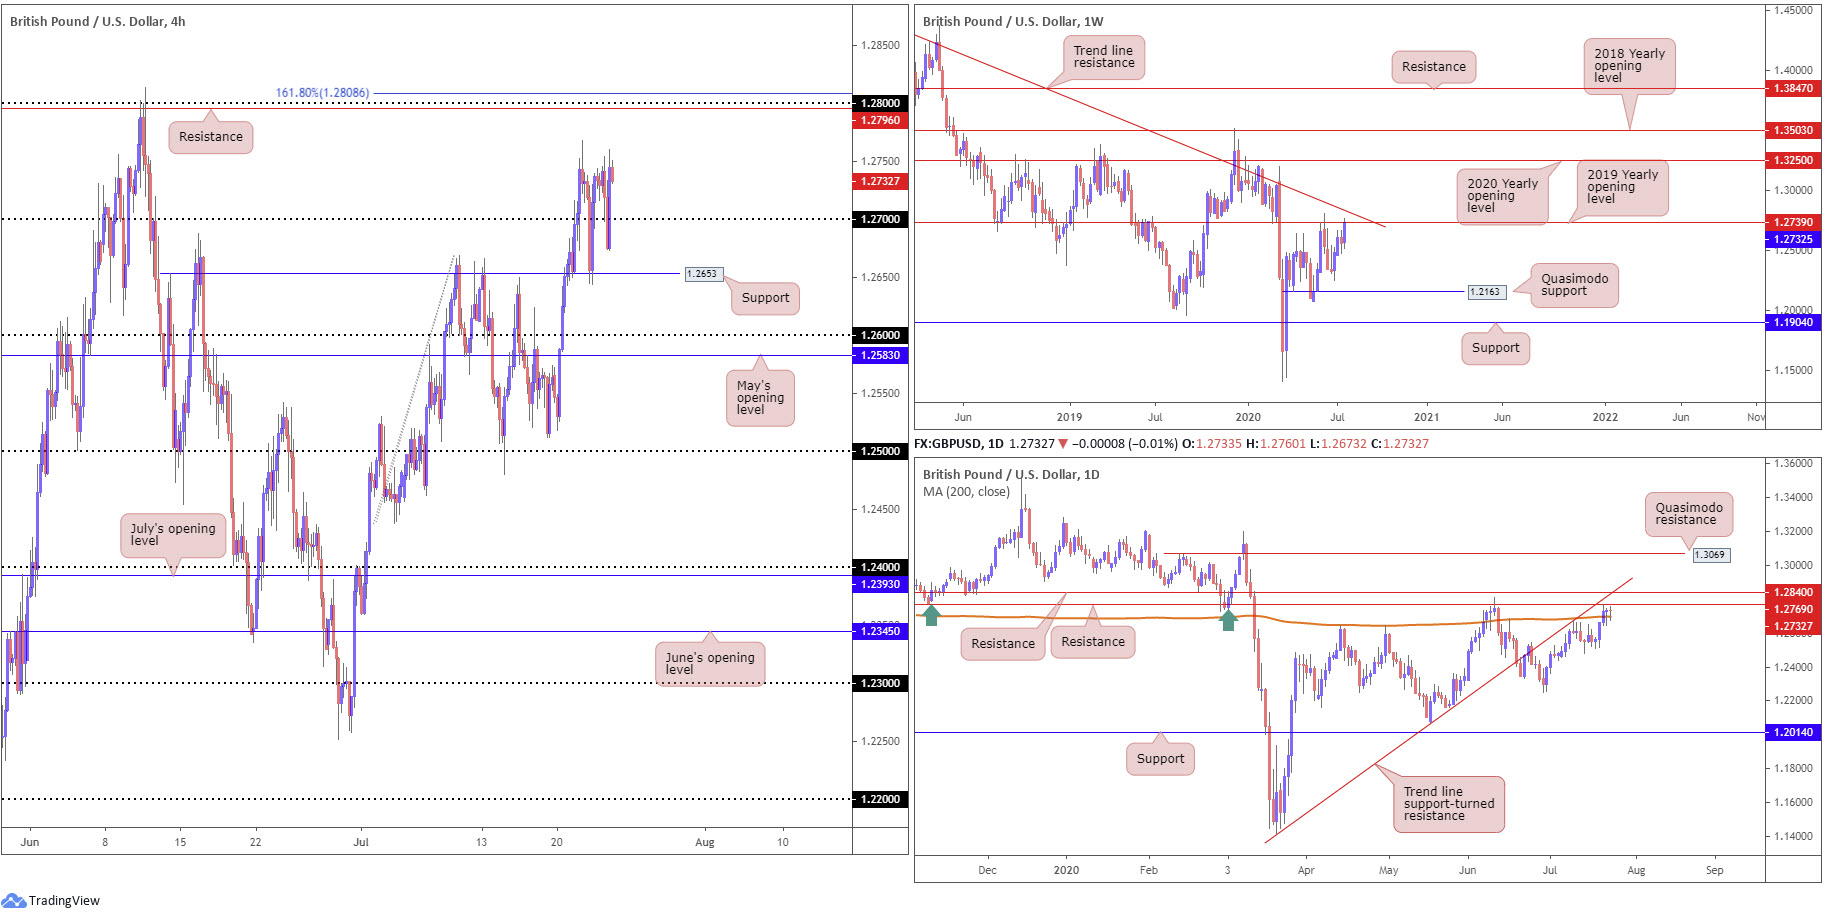
Early US hours brought with it a fakeout sub 1.27 to lows at 1.2673, consequently missing neighbouring H4 support at 1.2653. To the upside, resistance is visible at 1.2796, closely shaded by the 1.28 handle and 161.8% Fibonacci extension point at 1.2808.
Meanwhile, the story on the weekly timeframe has price action clinging to the underside of the 2019 yearly opening level at 1.2739, with a break exposing nearby long-term trend line resistance, taken from the high 1.5930.
Lower on the curve, technical direction shows daily price remains above the 200-day SMA (orange – 1.2697) and is within touching distance of resistance coming in at 1.2769. Readers may also want to acknowledge additional resistance resides close by at 1.2840, coupled with trend line support-turned resistance, taken from the low 1.1409.
Areas of consideration:
Outlook mostly unchanged due to sterling concluding flat for a second consecutive session.
Having weekly price embrace the underside of the 2019 yearly opening level at 1.2739, and daily flow scratching resistance at 1.2769, buyers north of 1.27 are struggling to gain a decisive foothold. Despite the immediate trend pointing northbound and 200-day SMA holding as support, the two aforementioned higher timeframe resistances may be enough to discourage buying.
Should we clear daily resistance at 1.2769, buyers face 1.28 resistance and associated H4 confluence, leaving little room for manoeuvre.
In view of higher timeframe resistance, a H4 close beneath 1.2653 support could be a bearish scenario to keep an eye out for, with breakout sellers ultimately taking aim at 1.26 and May’s opening level at 1.2583.
AUD/USD:
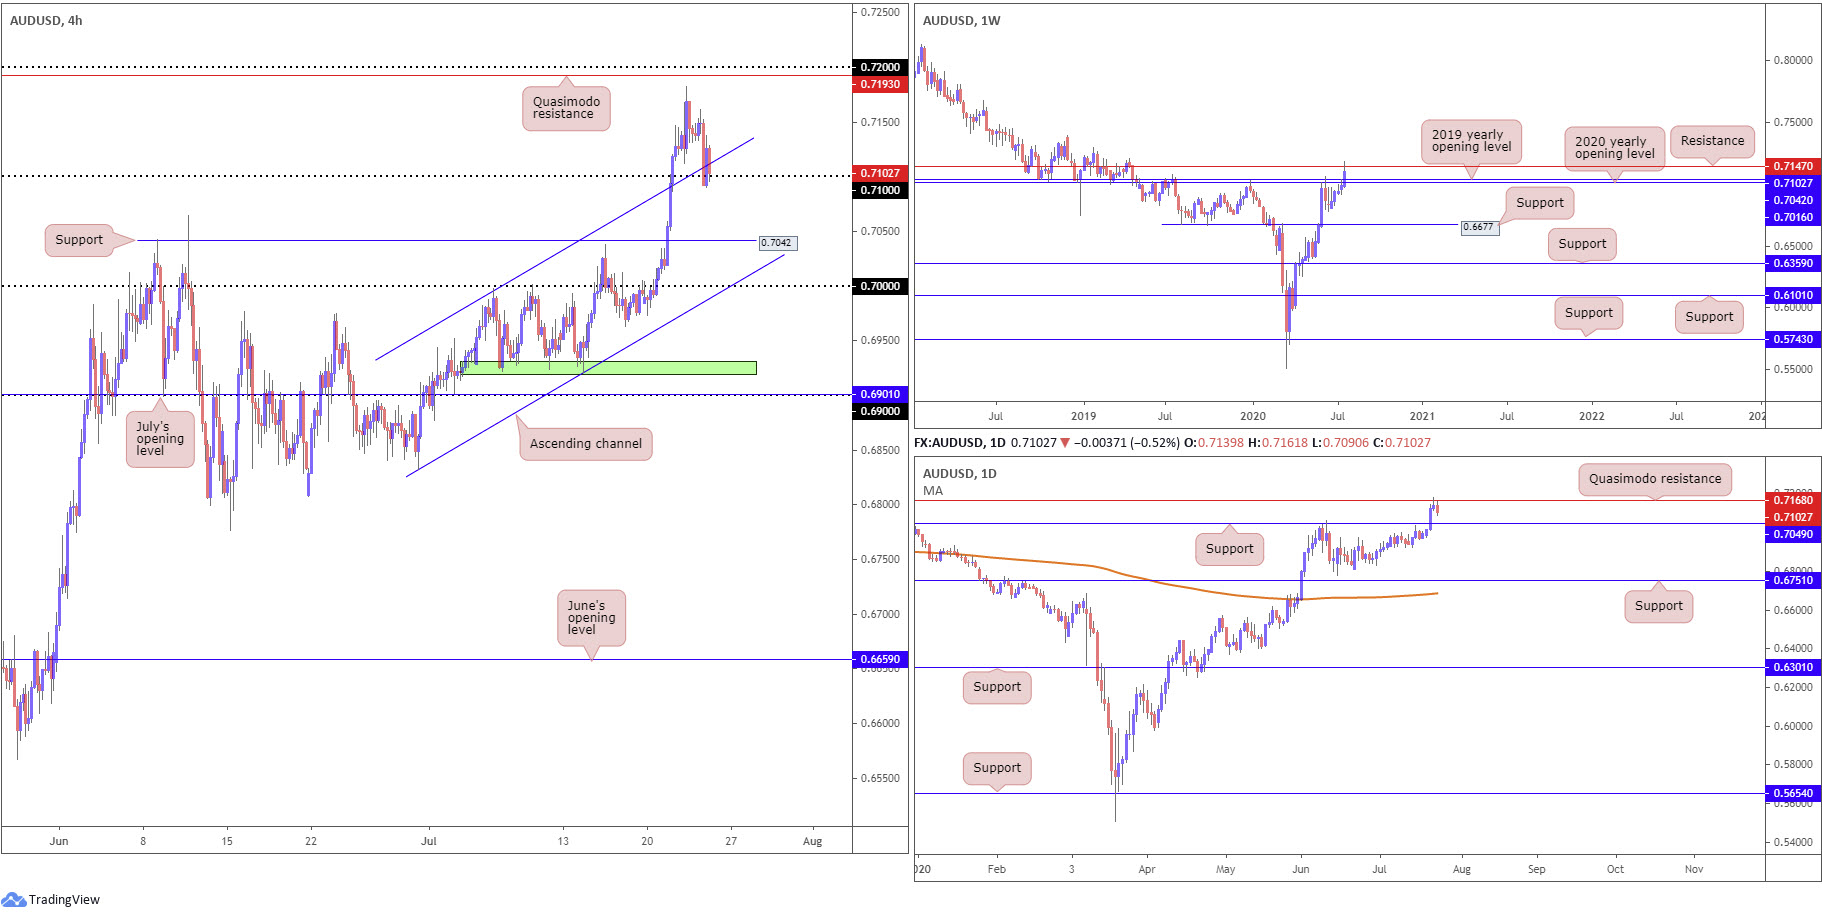
Snapping a four-day bullish phase, AUD/USD extended Wednesday’s slide from fresh multi-year peaks at 0.7183 on Thursday, settling around the 0.71 handle and converging H4 channel resistance-turned support, taken from the high 0.6997. The US dollar index also continued to find soft ground, holding under 95.00. Major US equity benchmarks also closed decisively lower across the board.
With 0.71/channel support in the frame on the H4 chart, buyers are attempting to make a stand. However, a breakdown through the round number will have traders eye support coming in from 0.7042, a prior Quasimodo resistance level.
Weekly price, after chiselling through the 2020 and 2019 yearly opening levels at 0.7016 and 0.7042, respectively, recently pulled in resistance at 0.7147. Similarly, we also see daily price fading Quasimodo resistance at 0.7168, potentially weighed by Wednesday’s shooting star candlestick pattern.
Areas of consideration:
For those who read Thursday’s technical briefing you will recall the following (italics):
Weekly resistance at 0.7147 and daily Quasimodo resistance at 0.7168, regardless of the immediate trend facing northbound, is likely to weigh on upside attempts.
As such, a H4 retest at 0.71/channel support is likely on the cards today. Whether buyers make a stand here is difficult to judge. Traders will likely be watching price action closely for signs of bullish intent at this point. A H4 close beneath 0.71, though, as the higher timeframes suggest, could encourage intraday selling to daily support at 0.7049 and H4 support from 0.7042.
The section highlighted in bold remains valid as we transition into Friday’s session.
USD/JPY:
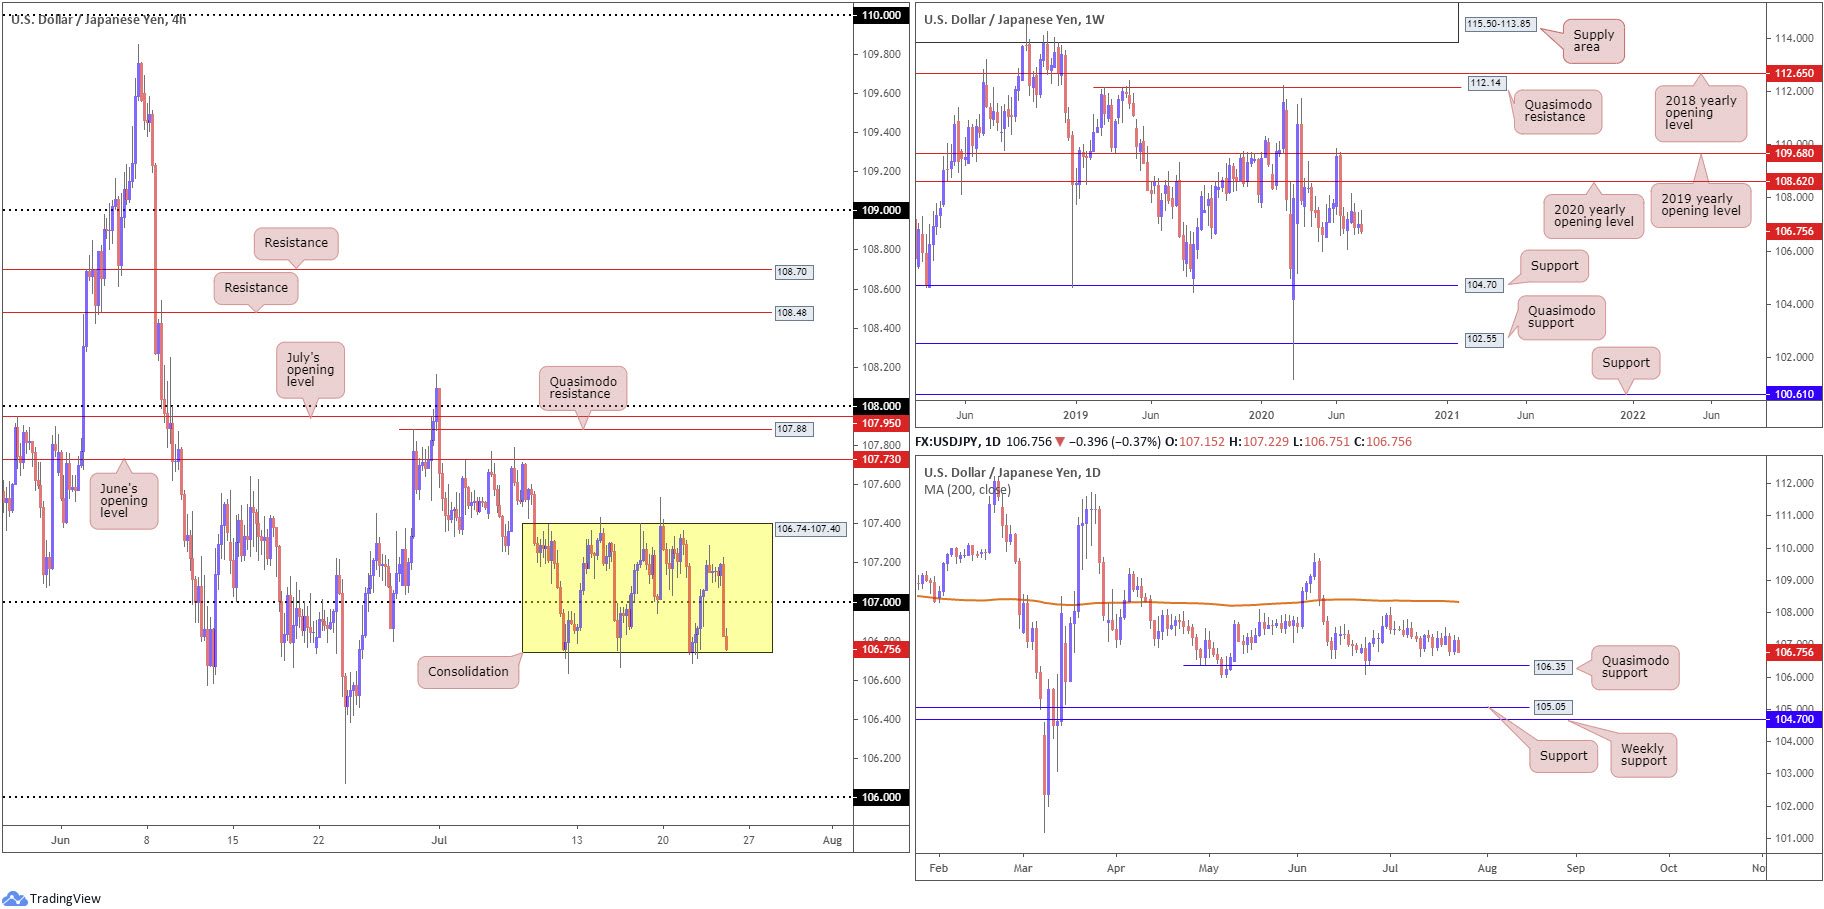
USD/JPY collapsed into US hours on Thursday as demand for the safe-haven Japanese yen intensified amid a deterioration in US equities, due to mounting concerns surrounding coronavirus infections potentially slowing the economic recovery.
Since early July, the H4 candles have been entrenched within a consolidation (yellow) between 106.74-107.40, a reasonably wide range that houses the 107 handle. Outside of the aforementioned range, the spotlight is focused on June’s opening level at 107.73 and the 106 handle. As evident from the H4 chart this morning, we are forcefully drawing towards the lower boundary of the aforementioned range.
Further out on the weekly timeframe, price is seen consolidating beneath the 2020 yearly opening level at 108.62. Support, on the other hand, can be derived from the 105.98 6th May low, with a breach uncovering long-term support plotted at 104.70. Candle action on the daily timeframe remains focused on Quasimodo support from 106.35 and the 200-day SMA (orange – 108.33) as resistance, assuming we can pass the 108.16 July 1st high.
Areas of consideration:
The prime focus today is on the lower shelf of the current H4 range at 106.74. A recovery could bring light back to 107 as a resistance, with a break pointing to the upper edge of the range. A breakout south of 106.74, on the other hand, will perhaps spark additional downside towards 106, unlocking the door to potential intraday bearish scenarios.
USD/CAD:
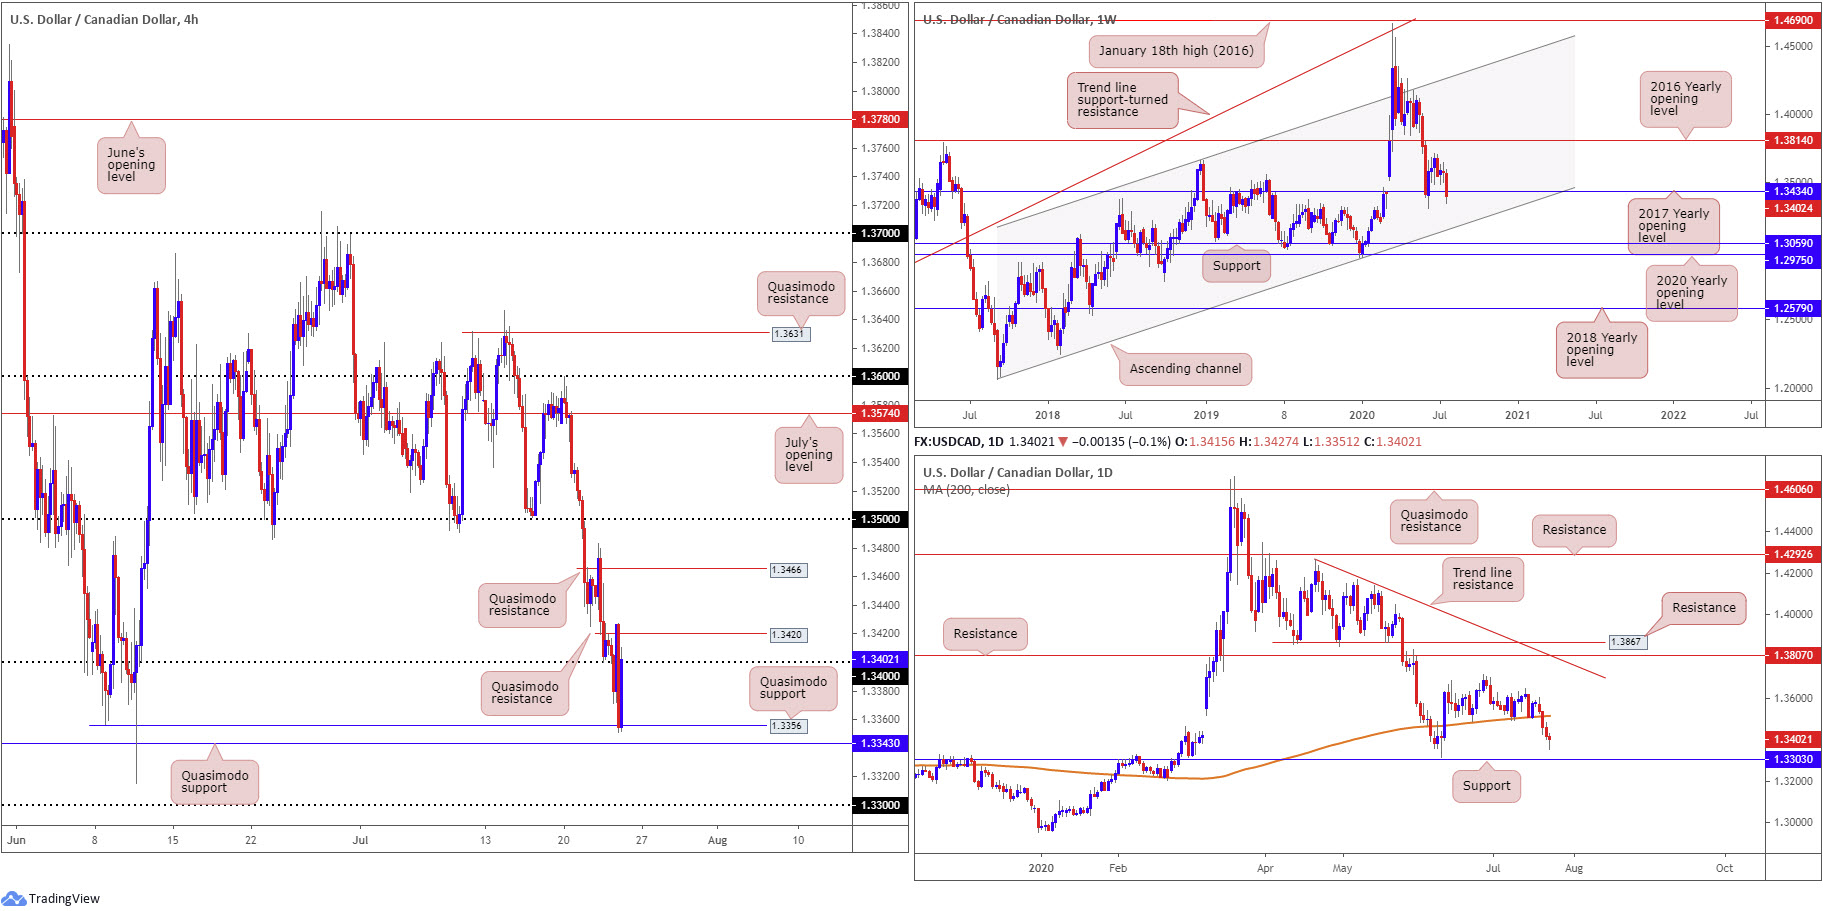
Over the course of Thursday’s session, we penetrated 1.34 to the downside on the H4 and fleetingly visited Quasimodo support at 1.3356. The response from here, as you can see, was prominent, enough to draw H4 back to the underside of 1.34, located just south of Quasimodo resistance at 1.3420. The US dollar Index remained south of 95.00, with WTI also trading in negative territory sub $42.00/bbl.
Weekly price has support, by way of the 2017 yearly opening level, from 1.3434 in play, albeit delivering a delicate tone as of writing. Below 1.3434, channel support, taken from the low 1.2061, can be viewed as the next potential floor. A USD/CAD bid, nevertheless, throws the 2016 yearly opening level at 1.3814 in the pot as feasible resistance, with follow-through buying to try and tackle a dense block of supply between 1.4190/1.3912.
Movement on the daily timeframe shows Tuesday ruptured the 200-day SMA (orange – 1.3514) and extended losses Wednesday. Thursday spiked to lows at 1.3351, though found support off the H4 Quasimodo formation mentioned above at 1.3356. Downside, according to chart structure, is a possibility until reaching support priced in at 1.3303.
Areas of consideration:
Although USD/CAD trades under the 200-day SMA (1.3514), suggesting further downside, weekly buyers could still regain consciousness off support at the 2017 yearly opening level from around 1.3434.
A particularly interesting scenario to keep eyeballs on today is a fakeout above 1.34 to Quasimodo resistance at 1.3420. A H4 close sub 1.34 off 1.3420 suggests a revisit to H4 Quasimodo support at 1.3356, followed by another H4 Quasimodo formation at 1.3343 and then the 1.33 handle (and daily support at 1.3303).
Failure to hold off 1.3420 H4 resistance, a pop to H4 Quasimodo resistance at 1.3466 could be in the offing.
USD/CHF:
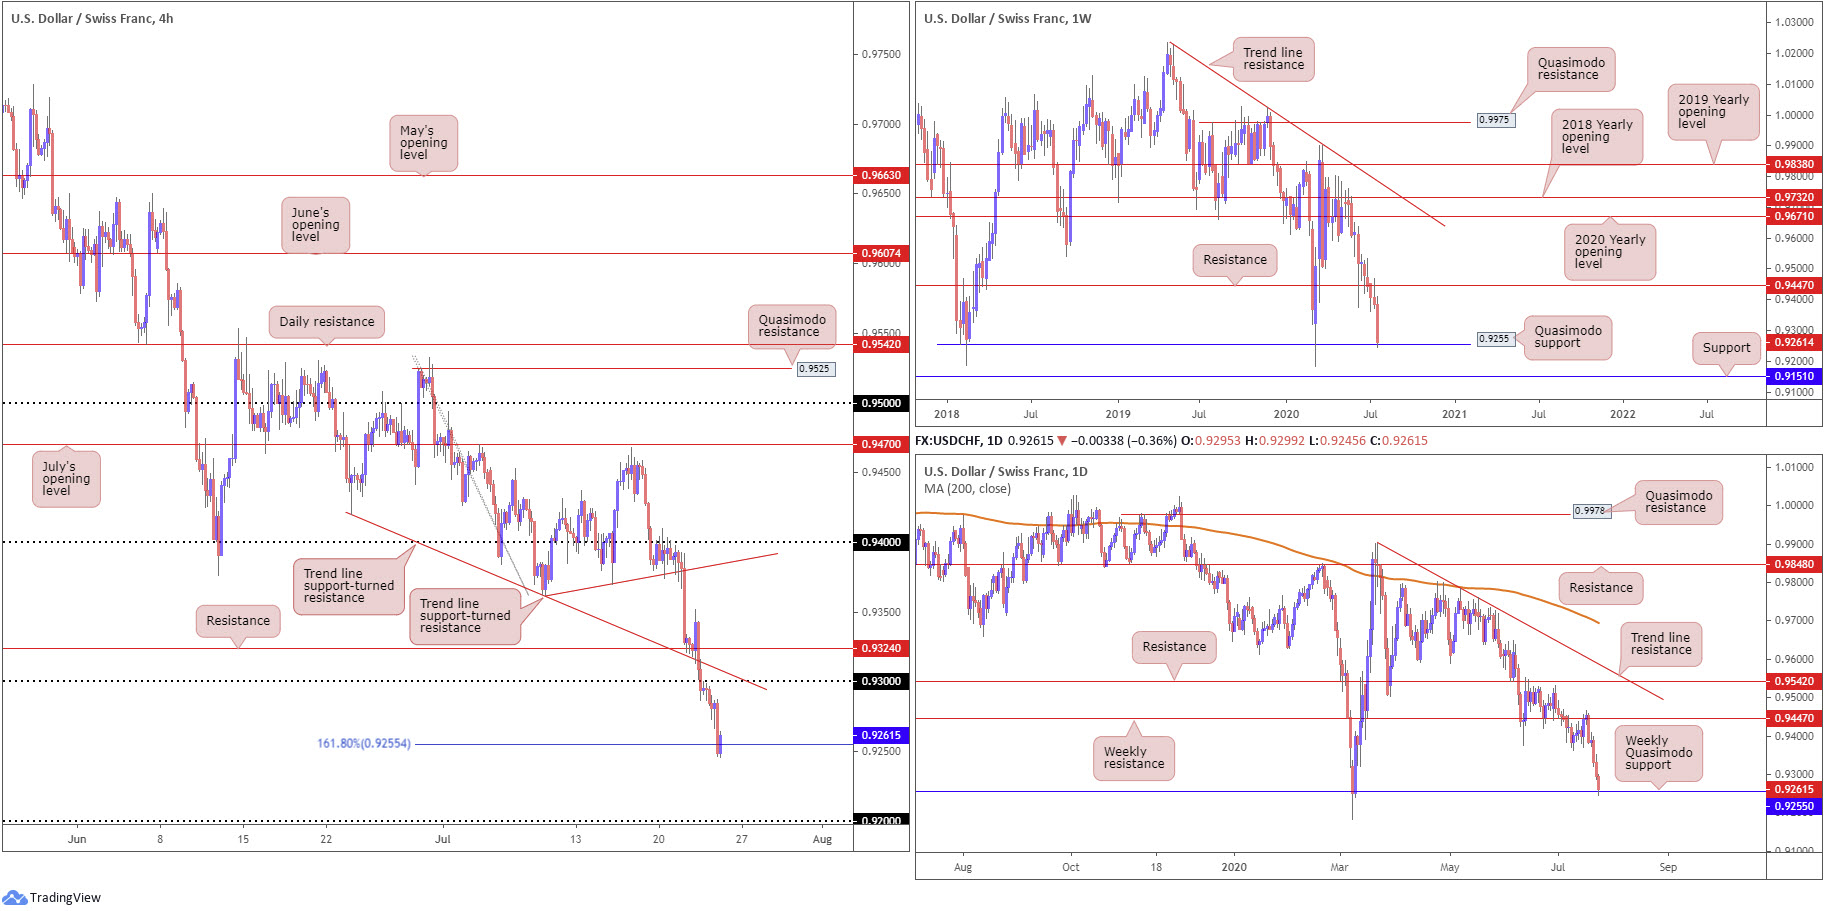
Broad-based USD weakness, seen via the US dollar index, as well as increased demand for the safe-haven Swiss franc amid a decline in equities, weighed on USD/CHF Thursday. Recording a third consecutive losing session, this swept the pair to weekly Quasimodo support at 0.9255, a level research have been monitoring since the break of weekly support at 0.9447.
USD/CHF, based on the H4 timeframe, observed price action extend downside south of 0.93 to shake hands with a 161.8% Fibonacci extension point at 0.9255. Readers may also want to acknowledge the Fibonacci level shares the same space as weekly Quasimodo support.
Areas of consideration:
Although the immediate trend exhibits a downside bias, prudent traders will likely factor in the prospect of a rebound from the 161.8% H4 Fibonacci extension point at 0.9255, given its connection to weekly Quasimodo support. For that reason, crossing paths with 0.93 and H4 trend line support-turned resistance, taken from the low 0.9420, could be seen today.
Yet, a decisive H4 close under 0.9255 unbolts the door to the 0.92 region, throwing across a possible intraday bearish signal.
Dow Jones Industrial Average:
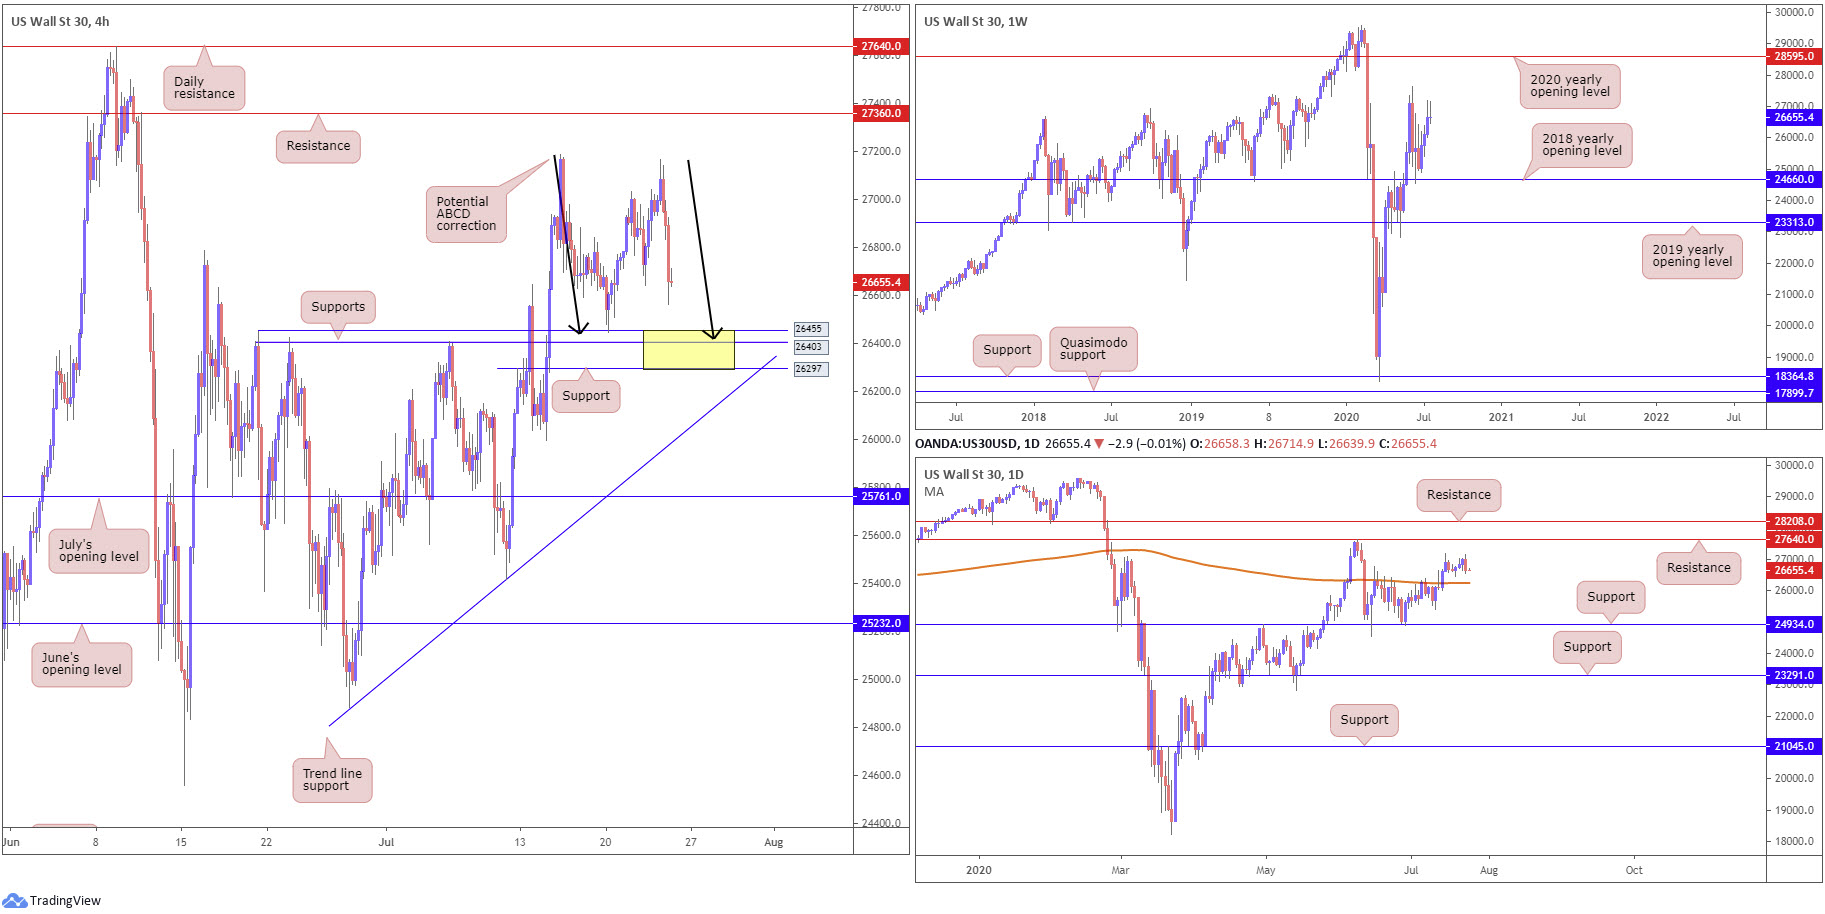
Wall Street finished sharply lower Thursday amid growing signs of a worsening coronavirus pandemic. The Dow Jones Industrial Average shed 353.51 points, or 1.31%; the S&P 500 dropped 40.36 points, or 1.23%, and the tech-heavy Nasdaq 100 concluded lower by 290.16 points, or 2.67%.
Technicians noted H4 price declined to levels just shy of a particularly interesting gathering of supports between 26297/26455 (yellow), an area which if tested completes an ABCD bullish correction (black arrows) at 26417. Areas of resistance to the upside can be seen at 27360, assuming we pass 27167 peaks.
Since climbing above the 200-day SMA (orange – 26253) on July 14, daily price has emphasised a rangebound environment. Despite this, the transition higher has shifted focus towards resistance at 27640. Traders will also acknowledge daily action formed a bearish engulfing candle yesterday, though given we’re currently entrenched within a tight consolidation this may not mean much.
Meanwhile, from the weekly timeframe, the 2018 yearly opening level at 24660 remains an important base of support, with traders likely to eventually pull in the 27638 high, followed by a possible run to the 2020 yearly opening level at 28595.
Areas of consideration:
Testing 26297/26455 on the H4 timeframe today is a possibility, perhaps sparking buying interest having seen the area join with an ABCD correction. A rebound from the aforementioned zone is also reinforced by the fact we have room to navigate higher on the higher timeframes. Conservative traders may still seek additional confirmation before committing, however, as a whipsaw through the support zone into H4 trend line support, taken from the low 24881, could also come to fruition.
XAU/USD (GOLD):
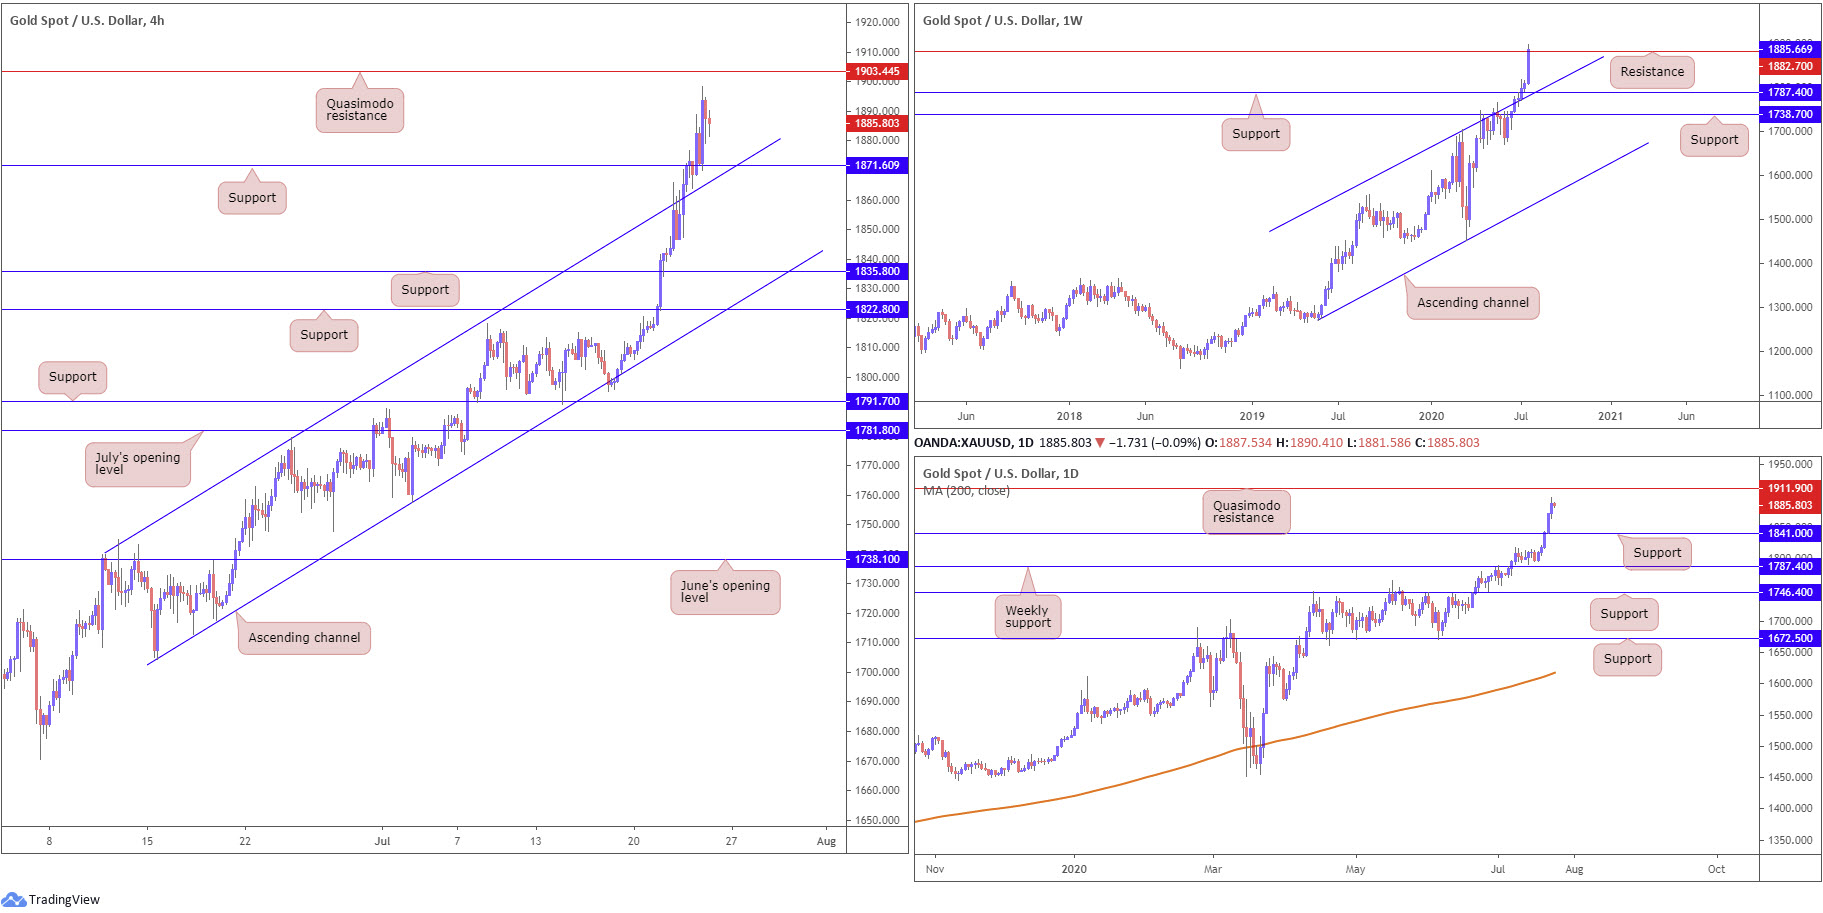
Thursday put up a fifth consecutive daily gain and scored peaks not seen since September 2011, as the US dollar index cemented its position south of the 95.00 handle.
As we transition into Friday’s Asian session, nonetheless, XAU/USD bulls appear to be taking a breather ahead of the 1900.0 point and H4 Quasimodo resistance at 1903.4. This threatens the possibility of a pullback unfolding to H4 support at 1871.6, a base closely joined by channel resistance-turned support, taken from the high 1779.4.
With reference to the bigger picture, we can see weekly price crossing swords with resistance priced in at 1882.7, with a break exposing daily Quasimodo resistance at 1911.9, followed by the all-time high stationed at 1921.0.
Areas of consideration:
The point H4 support at 1871.6 merges with H4 channel support is an interesting area to keep eyes on, in the event of further downside. Despite the underlying trend echoing considerable strength right now, entering long from 1871.6, knowing we’re coming from weekly resistance at 1882.7, may deter some buying. On the other hand, though, daily price still exhibits scope to approach Quasimodo resistance coming in at 1911.9 (and H4 to QM resistance at 1903.4), therefore a H4 retest at 1871.6 that’s accompanied by a H4 bullish candlestick pattern may be enough to influence bullish scenarios.
The accuracy, completeness and timeliness of the information contained on this site cannot be guaranteed. IC Markets does not warranty, guarantee or make any representations, or assume any liability regarding financial results based on the use of the information in the site.
News, views, opinions, recommendations and other information obtained from sources outside of www.icmarkets.com.au, used in this site are believed to be reliable, but we cannot guarantee their accuracy or completeness. All such information is subject to change at any time without notice. IC Markets assumes no responsibility for the content of any linked site.
The fact that such links may exist does not indicate approval or endorsement of any material contained on any linked site. IC Markets is not liable for any harm caused by the transmission, through accessing the services or information on this site, of a computer virus, or other computer code or programming device that might be used to access, delete, damage, disable, disrupt or otherwise impede in any manner, the operation of the site or of any user’s software, hardware, data or property.


