Key risk events today:
Eurozone, UK and US Flash Services and Flash Manufacturing PMIs.
(Previous analysis as well as outside sources – italics).
EUR/USD:
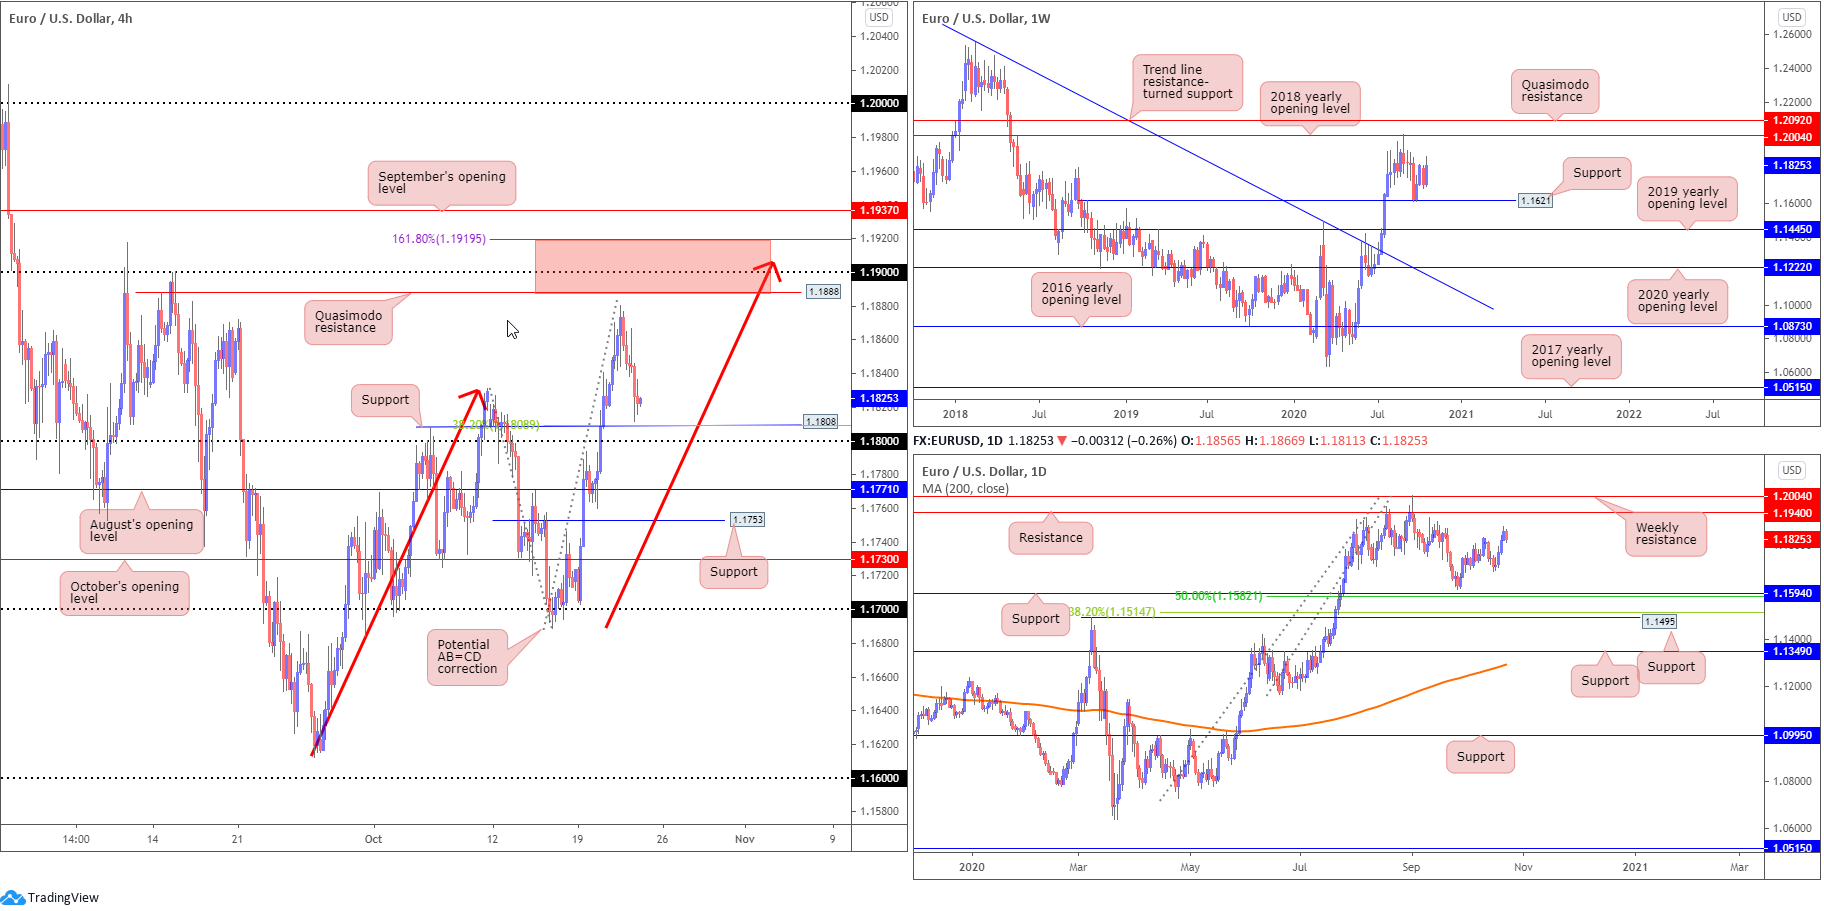
Amidst a moderate upturn in the US dollar index, snapping a four-day bearish phase, EUR/USD twisted lower Thursday and left H4 Quasimodo resistance at 1.1888 unchallenged (sited close by the 1.19 handle, along with an AB=CD correction point at 1.1905 [red arrows] and a 1.618 BC projection plotted at 1.1919). H4 candles now face nearby support at 1.1808, merging with a 38.2% Fibonacci retracement and neighbouring 1.18 handle.
Technicians, according to the weekly timeframe, will acknowledge room to advance, as bulls strengthen their position north of minor support at 1.1621. The next upside target on the weekly scale falls in around the 2018 yearly opening value at 1.2004 (a level that capped upside attempts in late August).
The technical position on the daily timeframe also exhibits scope to explore higher terrain, with little stopping bulls from taking a run at resistance coming in from 1.1940. It is worth noting this base is sited just under weekly resistance mentioned above at 1.2004.
Areas of consideration:
- Support at 1.1808, merging with a 38.2% Fibonacci retracement and neighbouring 1.18 handle offers a layer of support to work with today.
- The H4 zone marked red between 1.1919/1.1888 is made up of strong H4 resistances and, therefore, may contain enough fuel to prompt a bearish reply.
- While the H4 area underlined above offers appeal, September’s opening value on the H4 timeframe at 1.1937, and its connection with daily resistance at 1.1940, opens up the possibility of a fakeout forming through 1.1919 before sellers make an appearance.
GBP/USD:
Having been in pole position only 24 hours ago, sterling rocked lower against the US dollar Thursday and snapped a four-day bullish phase.
For those who read Thursday’s technical briefing you may recall the following (italics):
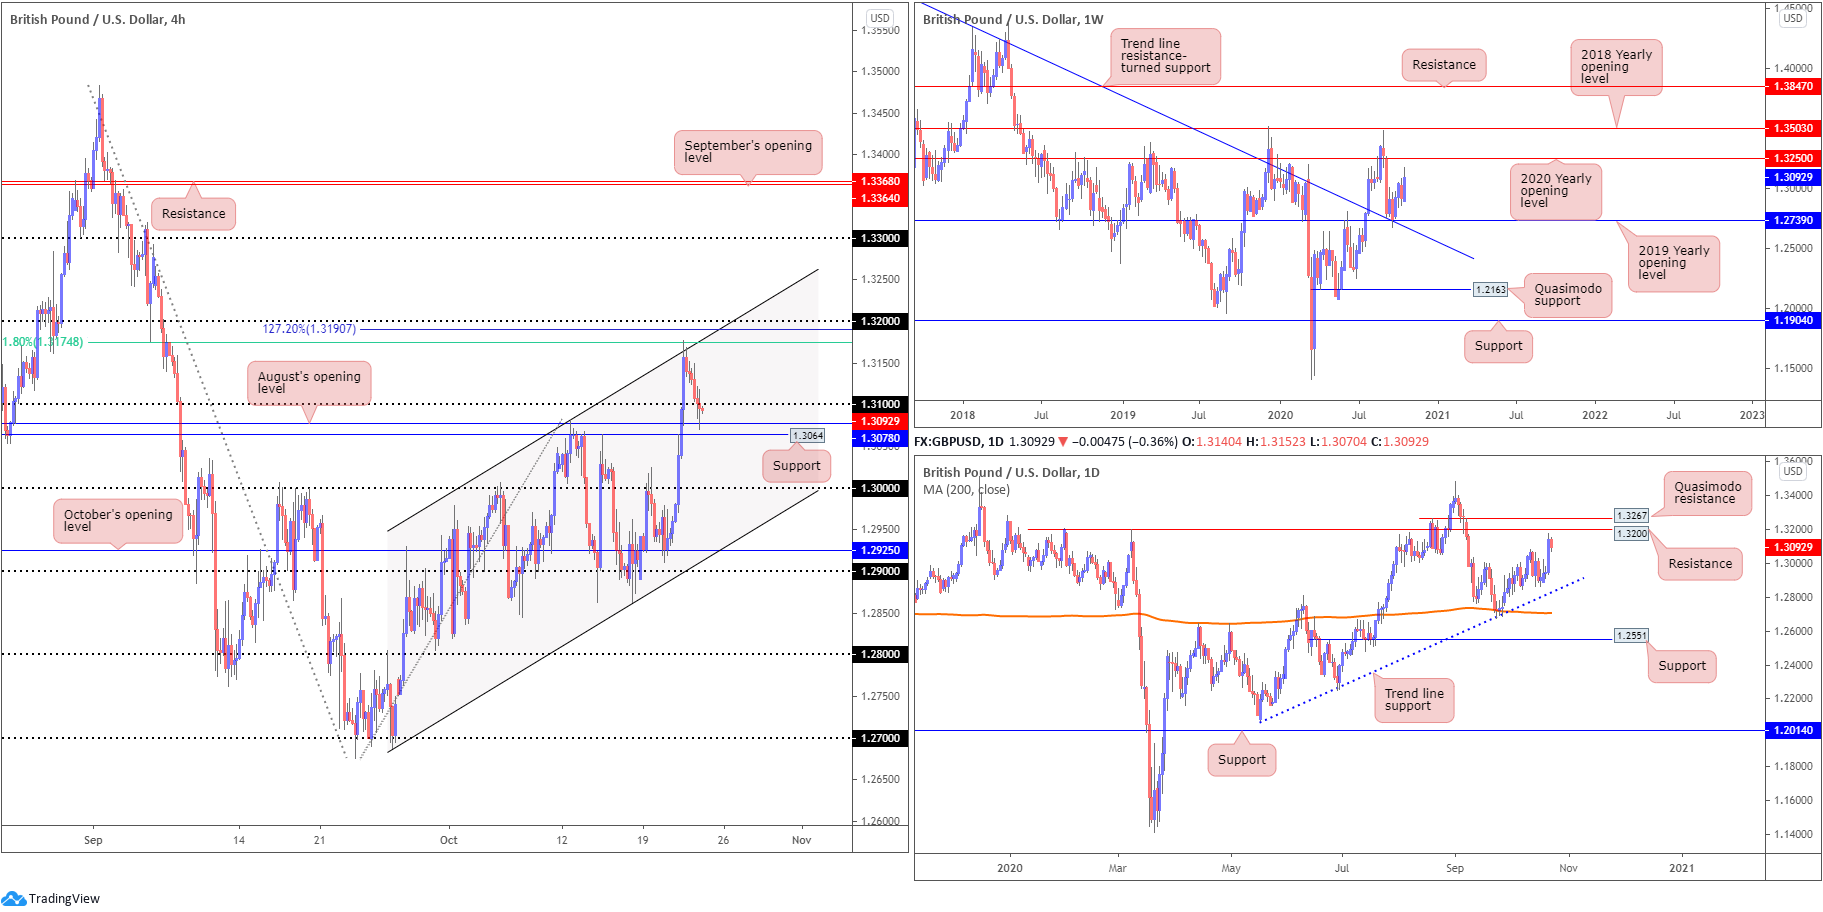
H4 timeframe – we can see recent upside welcomed channel resistance, taken from the high 1.3082. Note this area also converges with a 61.8% Fibonacci retracement ratio at 1.3174 and a nearby 127.2% Fibonacci projection point at 1.3190, along with the 1.32 handle.
Weekly price, as evident from the chart, is seen pursuing resistance at 1.3250, a 2020 yearly opening value, while daily action nears resistance from 1.3200, shadowed closely by a Quasimodo resistance at 1.3267.
As evident from the charts, price left daily resistance at 1.3200 unchallenged and rebounded from the H4 channel resistance/61.8% Fibonacci retracement combination. This witnessed the 1.31 handle (H4) enter the fray amid US hours, aided by H4 support in the shape of August’s opening value at 1.3078 (sited just north of another support at 1.3064).
Areas of consideration:
- The 1.31 handle, albeit offering up a feeble tone right now, is likely a watched support today, owing to converging H4 support nearby at 1.3078 and 1.3064.
- The key figure 1.30 could also be on the watchlist for some. Though this level, according to our chart studies, lacks confluence, both locally and from the higher timeframes.
Clearance of 1.32 unlocks potential bullish scenarios to weekly resistance at 1.3250, followed by daily Quasimodo resistance at 1.3267 and then the 1.33 handle based on the H4.
AUD/USD:
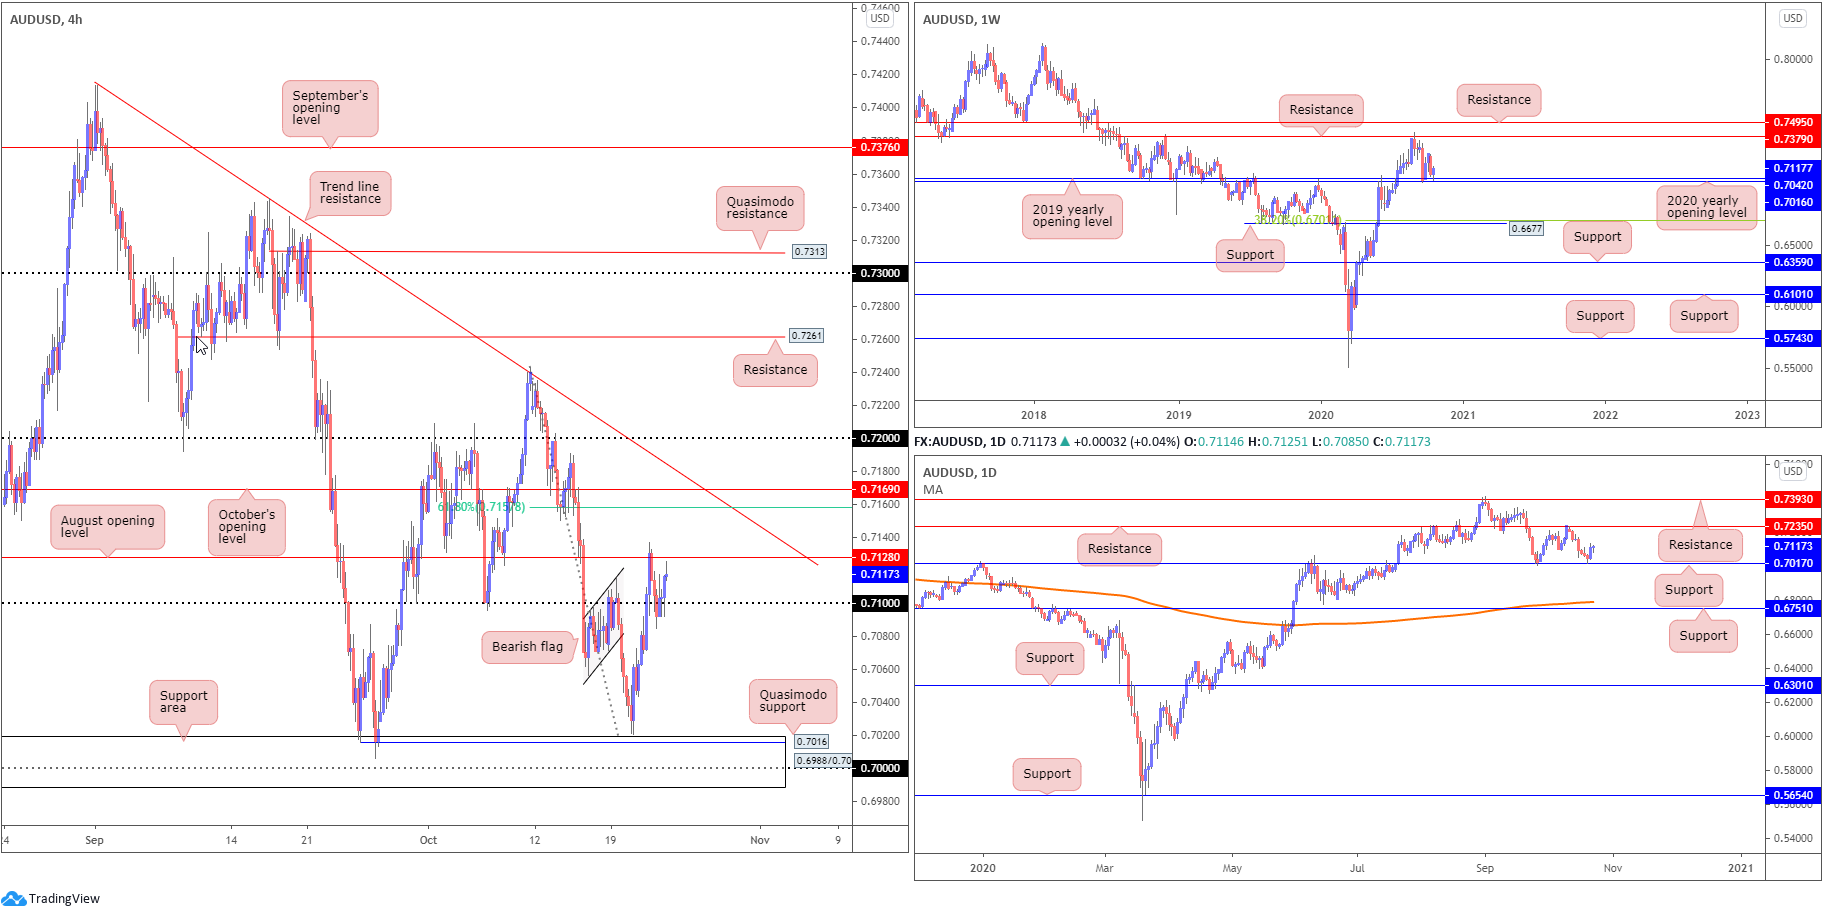
The Australian dollar wrapped up Thursday off session lows against a broadly upbeat USD, chaotically holding the 0.71 handle on the H4 timeframe to potentially test the mettle of August’s opening value at 0.7128 today. Any sustained movement beyond the latter exposes October’s opening value at 0.7169, which happens to intersect closely with a 61.8% Fibonacci retracement at 0.7157, as well as a trend line resistance, extended from the high 0.7413.
Upside pressure, as underlined in Thursday’s technical briefing, should not really be a surprise. Recent analysis noted we’re coming from weekly support (made up of the 2020 [0.7016] and 2019 [0.7042] yearly opening values), together with daily price bottoming three pips ahead of support at 0.7017. As for the trend, AUD/USD has offered a healthy bullish stance since early 2020.
Areas of consideration:
Outlook unchanged.
- Owing to where we trade on the higher timeframes, in addition to the current uptrend, continuation moves above August’s opening value at 0.7128 on the H4 is STILL a possible setup to be aware of, targeting 0.7169ish as an initial base. Conservative buyers might opt to wait and see if a 0.7128 retest forms before committing.
USD/JPY:
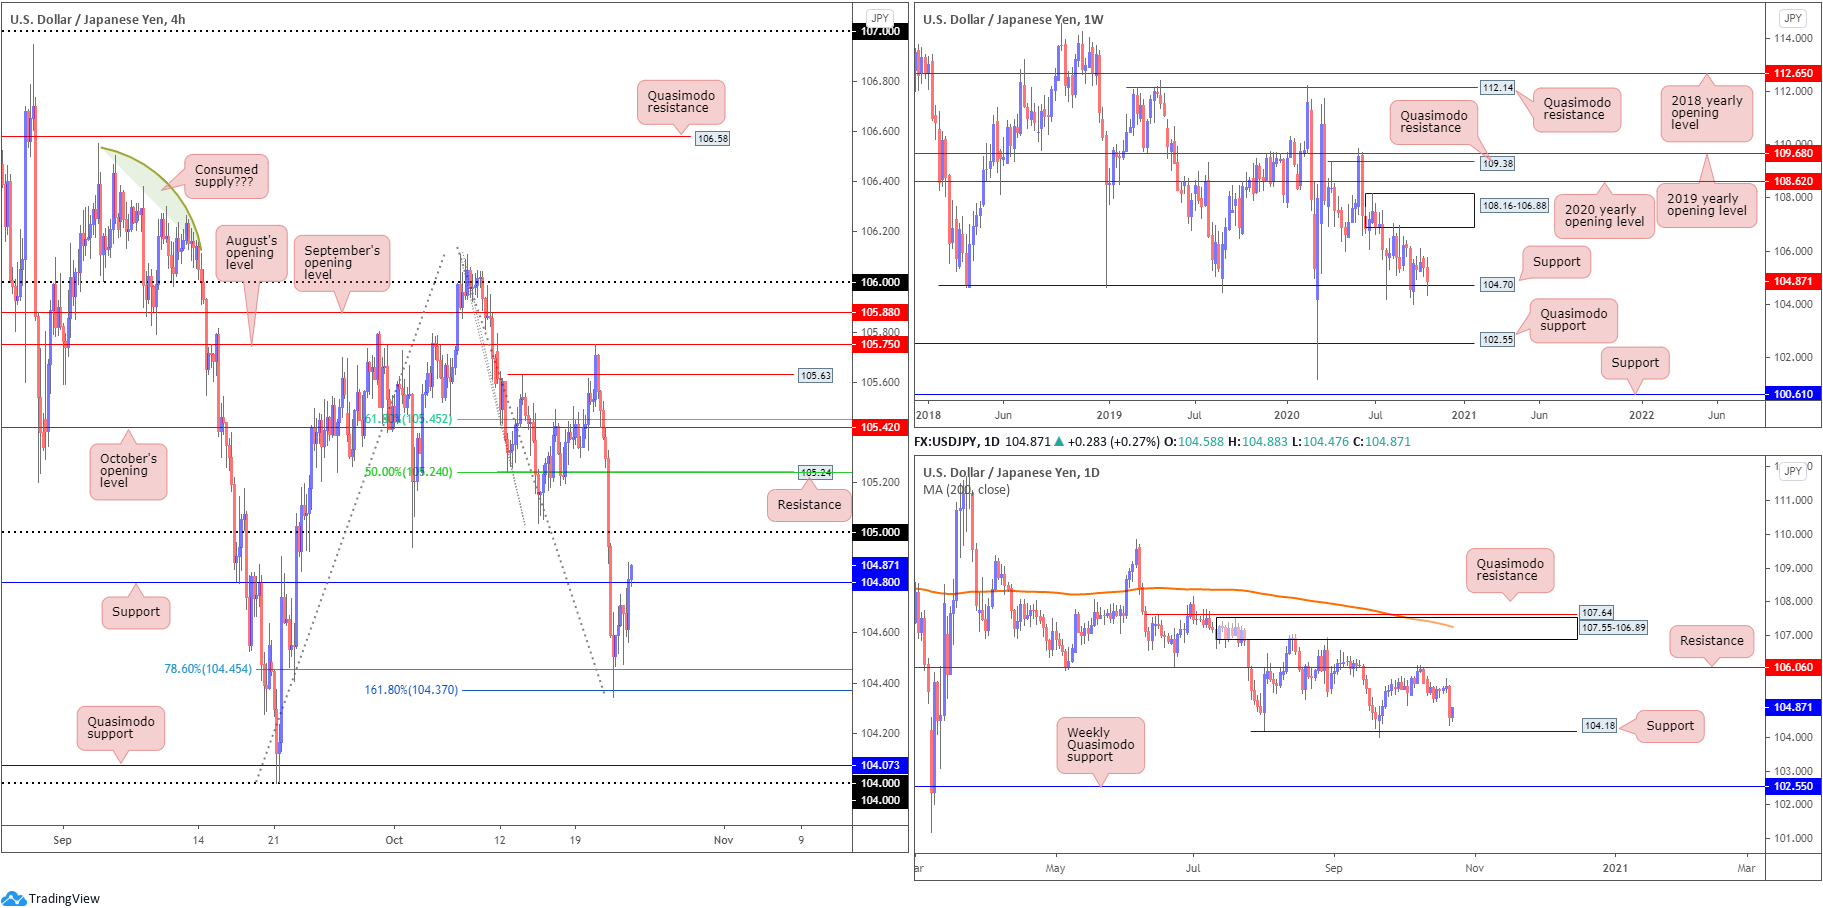
Following Wednesday’s decisive near-1% decline, USD/JPY bulls made an appearance Thursday amidst resurgent dollar demand.
Unable to breach the 161.8% H4 Fibonacci projection point at 104.37 (and 78.6% Fibonacci retracement ratio at 104.45), H4 candle flow found some grip north of resistance (now potential support) at 104.80. This perhaps shifts the spotlight towards 105 and neighbouring resistances overhead at 105.24 and October’s opening value at 105.42 (and 61.8% Fibonacci retracement ratio at 105.45).
Further out, weekly price, although recently entering space south of support at 104.70, is seen balancing above the aforementioned level thanks to yesterday’s bid. Daily price, on the other hand, pencilled in a bottom just ahead of support fixed from 104.18. Eventually breaking the latter, however, could spark strong bearish interest, with weekly Quasimodo support at 102.55 targeted.
Areas of consideration:
- The break of H4 resistance at 104.80, in light of weekly support at 104.70 holding position, could encourage an intraday bullish theme today, targeting H4 resistances 105, 105.24, 105.42. If you drill down to the H1 timeframe you’ll note the candles are, as we write, retesting 104.80 as support.
- H4 resistance at 105.24 and 105.42 are interesting levels, with the latter sharing space with a 50.0% retracement and the former a 61.8% Fibonacci retracement at 105.45.
USD/CAD:
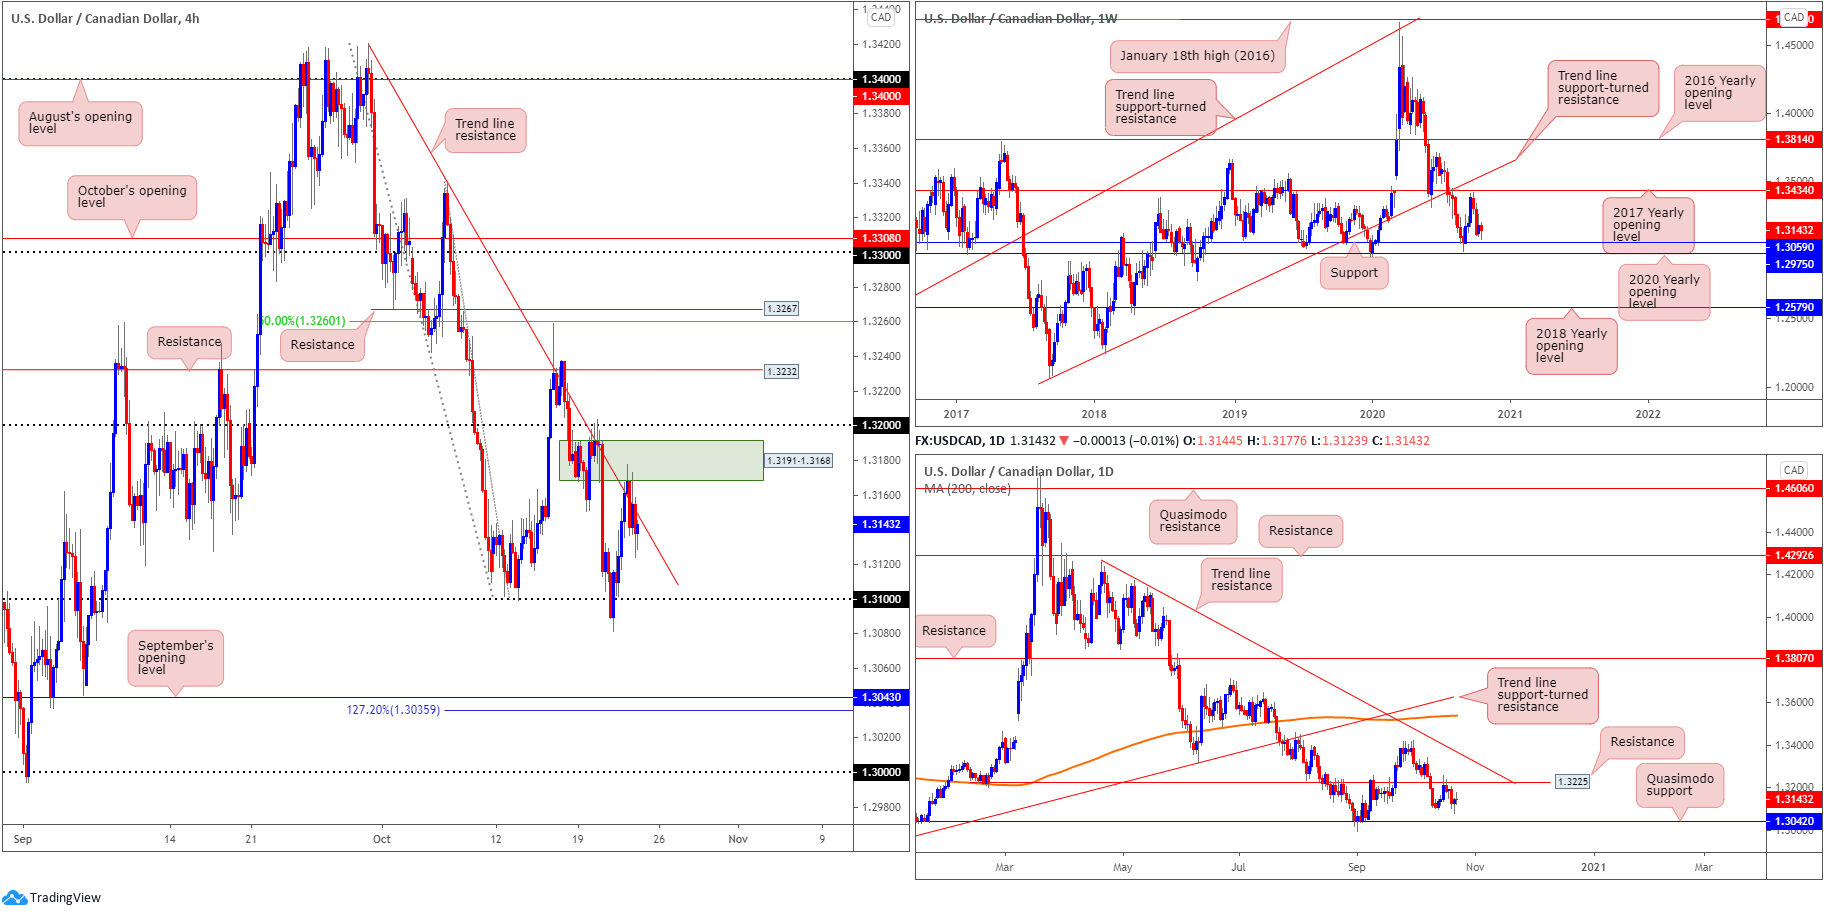
Wednesday’s stronger-than-anticipated recovery from 1.31 on the H4 scale swerved trend line resistance, taken from the high 1.3420, into sight Thursday. Aided by supply (green) around 1.3191-1.3168 (sited south of 1.32), the aforementioned trend line formed a relatively stable limit yesterday which may prompt another run at 1.31 today. Digging under 1.31, however, will have traders’ crosshairs shift towards September’s opening value at 1.3043 (according to our charts), closely shadowed by a 127.2% Fibonacci projection point at 1.3036.
Following a two-week decline south of the 2017 yearly opening value at 1.3434 on the weekly timeframe, price discovered a floor ahead of support at 1.3059 in recent dealings (arranged above the 2020 yearly opening value at 1.2975).
Daily resistance at 1.3225 nudged its way into the spotlight last week and has so far served sellers well. Downside momentum subsided Wednesday, responding by way of a hammer candle pattern. Despite considered a bullish signal, the formation failed to deliver much upside as price responded in the shape of a shooting star candlestick configuration. Should bears regain some form of control today/early next week, Quasimodo support at 1.3042 is a possible scenario.
Areas of consideration:
For those who read Thursday’s technical briefing you may recall the following (italics):
As both weekly and daily timeframes exhibit scope to move as far south as 1.3059 (weekly timeframe), reacting from H4 trend line resistance (1.3420) or H4 supply at 1.3191-1.3168 is a possibility.
Traders short the trend line resistance/supply combination are likely eyeballing moves towards 1.31 today. Tunnelling under 1.31 on the H4 also unchains a potential bearish theme, targeting 1.3059 as an initial take-profit zone.
USD/CHF:
For those who read Thursday’s technical briefing, you may recall the following (italics):
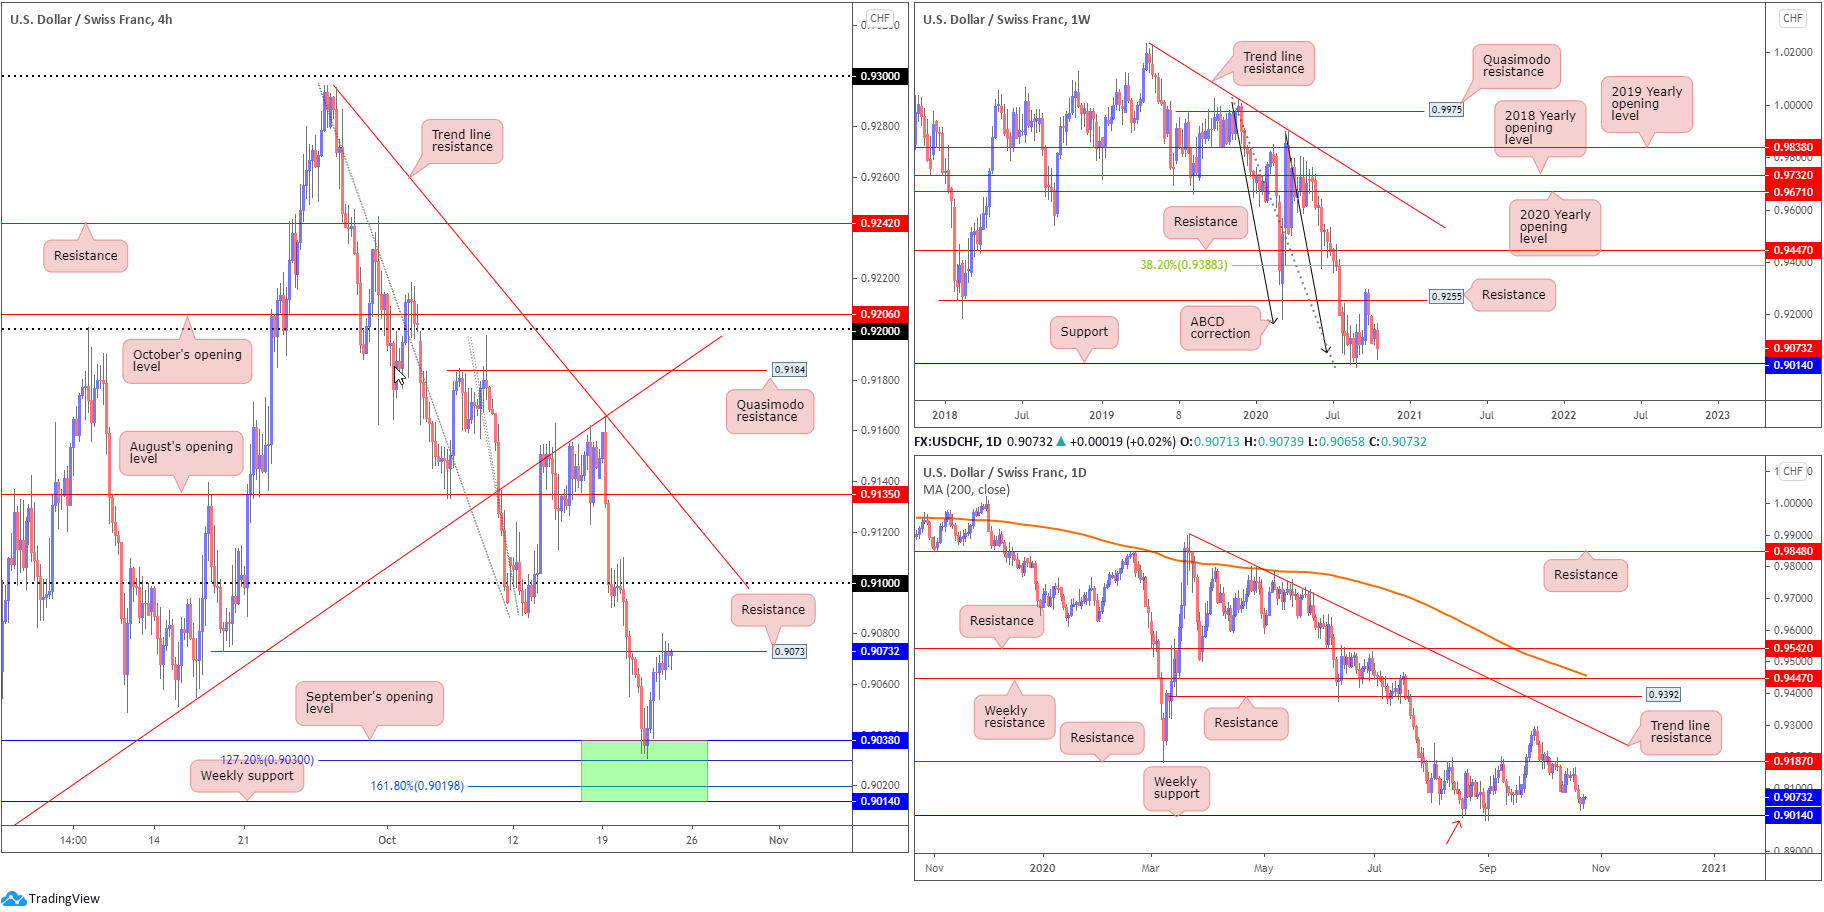
The area marked green on the H4 timeframe between weekly support at 0.9014 and September’s opening value from 0.9038 echoes strong support.
As can be seen from the H4 chart this morning, buyers defended the upper boundary of 0.9014/0.9038 and has since advanced to test H4 resistance coming in at 0.9073.
Based off the weekly timeframe’s technical position, we can see the unit fast approaching support at 0.9014, bolstered by ABCD support at 0.9051 (black arrows). Closer analysis of price action on the daily timeframe also reveals the pair closing in on weekly support mentioned above at 0.9014, after failing to grip resistance priced in at 0.9187. What’s interesting is weekly support on the daily chart also represents a Quasimodo support (red arrow – left shoulder).
Areas of consideration:
- Traders long 0.9014/0.9038 likely reduced risk to breakeven at H4 resistance from 0.9073, with eyes on 0.91 as the next upside target. Additional bullish scenarios above 0.9073, therefore, could be a possibility.
- On the other side of the coin, while there is clearly some interest from buyers, a dip to test weekly support at 0.9014 could still eventually develop.
Dow Jones Industrial Average:
US equity indexes finished higher Thursday amid upbeat economic data. The Dow Jones Industrial Average climbed 152.84 points, or 0.54%, the S&P 500 rallied 17.93 points, or 0.52% while the Nasdaq traded higher by 21.31 points, or 0.19%.
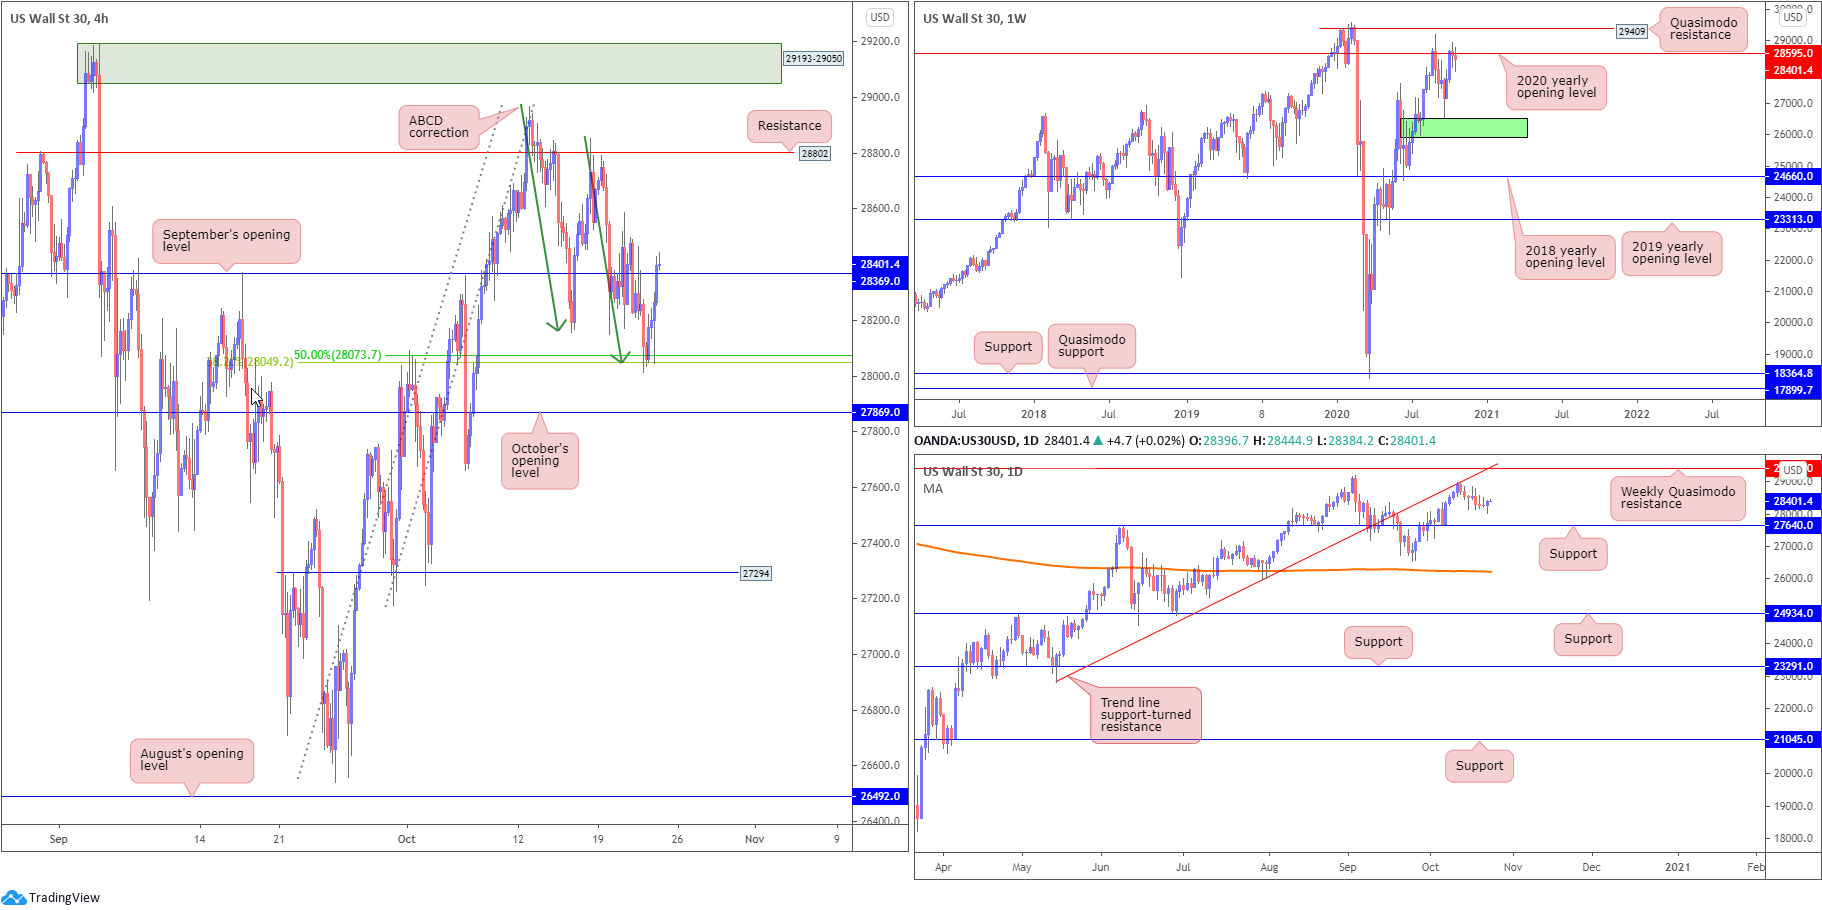
From a technical position, weekly action remains flirting with 28595, a 2020 yearly opening value, with a break shining the spotlight on Quasimodo resistance at 29409. Daily price, on the other hand, concluded Thursday in the shape of a hammer pattern (bullish signal), north of support at 27640. Further buying from this point, according to the daily timeframe, could stretch as far north as the weekly Quasimodo resistance at 29409, which happens to converge with trend line support-turned resistance, extended from the low 22803.
Across the page on the H4 chart, we can see the candles rebounded from ABCD support (green arrows) at 28049, a completion point strengthened by a 38.2% Fibonacci retracement ratio and a 50.0% retracement ratio at 28073. Notably, we also crossed above resistance at 28369 (September’s opening value), potentially setting the technical stage for a push to resistance at 28802.
Areas of consideration:
- Bullish breakout setups could be discovered north of 28369, providing impetus to approach H4 resistance at 28808. However, do bear in mind that upside could find resistance prior to 28808 at weekly resistance from 28595. Conservative buyers, therefore, are likely to wait and see if 28369 is retested before committing.
XAU/USD (GOLD):
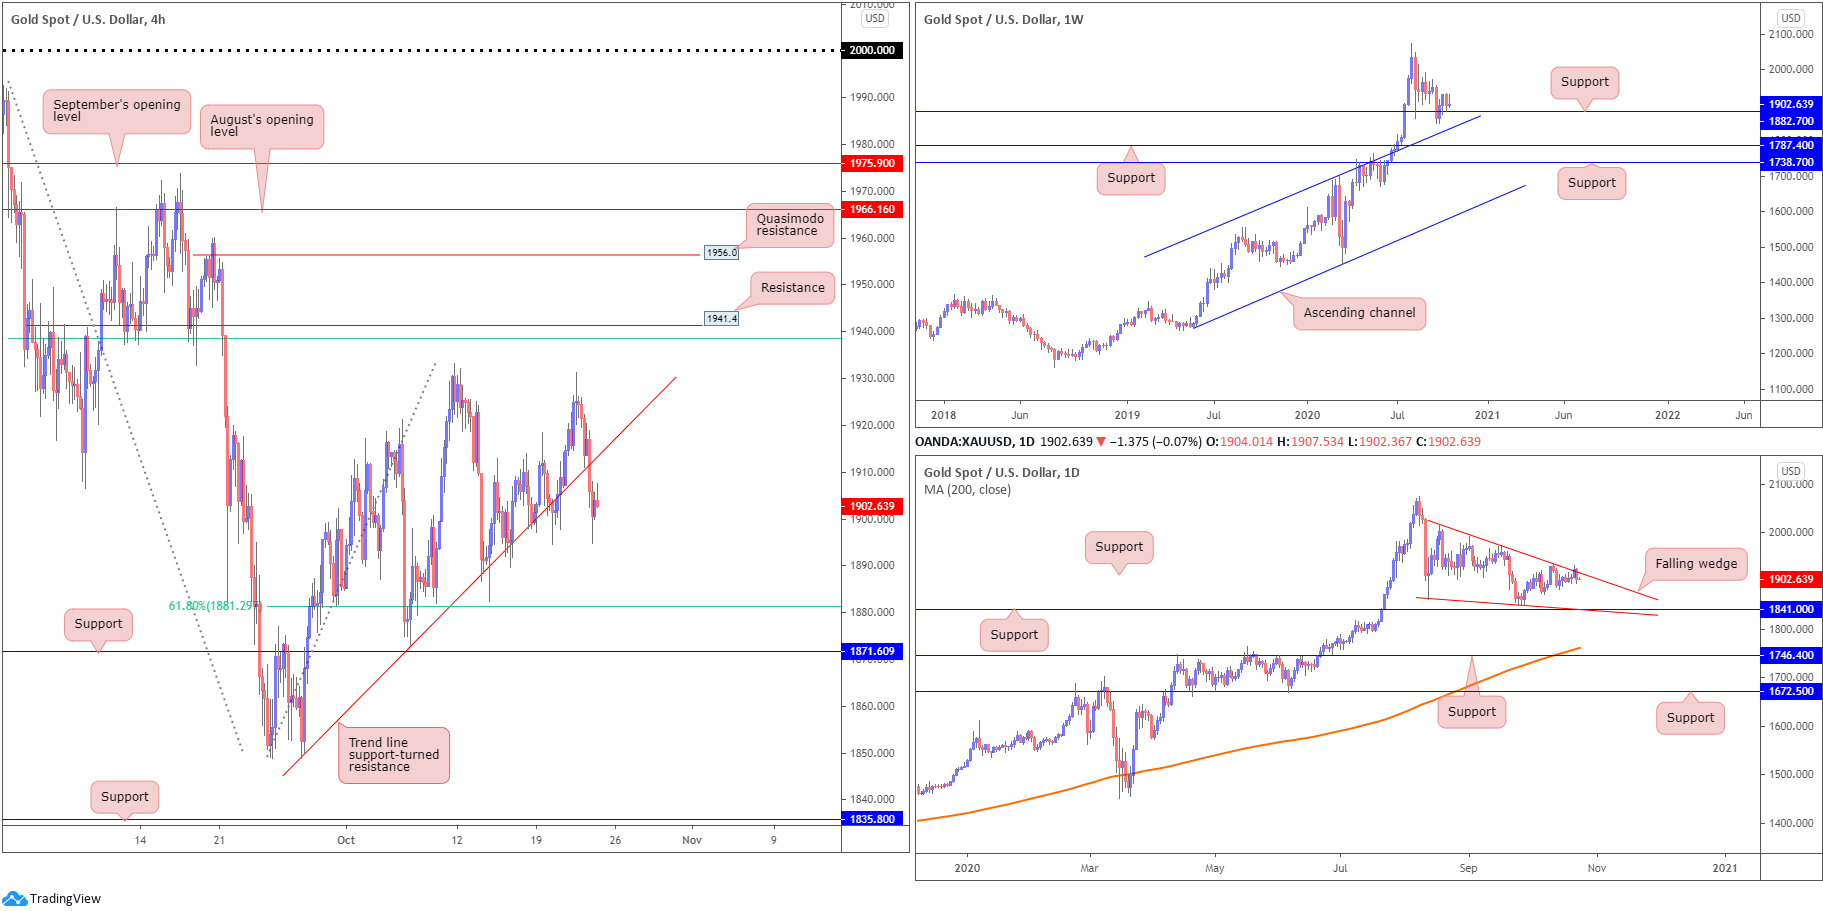
Buyers and sellers continue to battle for position around weekly support at $1,882, fixed a touch above channel resistance-turned support, taken from the high $1,703. While the trend (higher since 2016) favours a bullish scenario here, the lack of buying interest seen from mid-August implies a dip to the aforementioned channel support. Traders are also urged to pencil in supports at $1,787 and $1,738 in the event buyers fail to make an appearance.
The daily timeframe recently tested a descending resistance line, taken from the high $2,015, and held firm Thursday, engulfing Wednesday’s upside move. We also appear to have a falling wedge forming between $2,015 and $1,862, which may be interpreted as a continuation signal in the event of a breakout north.
The technical landscape on the H4 chart shows price failed to challenge near-two-week peaks at $1,933 before tumbling on Thursday and overthrowing trend line support, taken from the low $1,848. This may have sellers work towards the 61.8% Fibonacci retracement ratio at $1,881 today, followed by support at $1,871.
Areas of consideration:
- The break of H4 trend line support helps confirm additional downside from the upper border of the daily timeframe’s falling wedge. Therefore, H4 bearish breakout strategies could be targeting the $1,881/$1,871 region today. A retest at the H4 trend line may also prompt conservative selling.
- Expecting much more of a move beyond $1,881/$1,871 is tricky since you’re then also dealing with weekly support at $1,882.
The accuracy, completeness and timeliness of the information contained on this site cannot be guaranteed. IC Markets does not warranty, guarantee or make any representations, or assume any liability regarding financial results based on the use of the information in the site.
News, views, opinions, recommendations and other information obtained from sources outside of www.icmarkets.com.au, used in this site are believed to be reliable, but we cannot guarantee their accuracy or completeness. All such information is subject to change at any time without notice. IC Markets assumes no responsibility for the content of any linked site.
The fact that such links may exist does not indicate approval or endorsement of any material contained on any linked site. IC Markets is not liable for any harm caused by the transmission, through accessing the services or information on this site, of a computer virus, or other computer code or programming device that might be used to access, delete, damage, disable, disrupt or otherwise impede in any manner, the operation of the site or of any user’s software, hardware, data or property