
Key risk events today:
UK Retail Sales m/m; ECB President Lagarde due to speak at an online event hosted by the European Banking Congress; Canada Core Retail Sales m/m and Retail Sales m/m.
(Previous analysis as well as outside sources – italics).
EUR/USD:
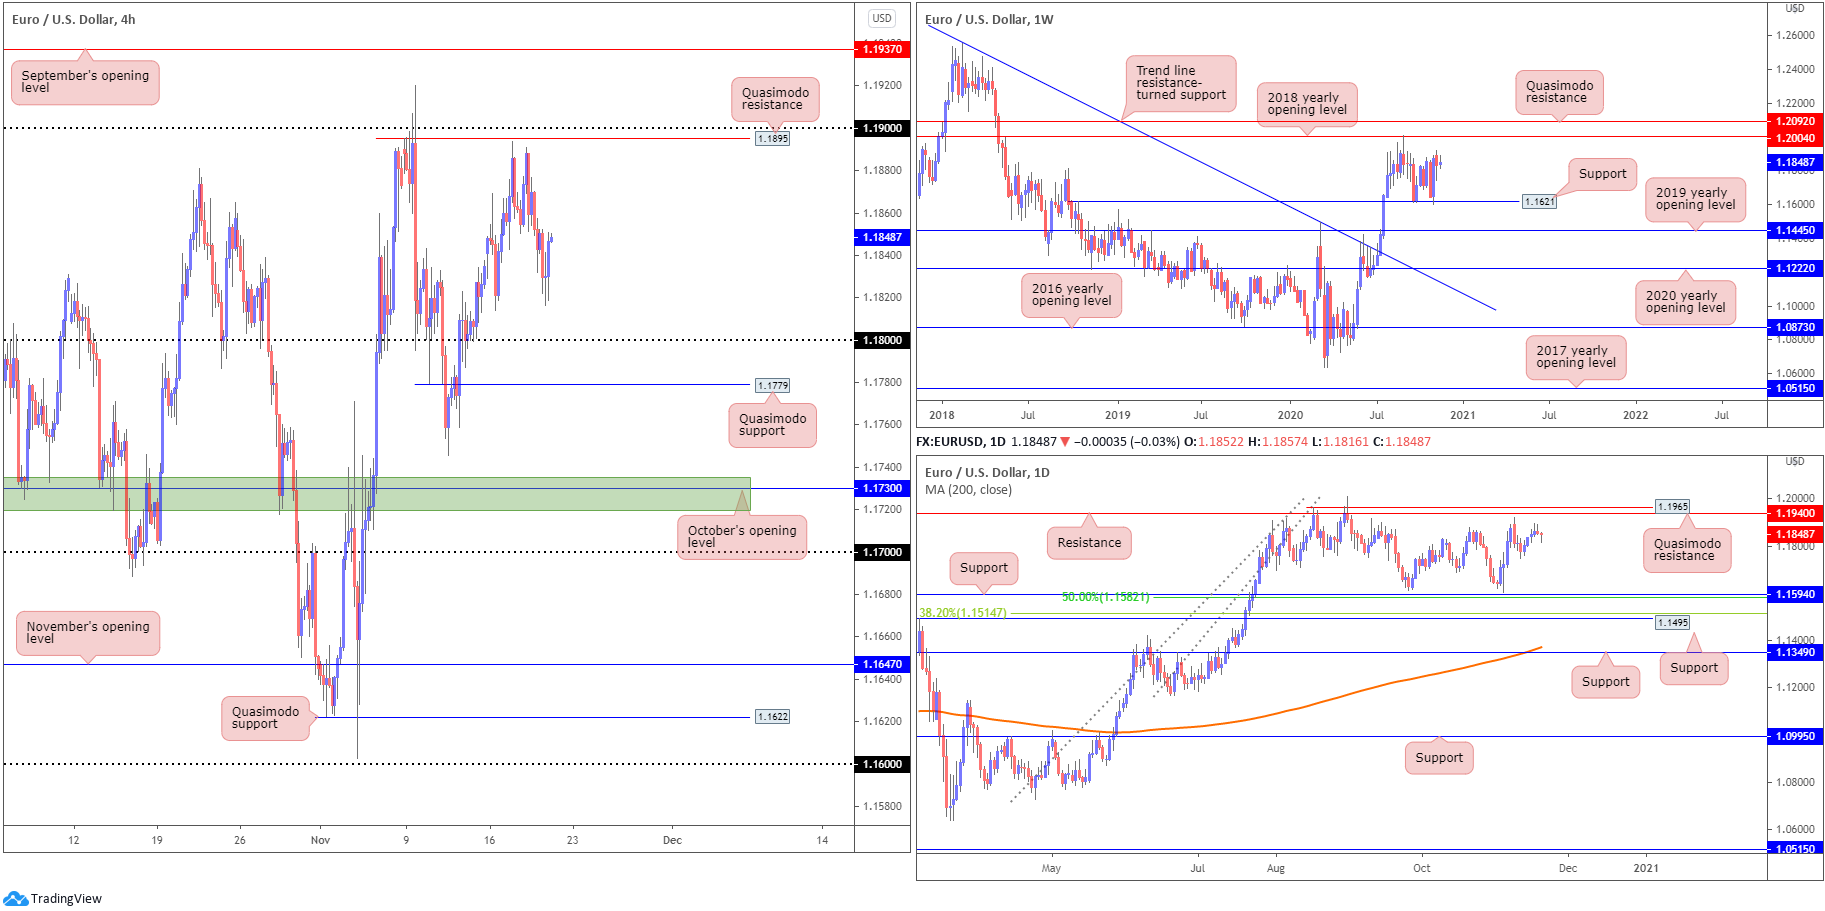
Europe’s shared currency finished Thursday significantly off session lows at 1.1816, consequently moulding a daily hammer candlestick signal.
Technical direction on the weekly timeframe remains to the upside, following healthy demand off support at 1.1621 early November. Buyers appear poised to approach the 2018 yearly opening value from 1.2004, closely shadowed by Quasimodo resistance at 1.2092.
Direction on the weekly timeframe is further reinforced by the daily timeframe’s recently formed bullish candlestick signal. Resistance on the daily chart can be seen at 1.1940, followed by Quasimodo resistance from 1.1965.
H4 discovered support around the 1.1820ish region yesterday, arranged in the shape of three clear-cut buying tails. This spins the spotlight towards Quasimodo resistance at 1.1895 and the 1.19 handle. Lack of interest to the upside, nonetheless, could swing things towards 1.18, with a possible dip to Quasimodo support priced in at 1.1779.
Areas of consideration:
- 18 is likely watched in this market. Sell-stop liquidity resting south of this round number (protective stop-loss orders and breakout sellers’ orders) may also tempt a fakeout lower to draw in fresh buyers from H4 Quasimodo support at 1.1779.
- 19 and H4 Quasimodo resistance at 1.1895 may come forward today. Though this area will have pending sell orders, higher timeframe resistance is not observed around this region.
- Breakout buying may form north of 1.19 on the H4, targeting September’s opening value at 1.1937.
- September’s opening value on the H4 and daily resistance at 1.1940 marks healthy confluence to work with if a breach of 1.19 occurs.
GBP/USD:
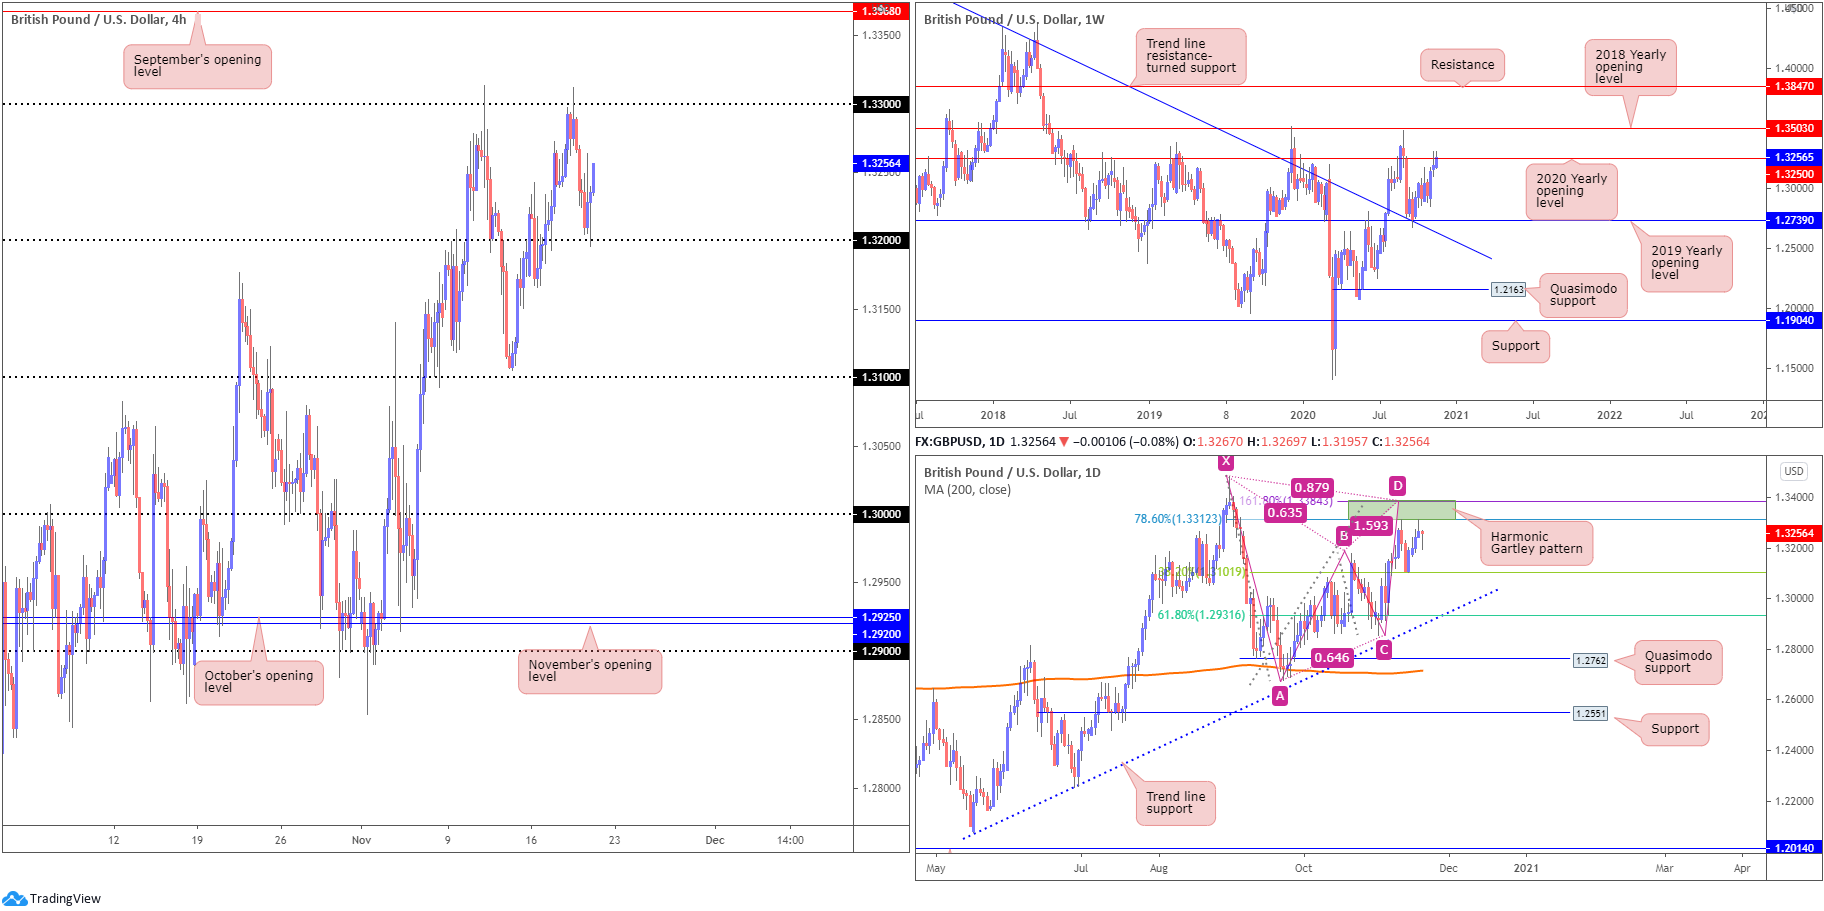
Some initial weakness took hold Thursday amidst Brexit talks, spiking to lows at 1.3195 and testing the grip of the 1.32 handle on the H4 scale. The rebound from 1.32 has so far exhibited strong position, threatening a potential follow-through towards 1.33 and the formation of a daily hammer candle pattern.
The 2020 yearly opening value at 1.3250 remains under attack on the weekly timeframe, with additional strength to potentially see the unit knock on the door of the 2018 yearly opening value from 1.3503. In line with resistance on the H4 timeframe at 1.33, however, daily price recently shook hands with a bearish harmonic Gartley pattern’s PRZ at 1.3384/1.3312, with the 38.2% daily Fibonacci retracement ratio at 1.3101 to target.
Areas of consideration:
- Weekly resistance at 1.3250 (the 2020 yearly opening value) is a key level in this market, as is 1.33 on the H4 joining with the daily bearish harmonic Gartley pattern’s PRZ at 1.3384/1.3312. Therefore, structurally GBP/USD parades strong resistance.
- Beneath 1.32 perhaps unlocks bearish scenarios, not only due to the higher timeframes suggesting moves lower but also because H4 action shows room to potentially push for 1.31.
AUD/USD:
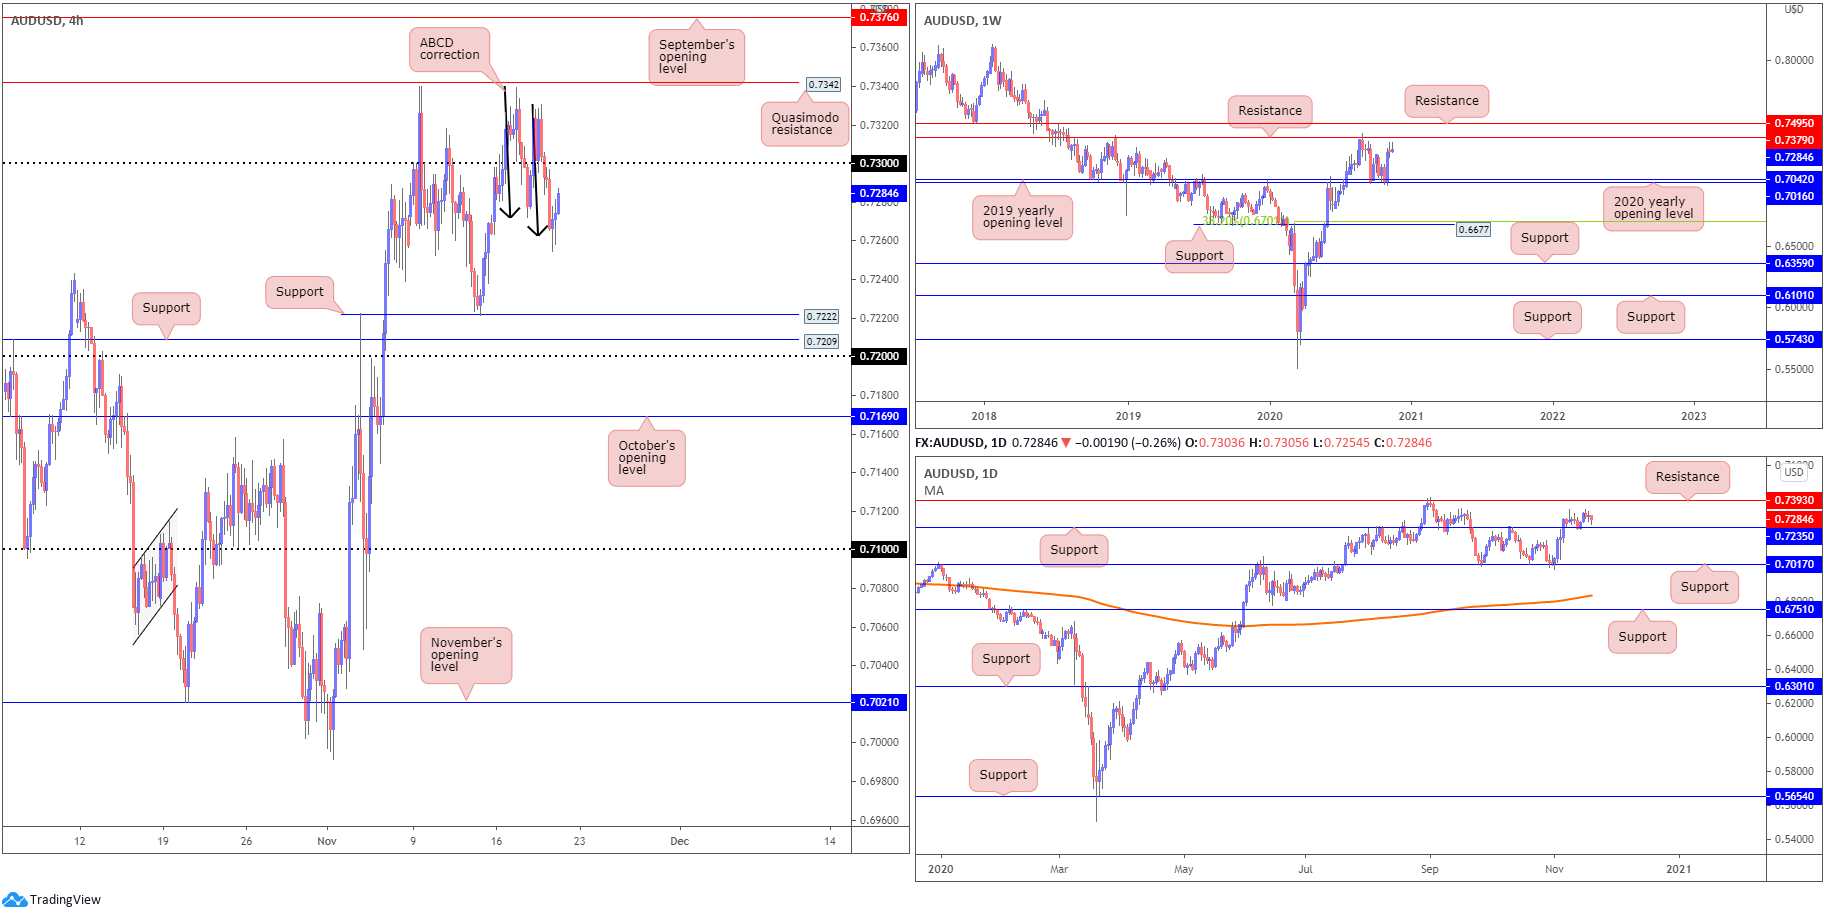
After brushing aside 0.73, AUD/USD made a dive for ABCD support on the H4 scale at 0.7263 (black arrows), with bulls so far reacting favourably. Assuming buyers maintain course into Friday and overpower orders around 0.73, Quasimodo resistance at 0.7342 is next on tap, closely followed by September’s opening value at 0.7376.
From the weekly timeframe, the recent rebound off the 2020 (0.7016) and 2019 (0.7042) yearly opening values (supports), in a market trending higher since early 2020, has price action hovering within striking distance of resistance priced in at 0.7379, and neighbouring resistance at 0.7495.
The possibility of additional bullish flow is strengthened by the retest of support from 0.7235 last week on the daily timeframe, as well as yesterday’s hammer candlestick pattern. This could sweet-talk buyers to attempt to take a run at resistance at 0.7393 (positioned above weekly resistance).
Areas of consideration:
- Buyers long from H4 ABCD support at 0.7263 are in a healthy position, according to higher timeframes, and could see buyers attempt to take on 0.73 and target H4 Quasimodo resistance at 0.7342.
- H4 supports at 0.72, 0.7209 and 0.7222 is an area to be aware of should sellers make an appearance from 0.73.
- Although the trend in this market has faced higher since early 2020, longer-term resistance falls in between weekly resistance at 0.7379 and daily resistance from 0.7393.
USD/JPY:
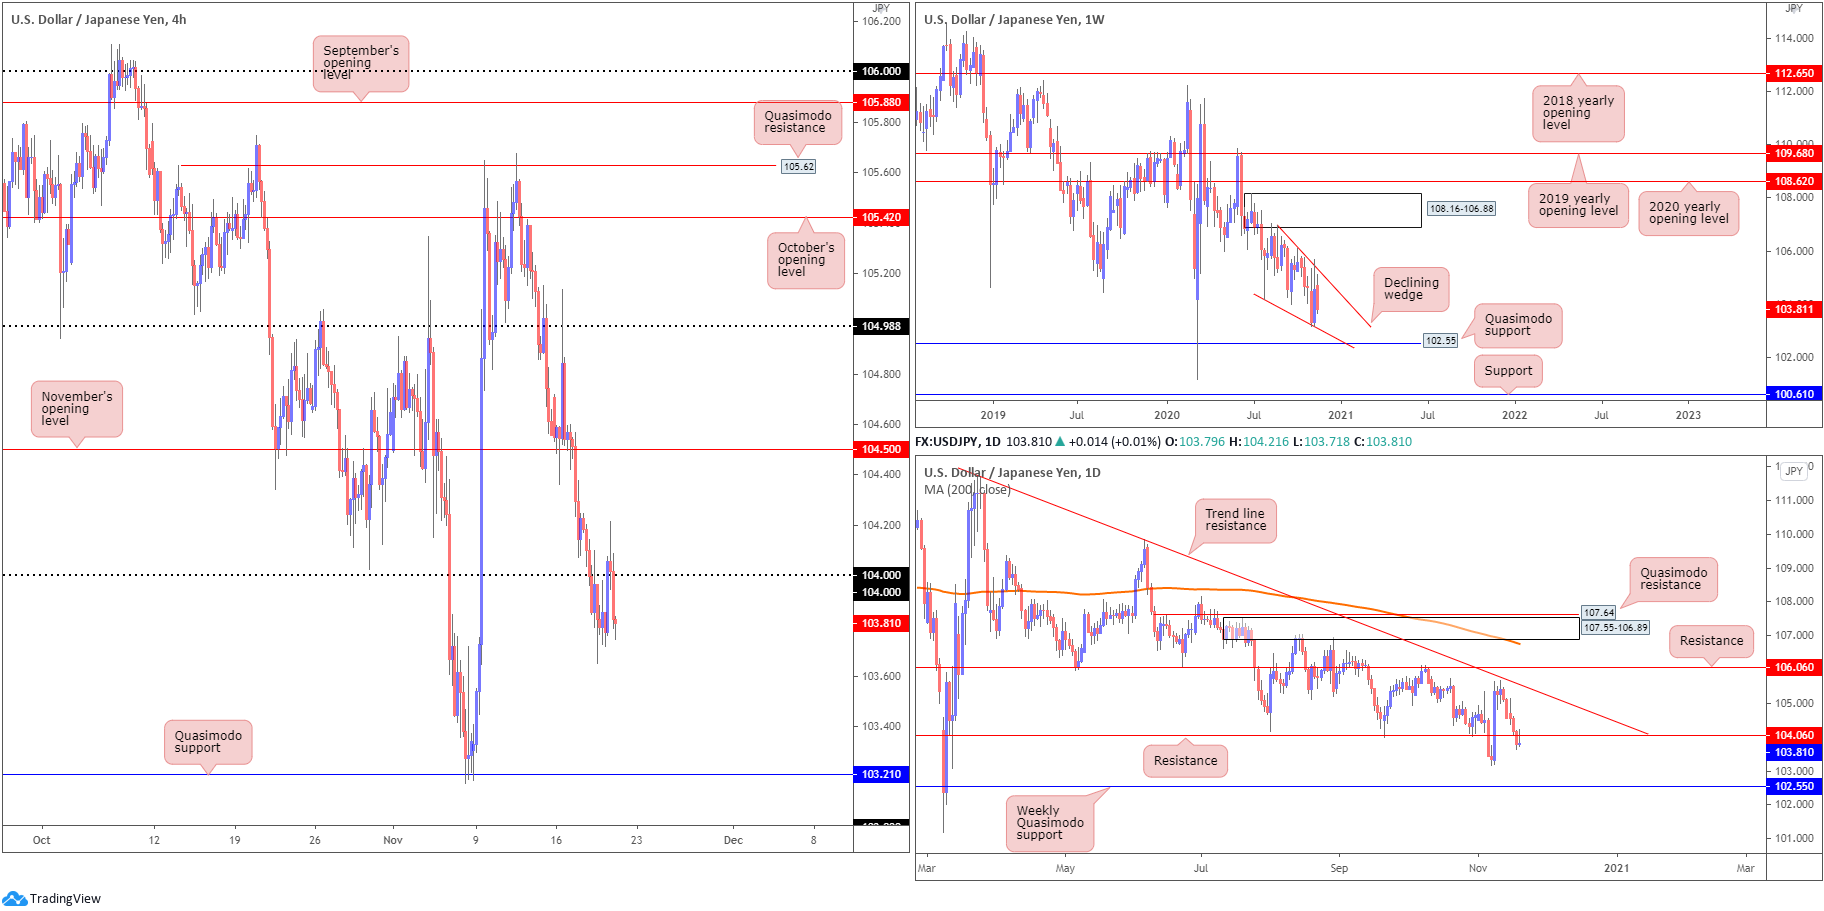
USD/JPY, following five consecutive bearish days, finished off best levels Thursday after a failed attempt to overthrow 104 on the H4 chart. Ultimately, with 104 representing resistance, moves to Quasimodo support at 103.21 will likely be eyed by sellers.
The bearish landscape on the H4 timeframe is echoed on the daily chart, following Wednesday’s break of support at 104.06 and Thursday responding to the underside of the level. Burrowing through this level shines the headlights on weekly Quasimodo support at 102.55.
From the weekly timeframe, since reconnecting with the underside of supply at 108.16-106.88 in August, weekly candles have slowly grinded lower, forming a declining wedge (106.94/104.18). Quasimodo support mentioned above at 102.55 is in view, with a break exposing support plotted at 100.61. A strong bounce from 102.55 may provide enough impetus for buyers to attempt a breakout above the current declining wedge.
Areas of consideration:
- Bearish scenarios south of 104 remain on the table, targeting H4 Quasimodo support at 103.21.
USD/CAD:
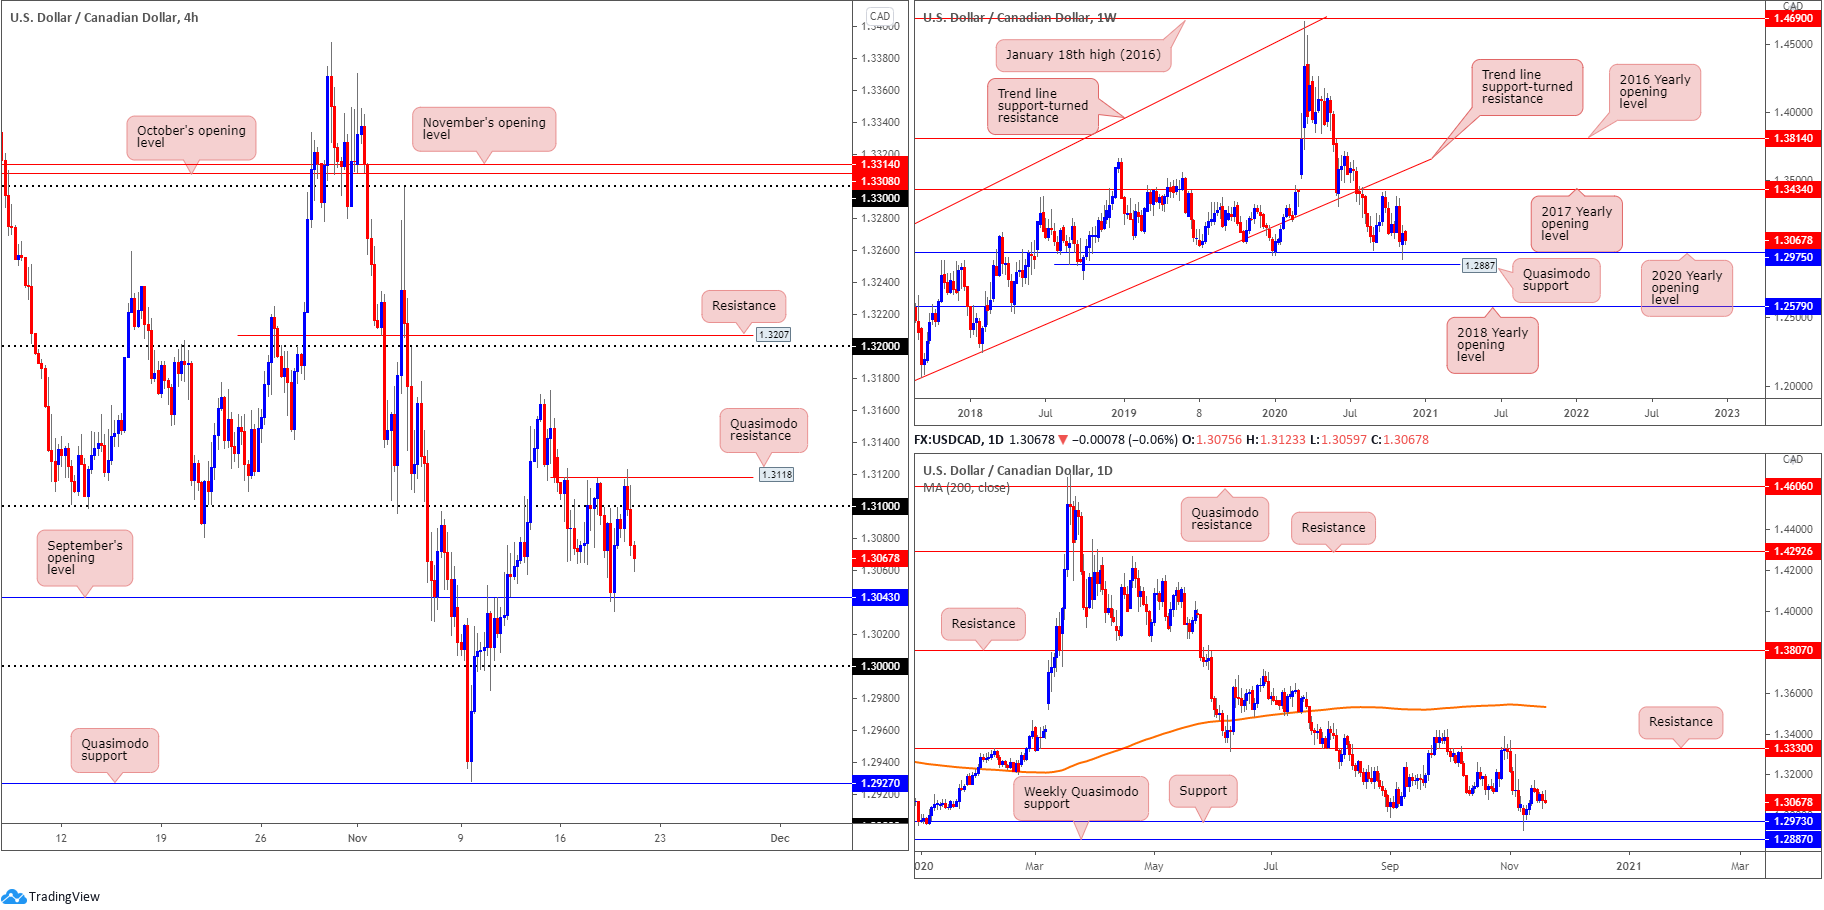
A micro Quasimodo resistance level at 1.3118 on the H4 scale has proven a stubborn area to overpower, located just above the 1.31 handle. With sellers rebounding from 1.3118 in recent trading, September’s opening value calls for attention at 1.3043, with a break exposing the key figure 1.30.
The 2020 yearly opening value at 1.2975 on the weekly timeframe, arranged north of a Quasimodo support priced in at 1.2887, triggered a wave of buying last week, closing modestly off best levels. Given this market has traded lower since topping at 1.4667 in early 2020, breaking the aforementioned supports also remains an option, consequently swinging the pendulum in favour of further weakness towards the 2018 yearly opening value at 1.2579. Additional interest to the upside, nevertheless, could eventually fuel a test of the 2017 yearly opening value at 1.3434, covered under trend line support-turned resistance, taken from the low 1.2061.
With weekly price rebounding from support at 1.2975 as well as daily price also recently coming off support at 1.2973 (essentially marking the same area), flow on the daily chart, despite lacklustre movement of late, reveals room to rally as far north as 1.3330.
Areas of consideration:
- A H4 close north of 1.31 may interest breakout buyers. Reinforced on the back of higher timeframe supports, buyers may look to lift the pair towards the 1.3172 November 13 high, followed by 1.32. Conservative traders may seek a 1.31 retest before pulling the trigger.
- Buyers may also show interest off September’s opening value at 1.3043 and also the 1.30 level should we reach this far south today.
USD/CHF:
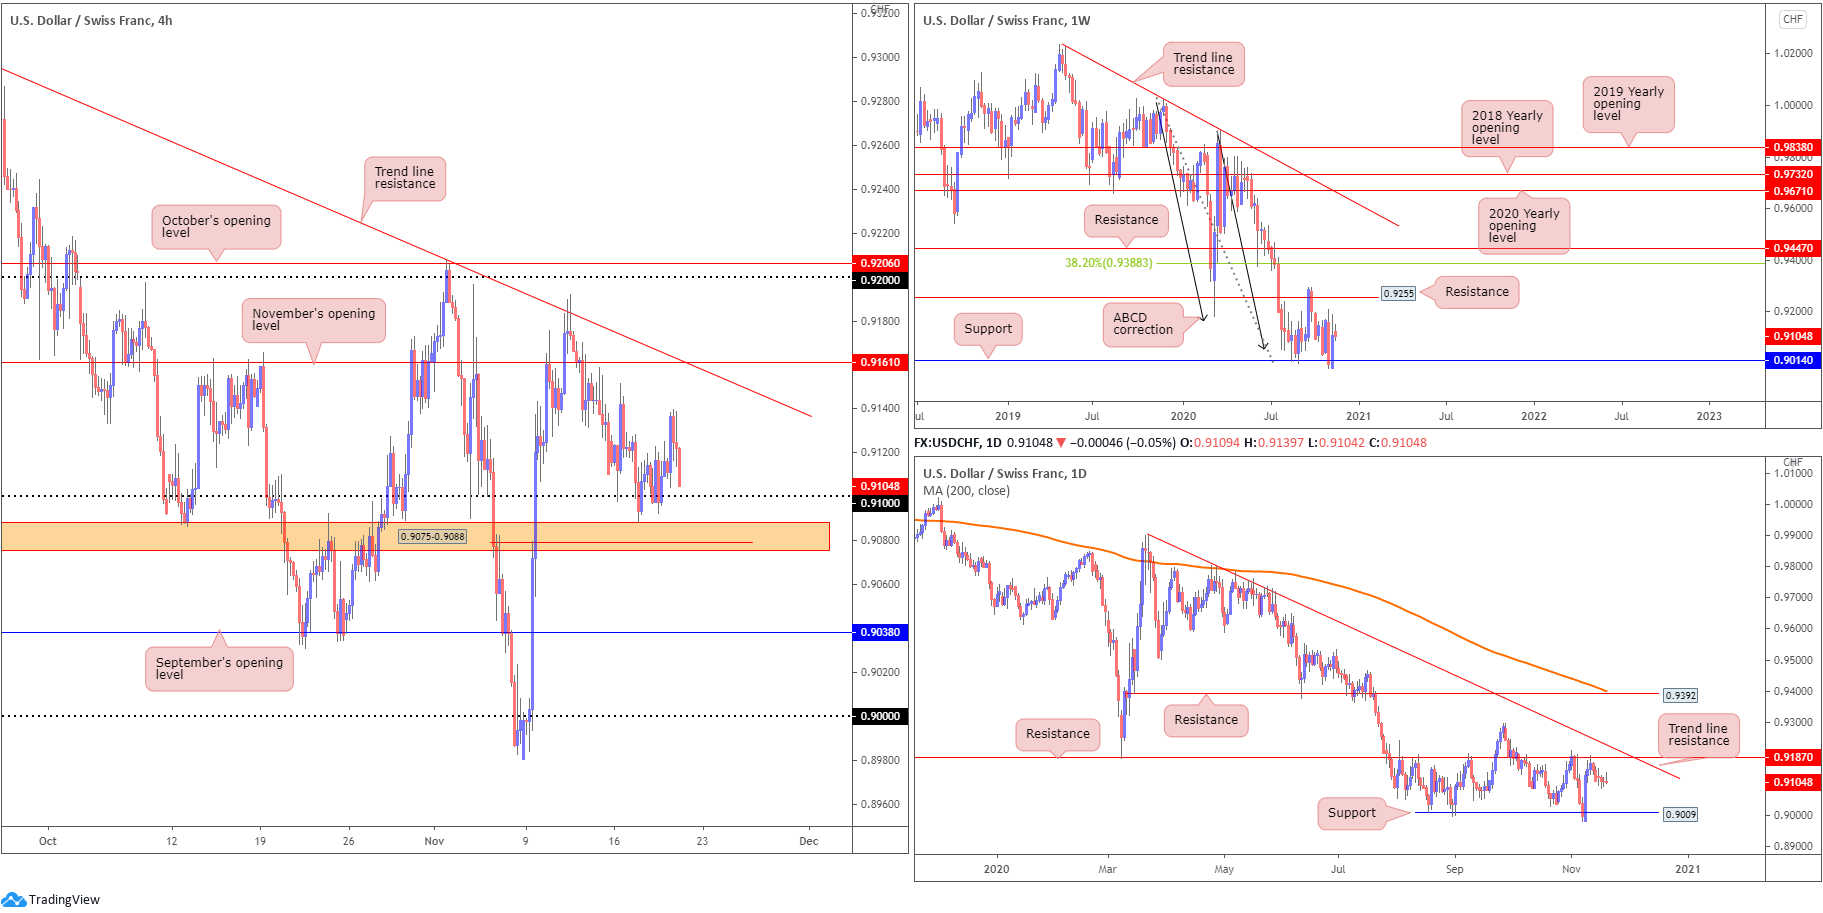
Buyers struggled to retain position Thursday (leaving trend line resistance, taken from the high 0.9295, and November’s opening value at 0.9161, unchallenged), with recent hours sparking strong selling off session peaks amidst broad dollar softness – DXY below 92.50. This swings the 0.91 handle back in view, a level located above an area of support at 0.9075-0.9088. Removing the aforementioned areas today unearths possible selling in the direction of September’s opening value at 0.9038 and a key psychological figure at 0.90.
The weekly timeframe reveals buyers entered a reasonably heavy bid off support at 0.9014 last week, a level dovetailing closely with ABCD support at 0.9051 (black arrows). 0.9255 resistance (a prior Quasimodo support) is next in the firing range should buyers continue to support this market, with a 38.2% Fibonacci retracement ratio forged at 0.9388 to target should further buying emerge (an initial take-profit target associated with the ABCD support mentioned above). It should also be noted that this market has been trending lower since April 2019.
From the daily timeframe, however, we are, following a decisive recovery off Quasimodo support at 0.9009, languishing beneath resistance at 0.9187. Beyond the latter, assuming weekly players eventually push higher, traders may recognise nearby trend line resistance, taken from the high 0.9901, which happens to merge closely with weekly resistance mentioned above at 0.9255.
Areas of consideration:
- 91/H4 support at 0.9075-0.9088 is an area buyers may be watching for bullish themes today.
- Bearish scenarios may arise should 0.9075-0.9088 cede ground.
Dow Jones Industrial Average:
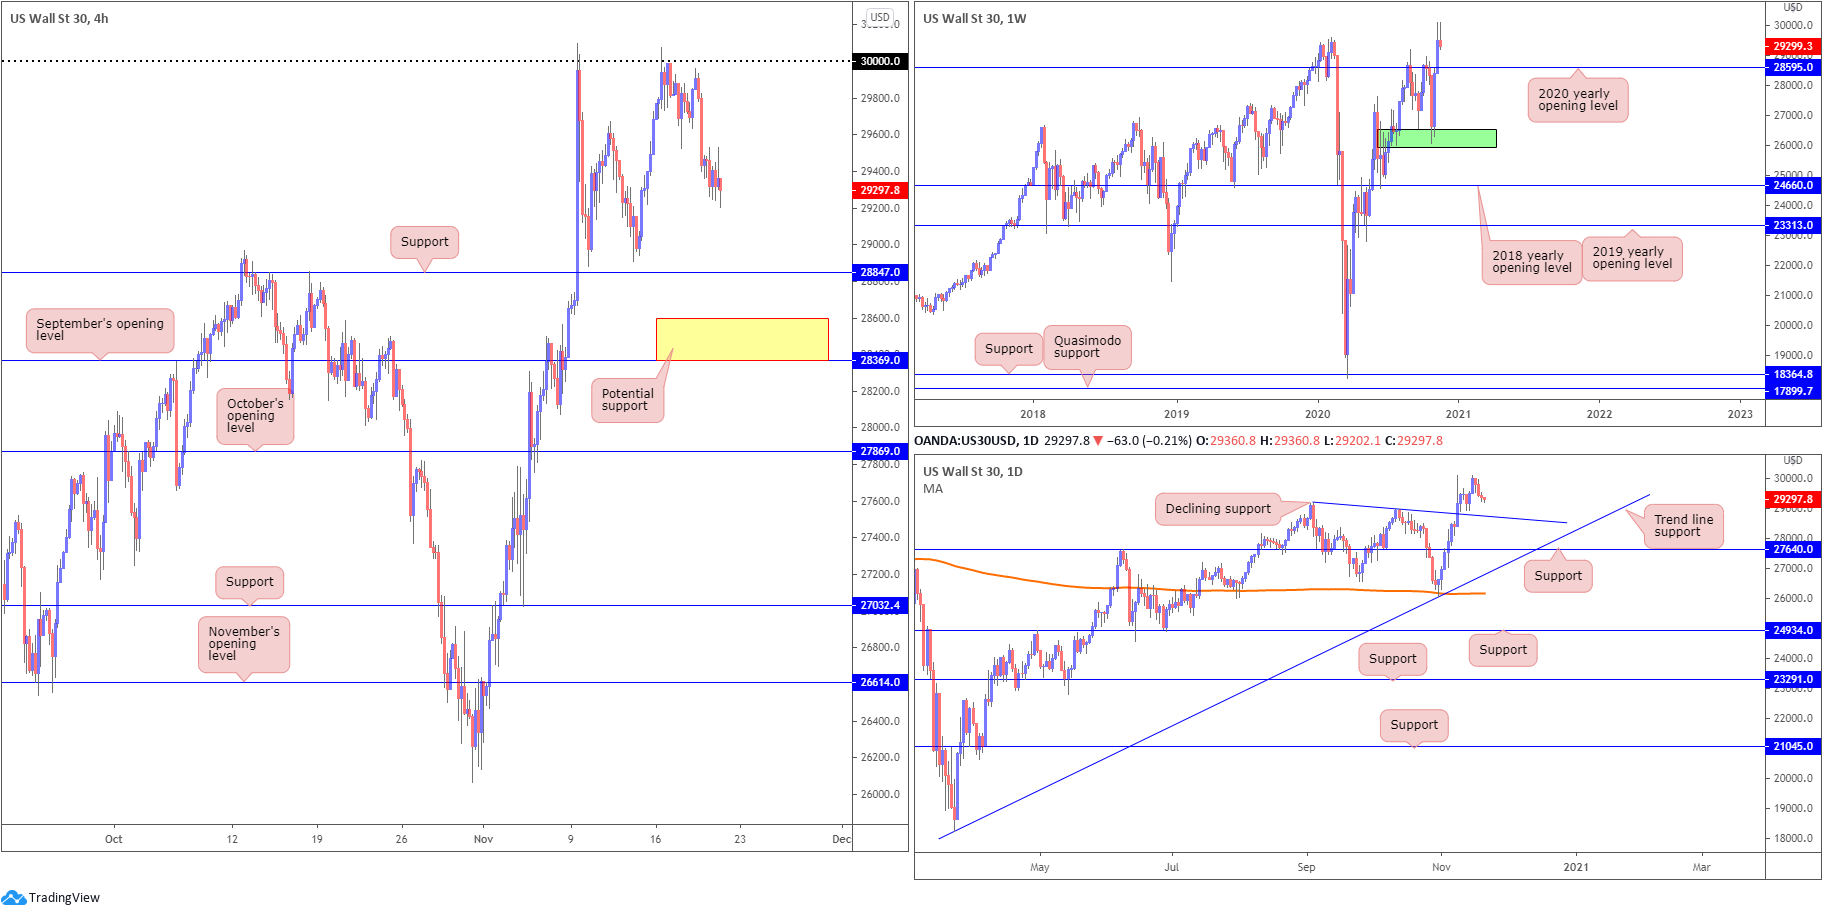
Kicking things off from the top this morning, traders will acknowledge the Dow trades off all-time peaks at 30097, with the current weekly candle on track to produce a shooting star formation. In itself, this may inspire a retest at the 2020 yearly opening value from 28595.
A closer reading of price action on the daily timeframe reveals the unit could confront declining support, taken from the high 29193. Should a break of here come to pass, support at 27640 is seen, closely followed by trend line support, etched from the low 18213.
The Dow Jones Industrial Average climbed 44.81 points, or 0.15%, the S&P 500 traded higher by 14.08 points, or 0.39%, and the Nasdaq also ended higher by 103.11 points, or 0.87%. Technically on the H4 scale, however, the 30000 level represents resistance while 28847 continues to represent support. A break lower exposes September’s opening value at 28369.
Areas of consideration:
- Forming fresh all-time highs, as highlighted in recent analysis, will likely excite buyers.
- September’s opening value at 28369, alongside the 2020 yearly opening value from 28595 and daily declining support (29193), forms interesting support to be mindful of (yellow H4).
XAU/USD (GOLD):
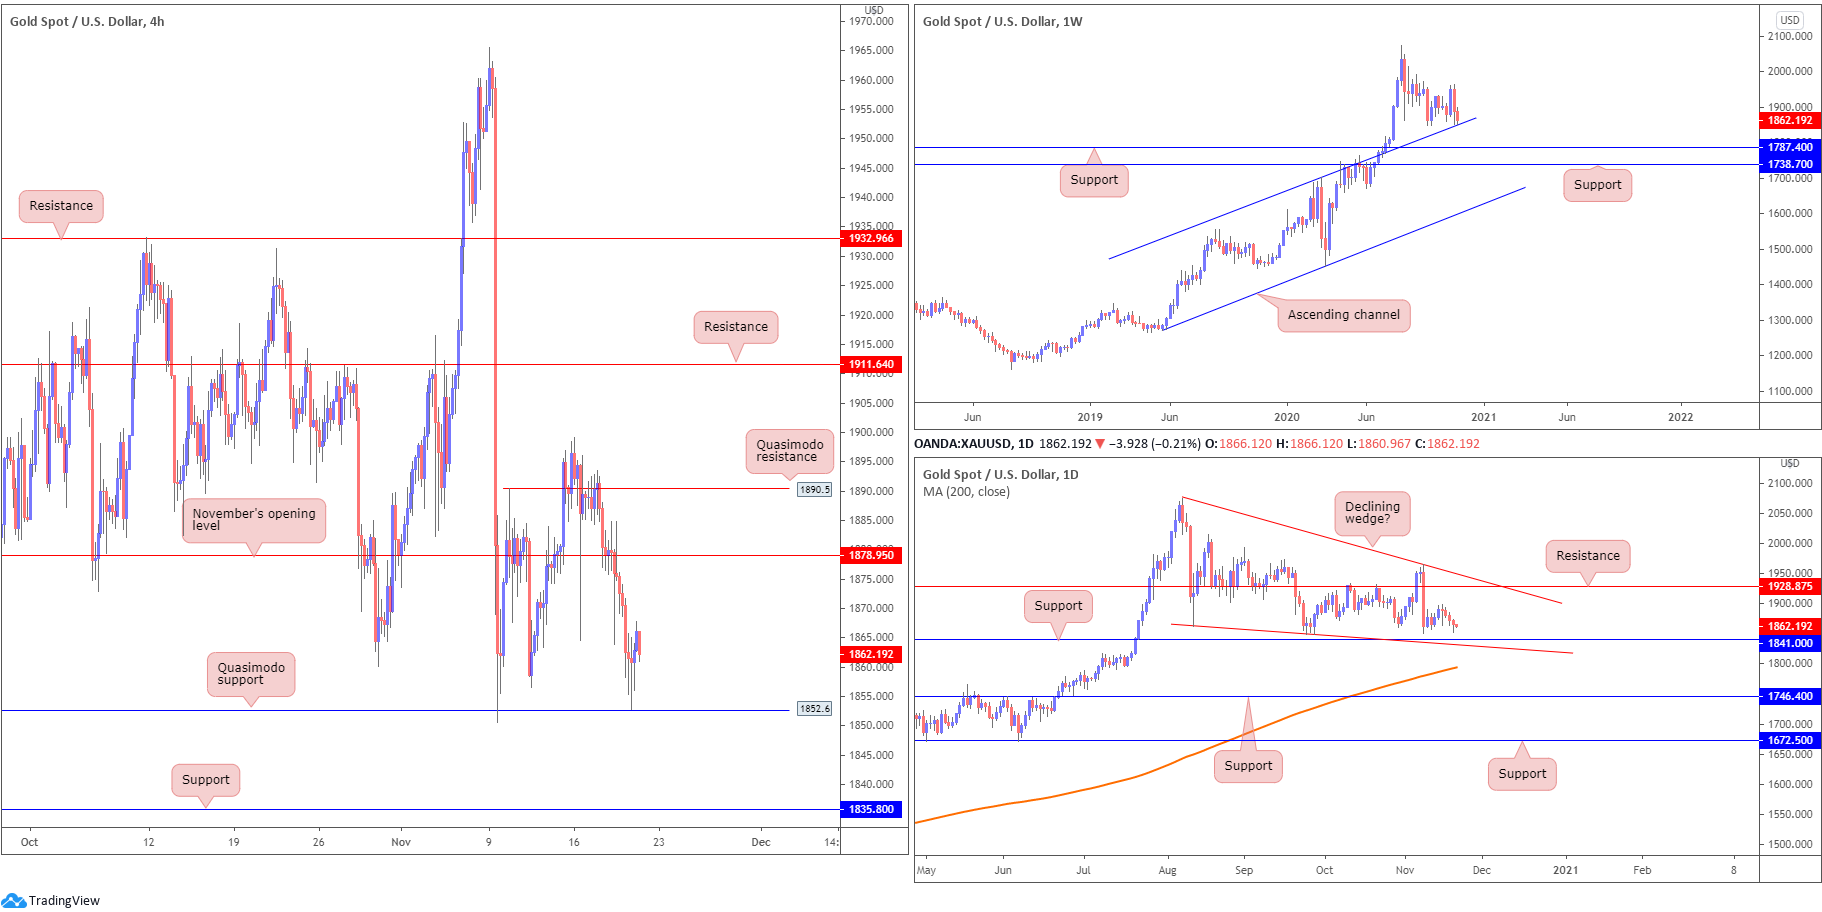
Spot gold decline for a fourth consecutive session against the dollar Thursday, though finished significantly off worst levels, aided by Quasimodo support on the H4 scale at $1,852. The rebound from this angle has likely caught the interest of buyers for two reasons. First, despite the current correction gold is in right now, the primary uptrend remains intact and, secondly, weekly price is treading water just north of channel resistance-turned support, taken from the high $1,703.
In addition to the above, daily price is seen hovering above support coming in at $1,841. Another feature worth highlighting on the daily chart is a possible falling wedge pattern between $2,075/$1,862.
Areas of consideration:
- Although H4 Quasimodo support from $1,852 recently delivered buyers a platform to work with, a modest fakeout could be seen to entice buyers from weekly channel support nearby.
- H4 support priced in at $1,835 is another level to be aware of, having seen the line merge closely with daily support at $1,841.
The accuracy, completeness and timeliness of the information contained on this site cannot be guaranteed. IC Markets does not warranty, guarantee or make any representations, or assume any liability regarding financial results based on the use of the information in the site.
News, views, opinions, recommendations and other information obtained from sources outside of www.icmarkets.com.au, used in this site are believed to be reliable, but we cannot guarantee their accuracy or completeness. All such information is subject to change at any time without notice. IC Markets assumes no responsibility for the content of any linked site.
The fact that such links may exist does not indicate approval or endorsement of any material contained on any linked site. IC Markets is not liable for any harm caused by the transmission, through accessing the services or information on this site, of a computer virus, or other computer code or programming device that might be used to access, delete, damage, disable, disrupt or otherwise impede in any manner, the operation of the site or of any user’s software, hardware, data or property


