
DXY:
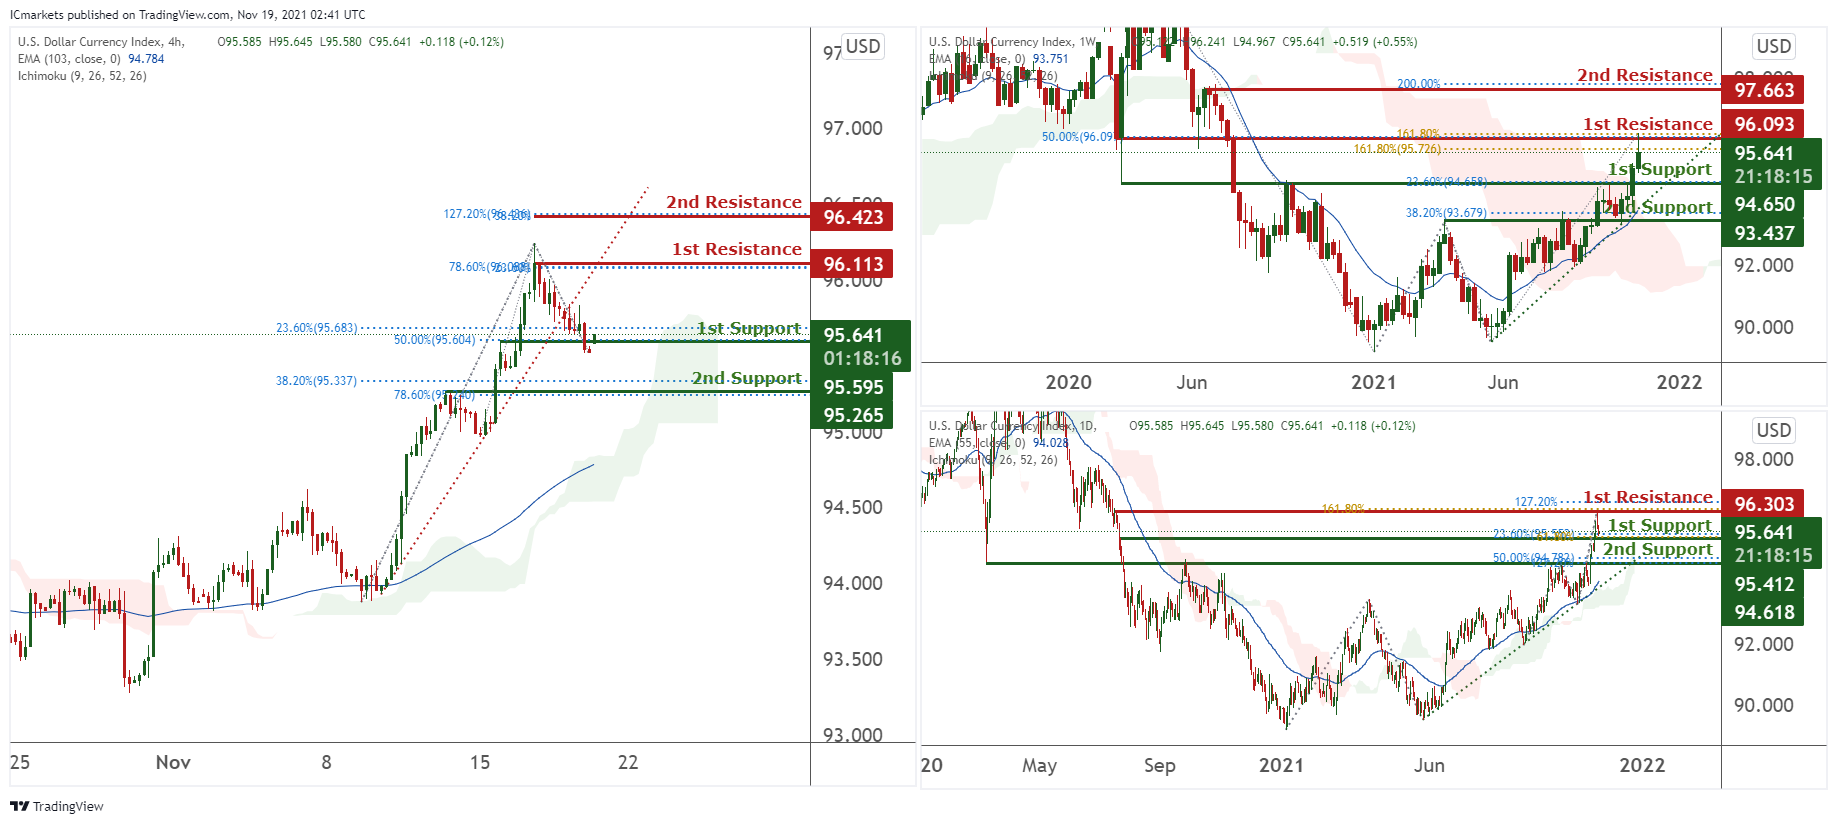
On the weekly, prices are on a bullish momentum and abiding to our ascending trendline. We see potential for a short pullback towards our 1st support at 94.650 in line with 38.2% Fibonacci retracement and graphical overlap. Technical indicators are showing bearish momentum.
On the daily, prices have recently tested our 1st resistance at 96.303 in line with 127.2% and 161.8% Fibonacci projection. We see potential for a short pullback from 1st resistance towards our 1st support at 95.412 which is an area of Fibonacci confluences.
On the H4 timeframe, prices have recently broken out of our ascending trendline but are still on a bullish momentum. We see potential for prices to retest our bullish trendline at 1st resistance at 96.113 in line with 78.6% Fibonacci retracement from our 1st support at 95.595 in line with 50% and 23.6% Fibonacci retracement. Technical indicators are at a level where bounces happened previously. Alternatively, breaking our 1st support might find prices dip towards our 2nd support at 95.265 in line with 38.2% and 78.6% Fibonacci retracement.
Areas of consideration:
- H4 time frame, 1st resistance at 96.113
- H4 time frame, 1st support at 95.595
XAU/USD (GOLD):
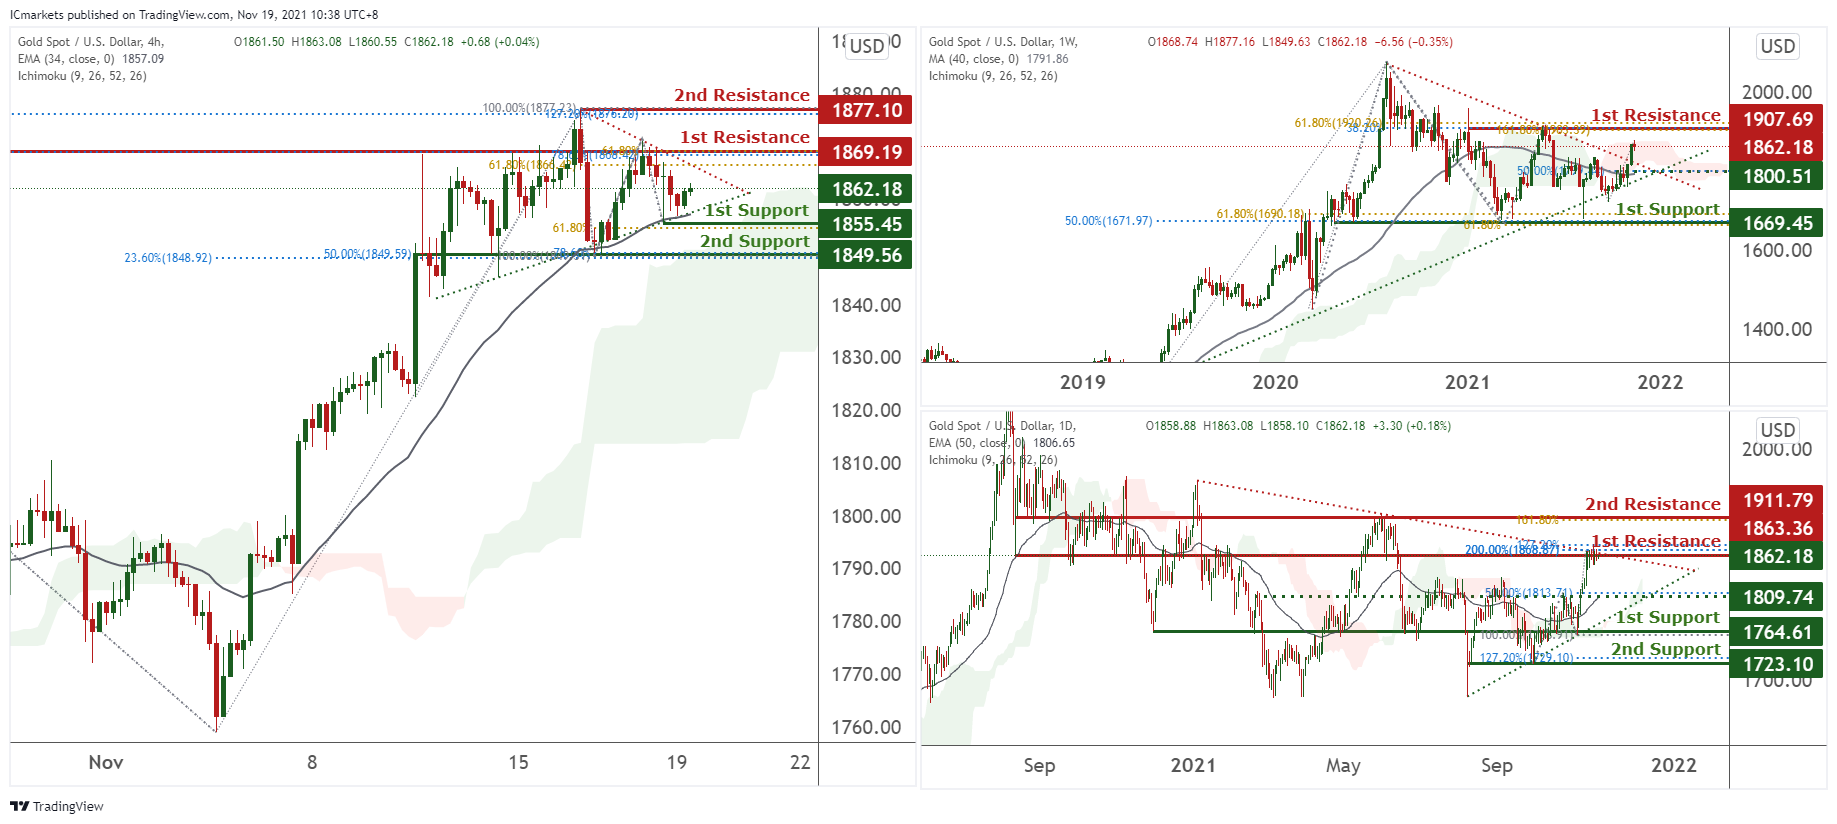
On the weekly, prices have broken out of our triangle and are on a bullish momentum. We see potential for prices to climb higher towards our 1st resistance at 1907.69 which is an area of Fibonacci confluences. Technical indicators are showing bullish momentum.
On the daily, prices are consolidating in a triangle and are hovering at our 1st resistance at 1863.36 which is an area of Fibonacci confluences.We see potential for a dip towards our intermediate support at 1809.74. However, as technical indicators are showing mixed signals, we prefer to remain neutral for now.
On the H4 chart, prices are consolidating in a triangle. We see potential for a bounce from our 1st support at 1855.45 in line with 61.8% FIbonacci extension towards our 1st resistance at 1869.19 which is an area of Fibonacci confluences. Breaking that level may find prices climbing higher towards our 2nd resistance at 1877.10. Technical indicators are showing bullish momentum.
Areas of consideration:
- 4h 1st support at 1855.45
- 4h 1st resistance at 1869.19
EUR/USD:
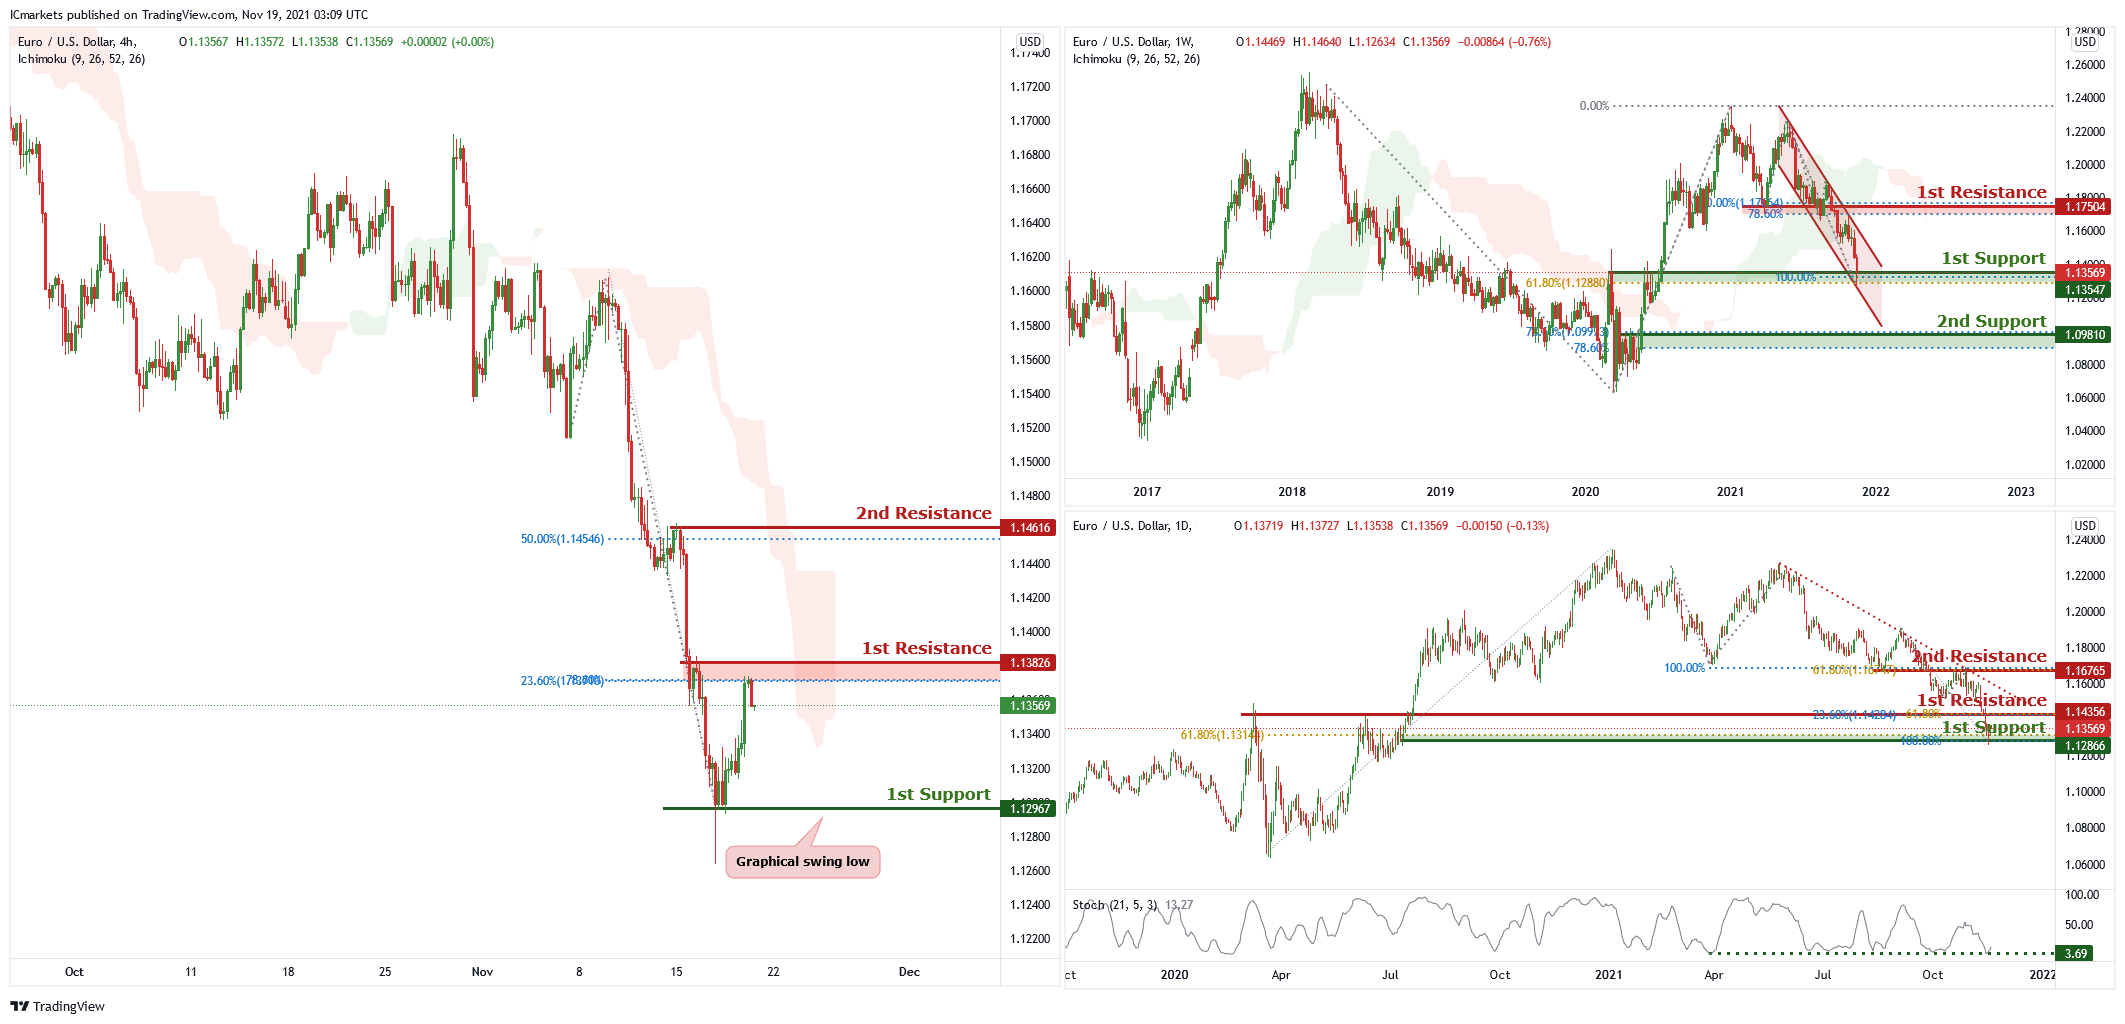
On the weekly chart price is trading in a descending channel and near the first support level of 1.13547 which is also 100% Fibonacci projection and 61.8% Fibonacci retracement. Price can potentially dip to the 2nd support level which is also 78.6% Fibonacci projection and 78.6% Fibonacci retracement. Our bearish bias is supported by the ichimoku cloud indicator.
On the daily chart , price is trading on a descending trendline and is near the first support level of 1.12866 which is 100% Fibonacci projection and 61.8% Fibonacci retracement. Price can potentially bounce from the first support level to the first resistance of 1.14356 which is 23.6% Fibonacci retracement and 61.8% Fibonacci projection. Our bullish bias is supported by the stochastic indicator as it is near support level.
On the H4 chart price is near the first resistance of 1.13286 which is also 23.6% Fibonacci retracement and 78.6% Fibonacci projection. Price can potentially dip to the first support level of 1.12967 which is also a graphical swing low. Our bearish bias is supported by the ichimoku cloud indicator as price is trading under it.
Areas of consideration:
H4 first support – 1.121967
H4 first resistance – 1.13826
USD/CHF:
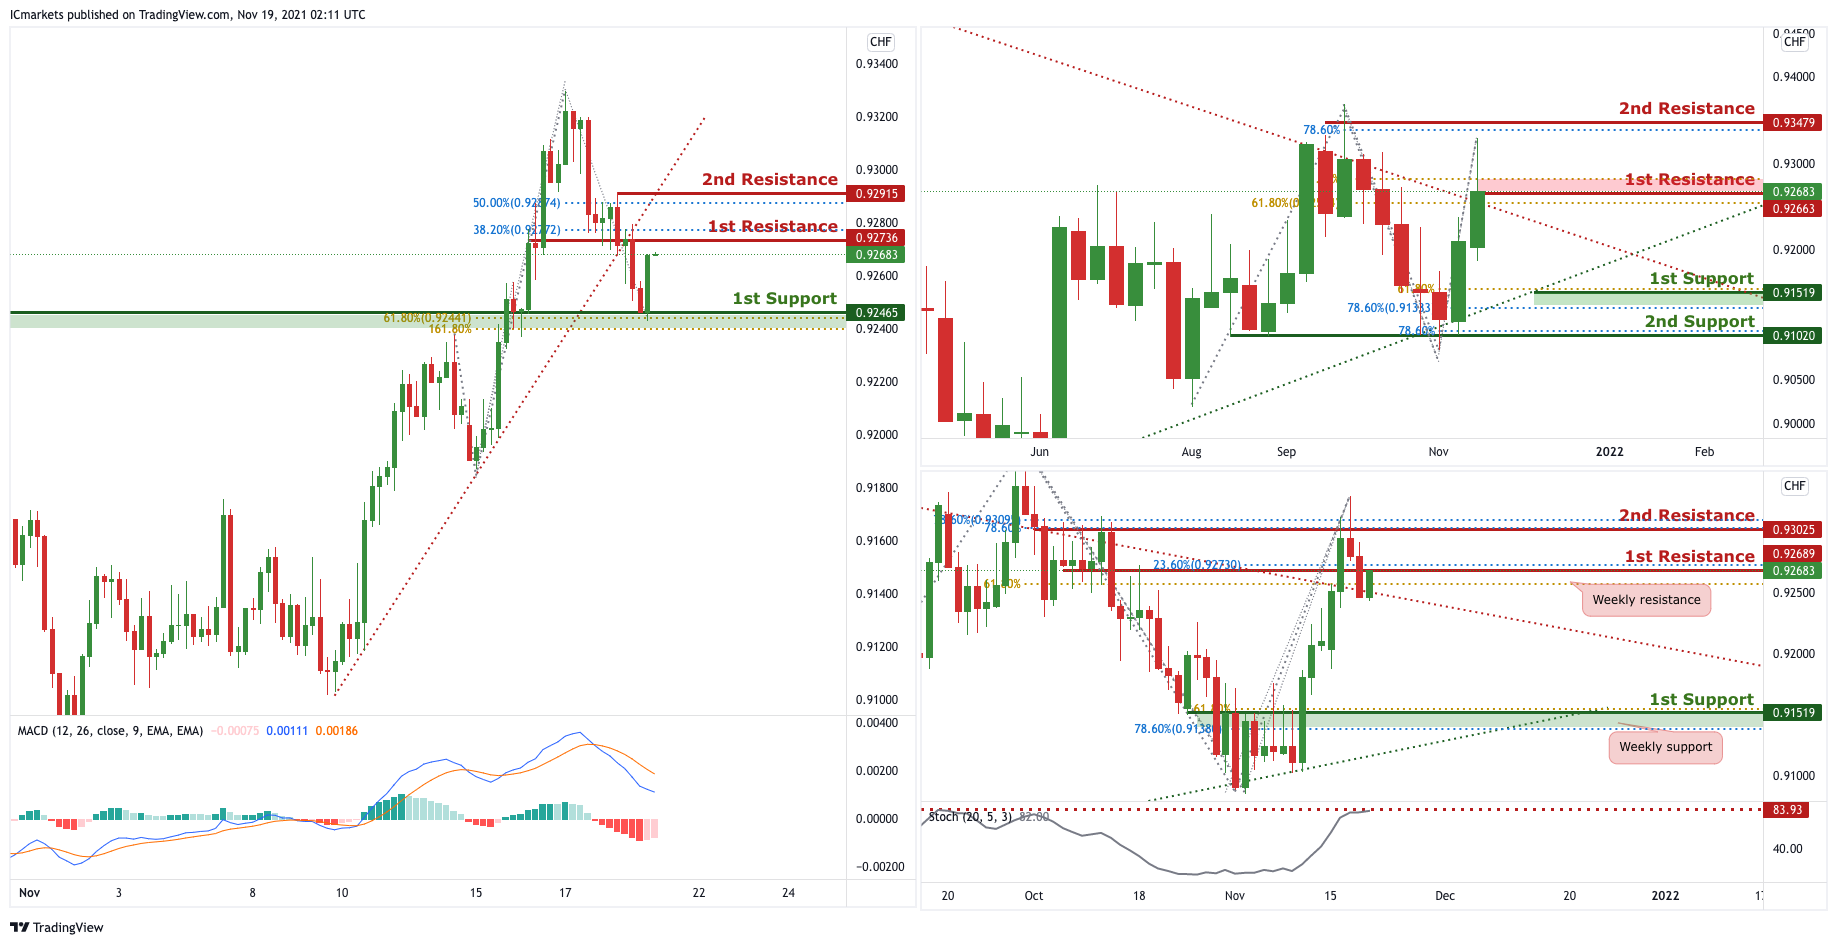
In reference to last week’s analysis price indeed pushed up to the 1st Resistance. On the Weekly timeframe, we can see that price is reacting in a triangle formation and price is currently getting squeezed. Traders can wait for the price to swing higher or lower as the break out of the triangle.On the Daily timeframe, we can expect price to drop from the 1st Resistance in line with 23.6% Fibonacci retracement and 61.8% Fibonacci projection towards 1st Support in line with 78.6% Fibonacci retracement and 61.8% Fibonacci projection.Our bearish bias is further supported by the stochastic indicator where the %K line is approaching the resistance level.
On the H4 timeframe,price indeed dropped and is reaching 1st Resistance. We can now expect price would drop from the 1st Resistance in line with 38.2% Fibonacci retracement towards 1st Support in line with 76.8% Fibonacci retracement and 161.8% Fibonacci projection. Our bearish bias is further supported by MACD indicator where the signal line crosses above the MACD line.
Areas of consideration:
- Watch 1st Support at 0.92465
- Watch 1st Resistance at 0.92736
GBP/USD:
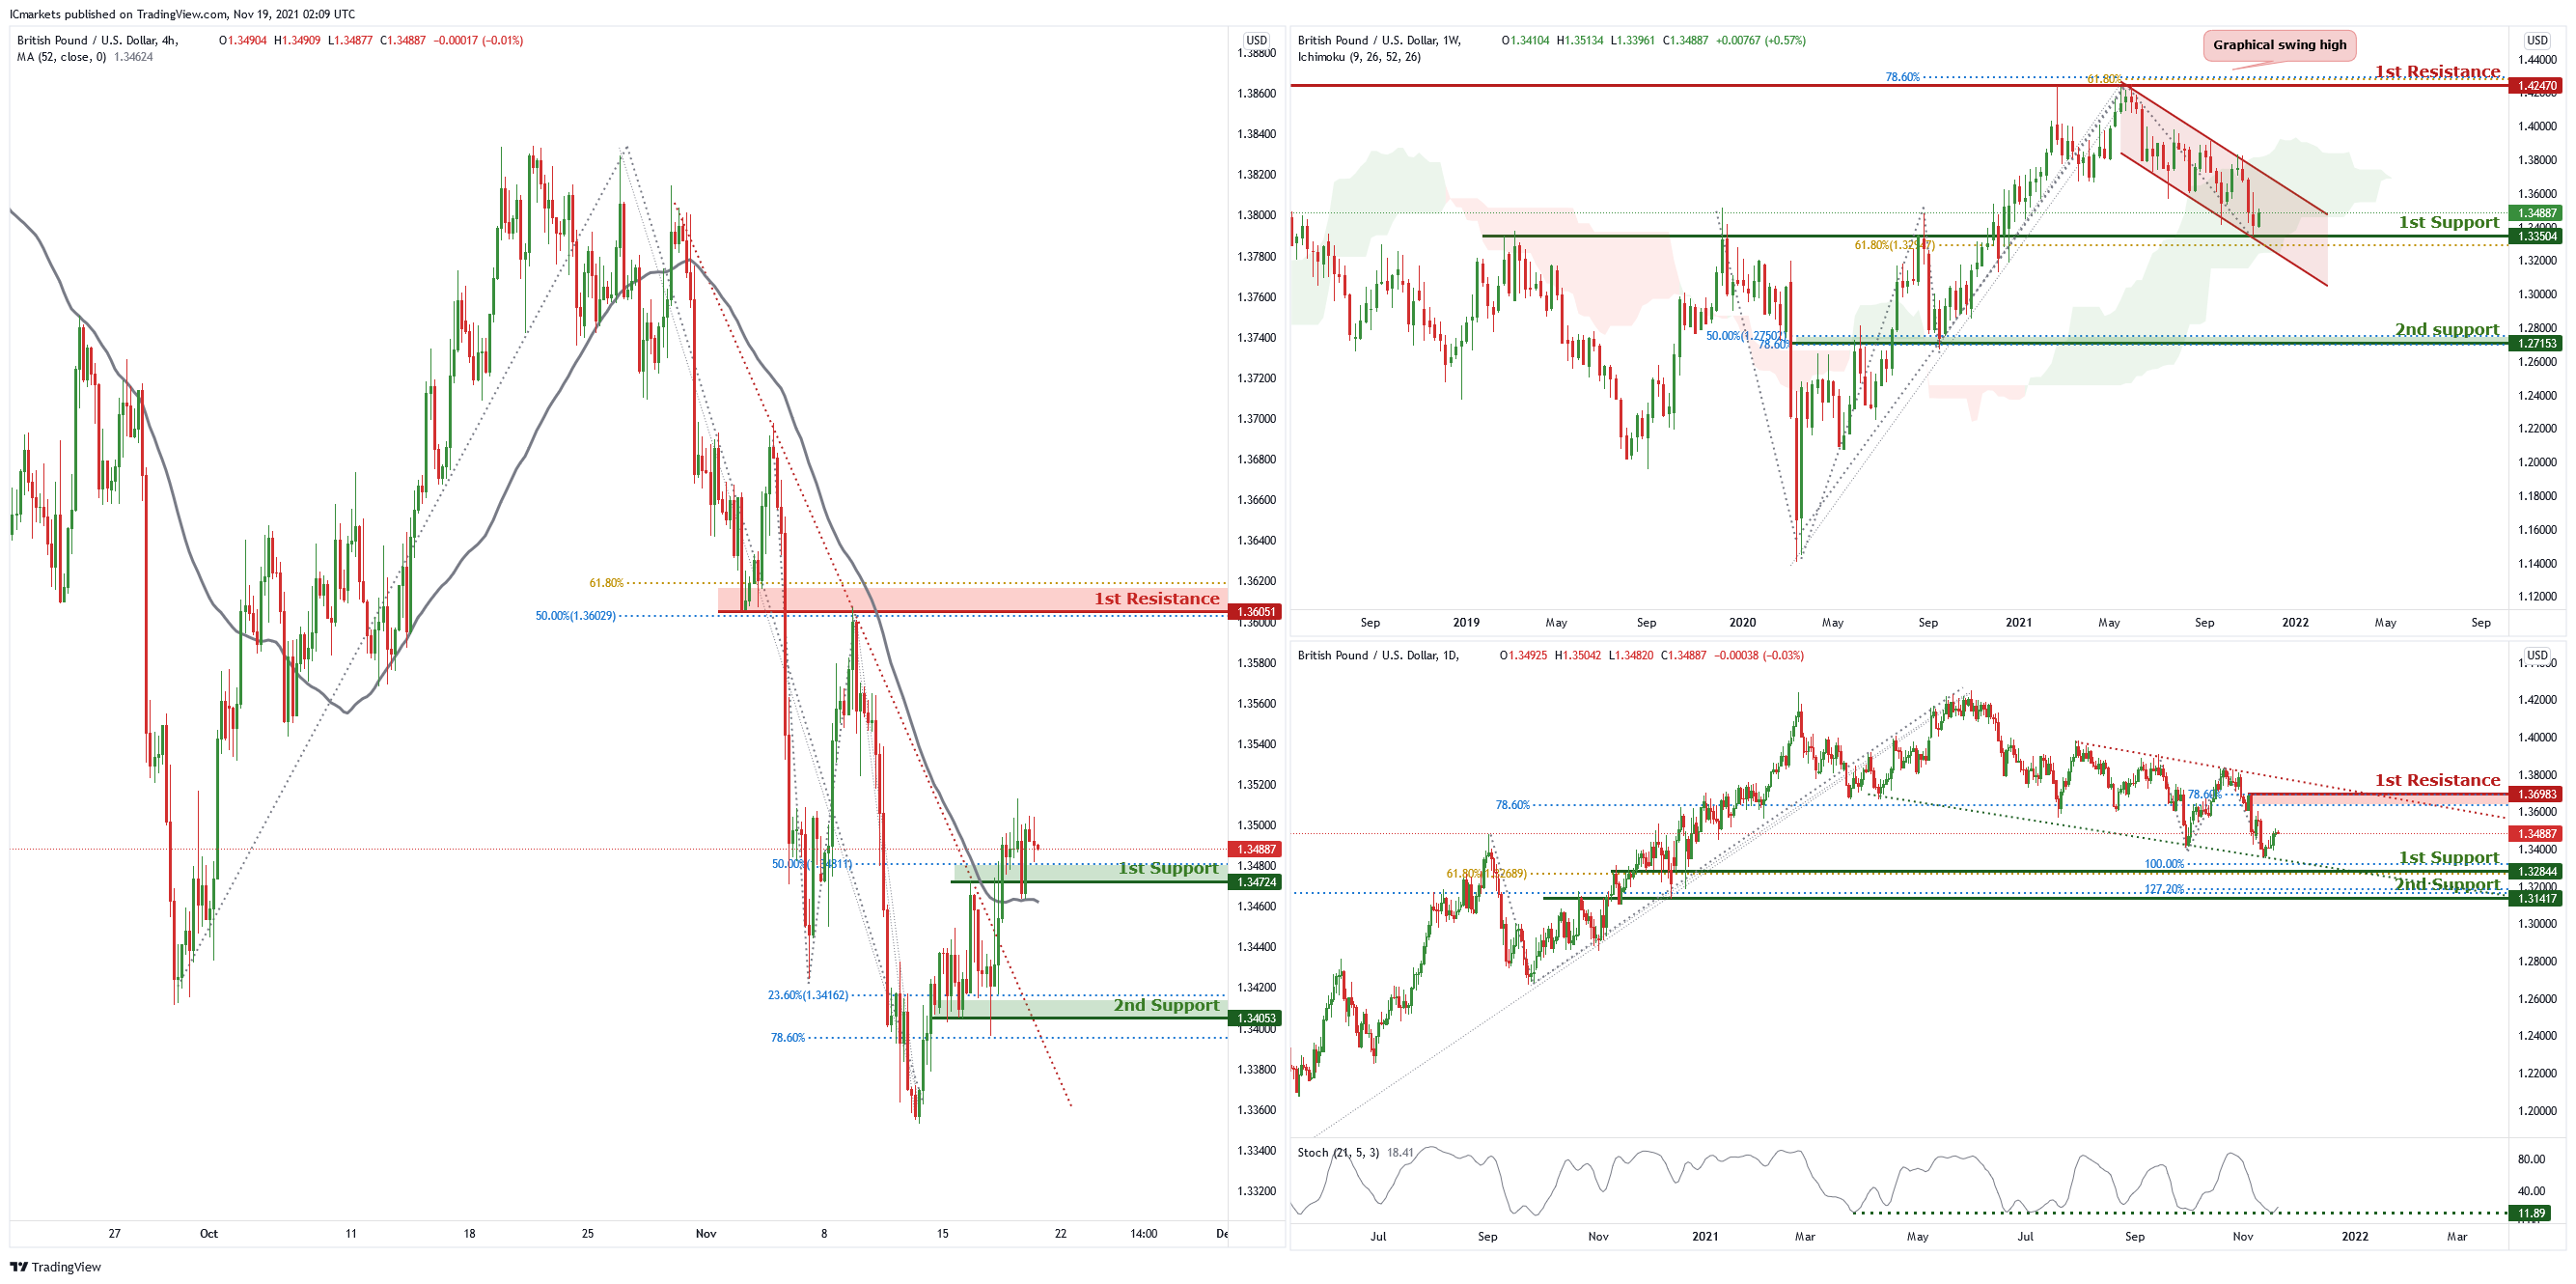
On the weekly chart price is trading in a descending channel and is near the first support level of 1.33504 which is also 61.8% Fibonacci retracement. Price can potentially bounce from this level to the first resistance of 1.42470 which is also the graphical swing high. The first resistance is also Fibonacci retracement of 61.8% and Fibonacci projection of 78.6%. Our bullish bias is supported by the ichimoku cloud indicator.
On the daily chart , price has recently bounced from the first support level of 1.32844 which is also 100% Fibonacci projection and 61.8% Fibonacci retracement. Price can potentially go to the first resistance of 1.36983 which is also 78.6% Fibonacci retracement and 78.6% Fibonacci projection. Our bullish bias is supported by stochastic as it is near the support level.
On the H4 chart , price has recently broken out of the descending trendline and is near the first support of 1.34724 which is also 50% Fibonacci retracement. Price can potentially go to the first resistance of 1.36051 which is 61.8% Fibonacci projection and 50% Fibonacci retracement. Our bullish bias is supported by the moving average as price is trading above it.
Areas of consideration :
H4 first resistance – 1.36051
H4 first support – 1.34724
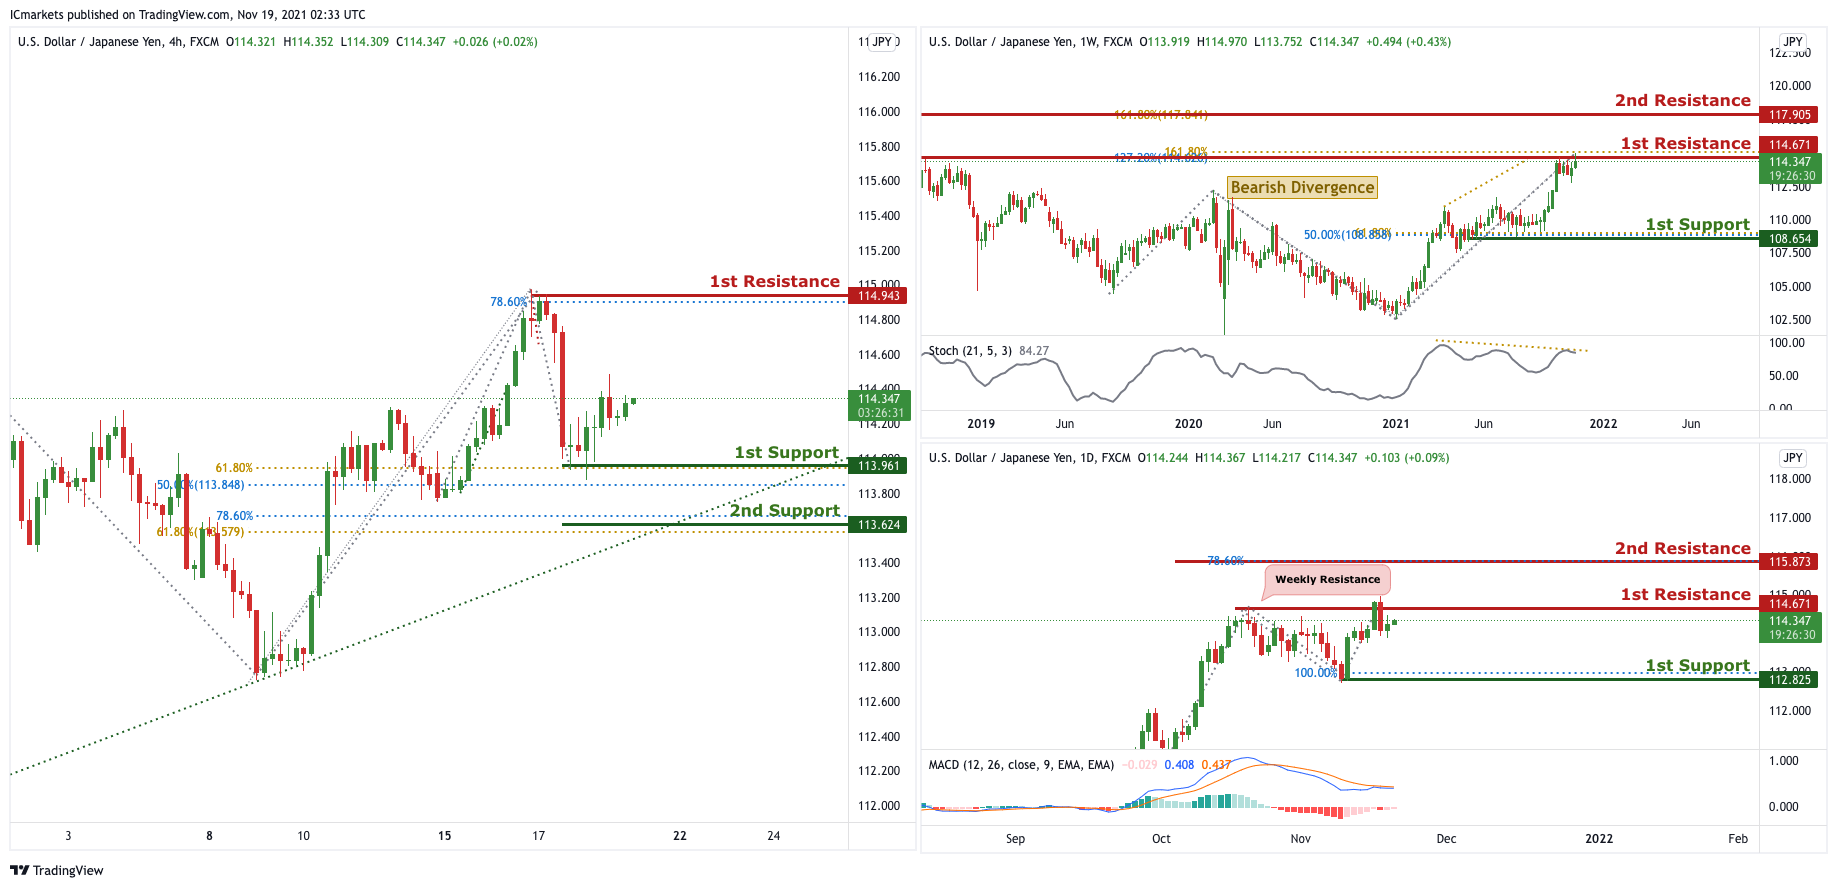
USD/JPY :
On the Weekly timeframe, we can see that price is approaching the 1st resistance in line with horizontal swing highs and 127.2% FIbonacci Retracement and 161.8% Fibonacci Projection. We can expect the price to drop from the 1st Resistance towards the 1st Support in line with 61.8% Fibonacci projection and 50% Fibonacci retracement. Our short-term bearish momentum is further supported by the stochastic %K line holding below the descending trendline resistance and bearish divergence spotted. On the Daily timeframe, in reference to last week’s analysis, price indeed bounced from the 1st Support. We can now expect price to drop from 1st Resistance in line with the previous swing high and weekly resistance toi the 1st Support in line with 100% Fibonacci projection. Our short-term bearish bias is further supported by the MACD indicator where signal line is above the MACD line.
On the H4 timeframe, price bounced from the 1st Support in line with 50% Fibonacci retracement and 61.8% Fibonacci projection. Now, price is currently in the middle of 1st Resistance and 1st Support hence, traders can wait for price to swing higher or swing lower before entering.
Areas of consideration:
- H4 1st resistance level 114.943
- H4 1st support level 113.961
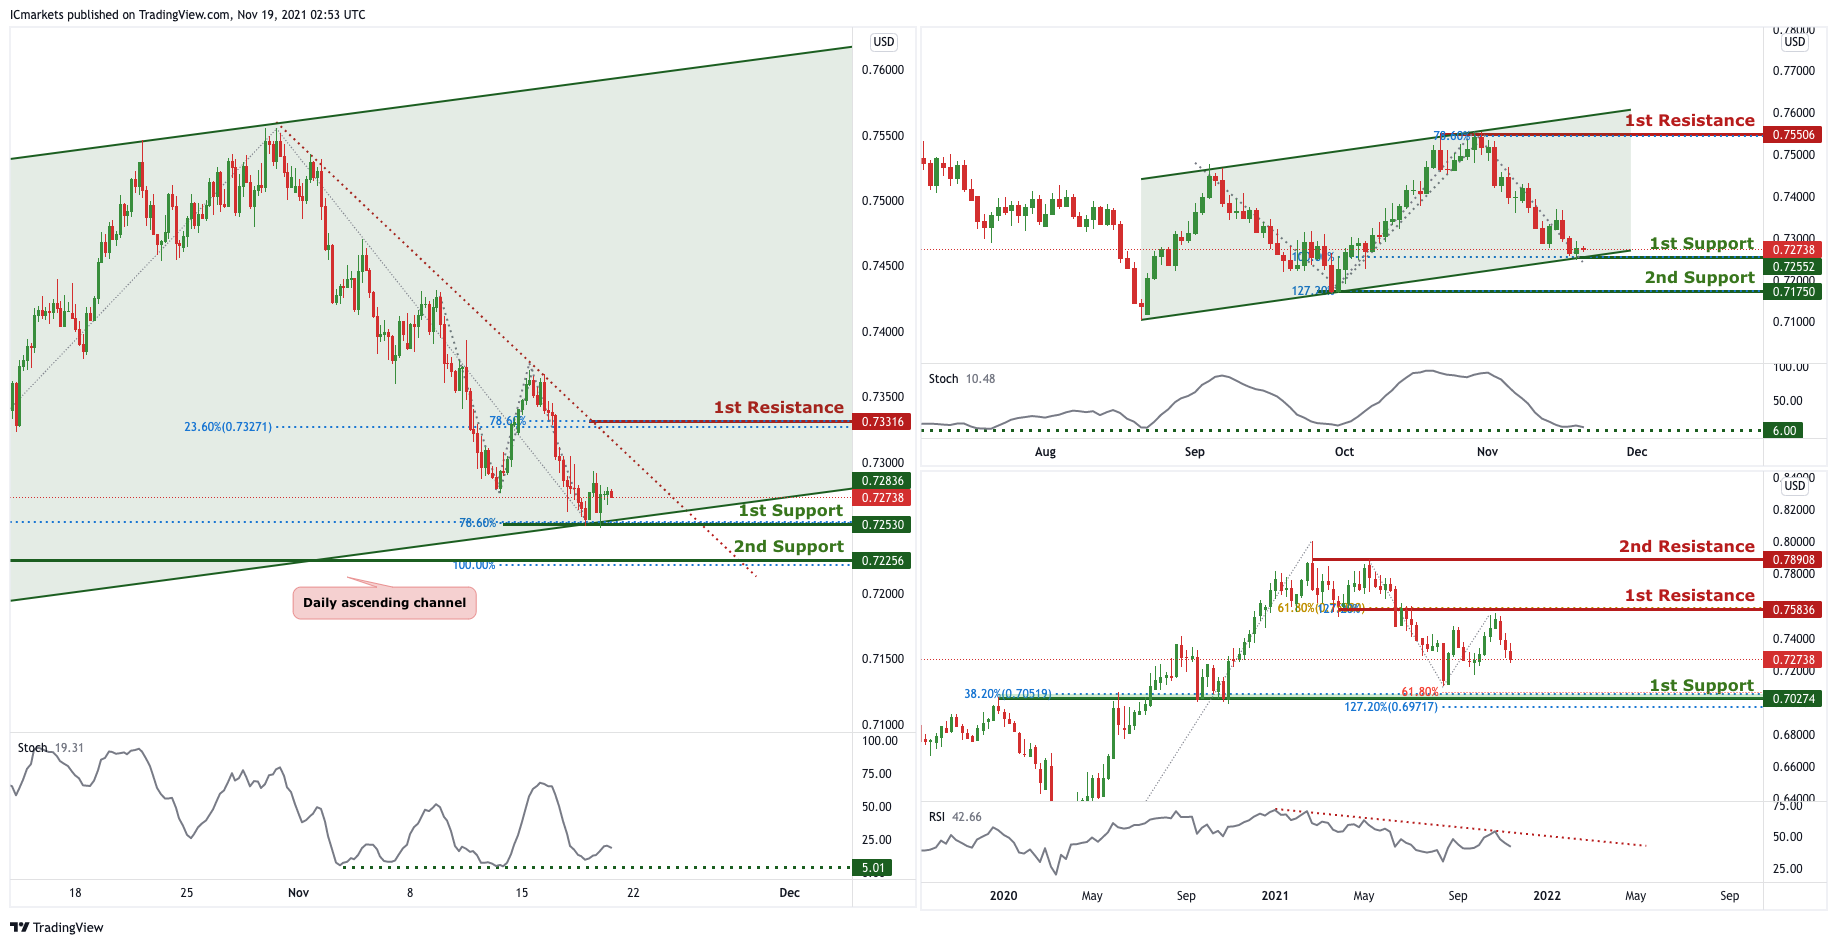
AUD/USD:
On the weekly, price is the 1st Resistance in line with price is expected to push towards the 1st support in line with previous swing low and 61.8% Fibonacci projection. Our bearish bias is further supported by the RSI indicator abiding to a descending trendline. On the Daily, the price is at the 1st Support, we can expect the price to bounce from 1st Support level in line with 100% Fibonacci projection and ascending channel support towards 1st Resistance in line with 78.6% Fibonacci projection. OUr bullish bias is also supported by the stochastic indicator where the %K line is at the support level.
On the H4, we can see that price abiding to the ascending channel on the daily and descending trendline on the H4. We can expect price to make a bounce from 1st Support in line with 78.6% Fibonacci projection, 78.6% Fibonacci retracement and ascending channel support towards the 1st Resistance in line with 78.6% Fibonacci projection and 23.6% FIbonacci retracement.Our bullish bias is further supported by stochastic indicator where the %K line is approaching the support level awaiting for a bounce.
Areas of consideration:
- H4 1st resistance level 0.73316
- H4 1st support level 0.72530
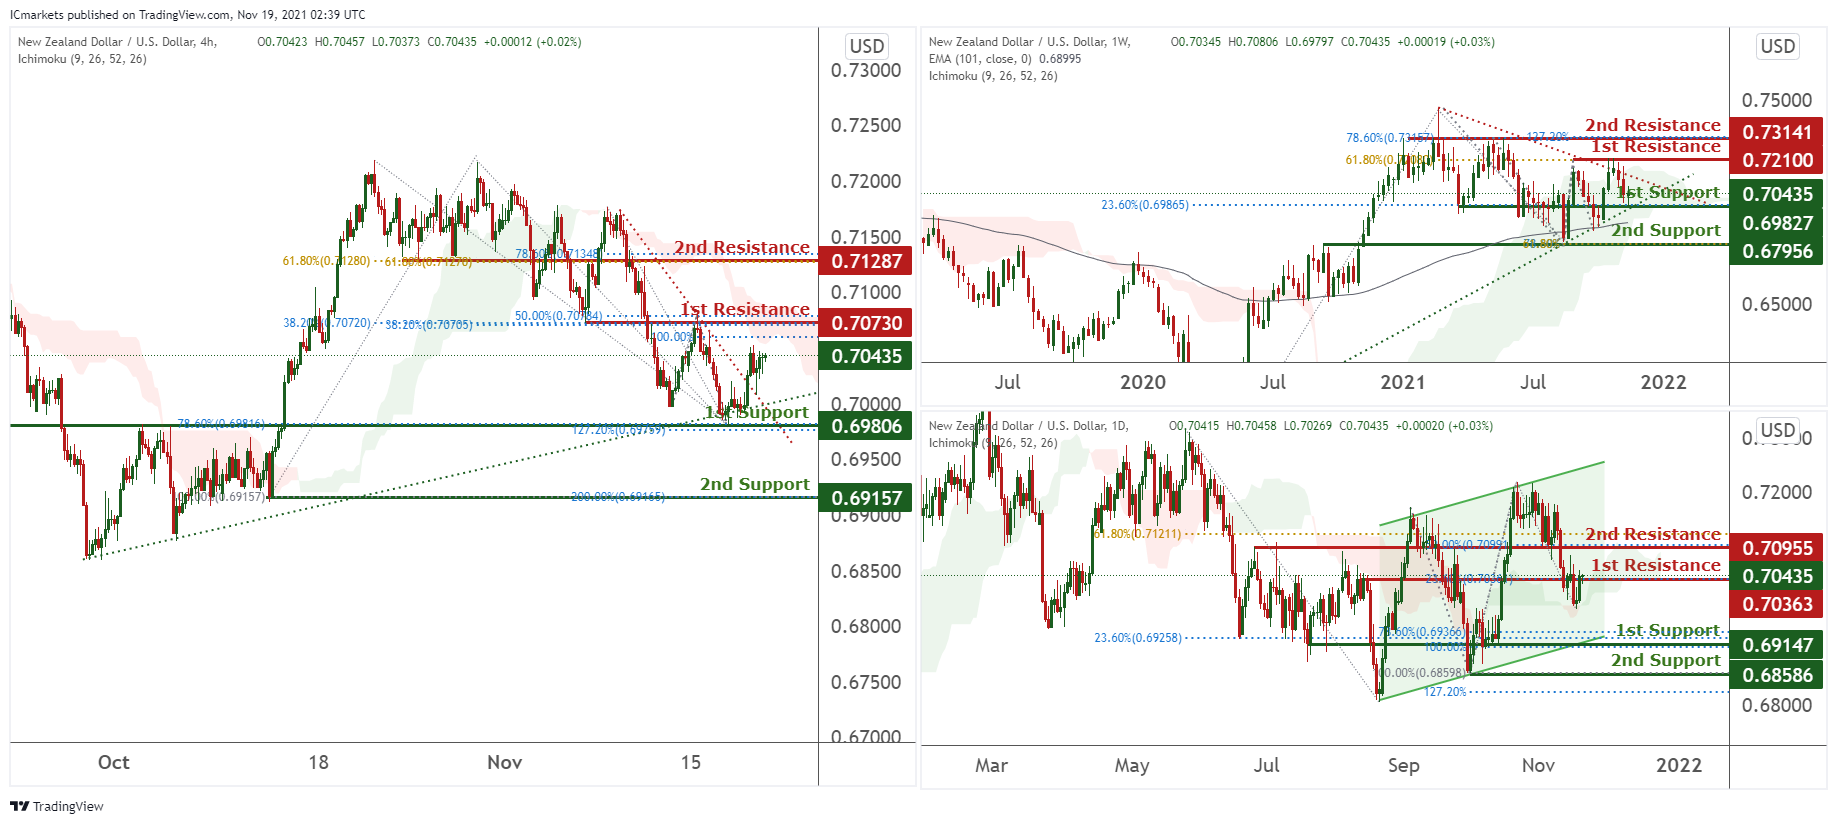
NZD/USD:
On the weekly, prices are consolidating in a triangle. We see potential for a bounce from our 1st support at 0.70435 in line with 23.6% Fibonacci retracement towards our 1st resistance at 0.72100 in line with 61.8% Fibonacci retracement. Technical indicators are showing bullish momentum.
On the daily, prices are consolidating in a channel. We see potential for dips from our 1st resistance at 0.70363 in line with 23% Fibonacci retracement towards our 1st support at 0.69147 which is an area of Fibonacci confluences. Technical indicators are showing bearish momentum.
On the H4 timeframe, prices are on a bearish momentum and abiding to our bearish trendline. We see potential for a pullback to retest our trendline at our 1st support at 0.69806 which is an area of Fibonacci confluences. Technical indicators are showing bearish momentum.
Areas of consideration:
- H4 time frame, 1st resistance at 0.70730
- H4 time frame, 1st support at 0.69806
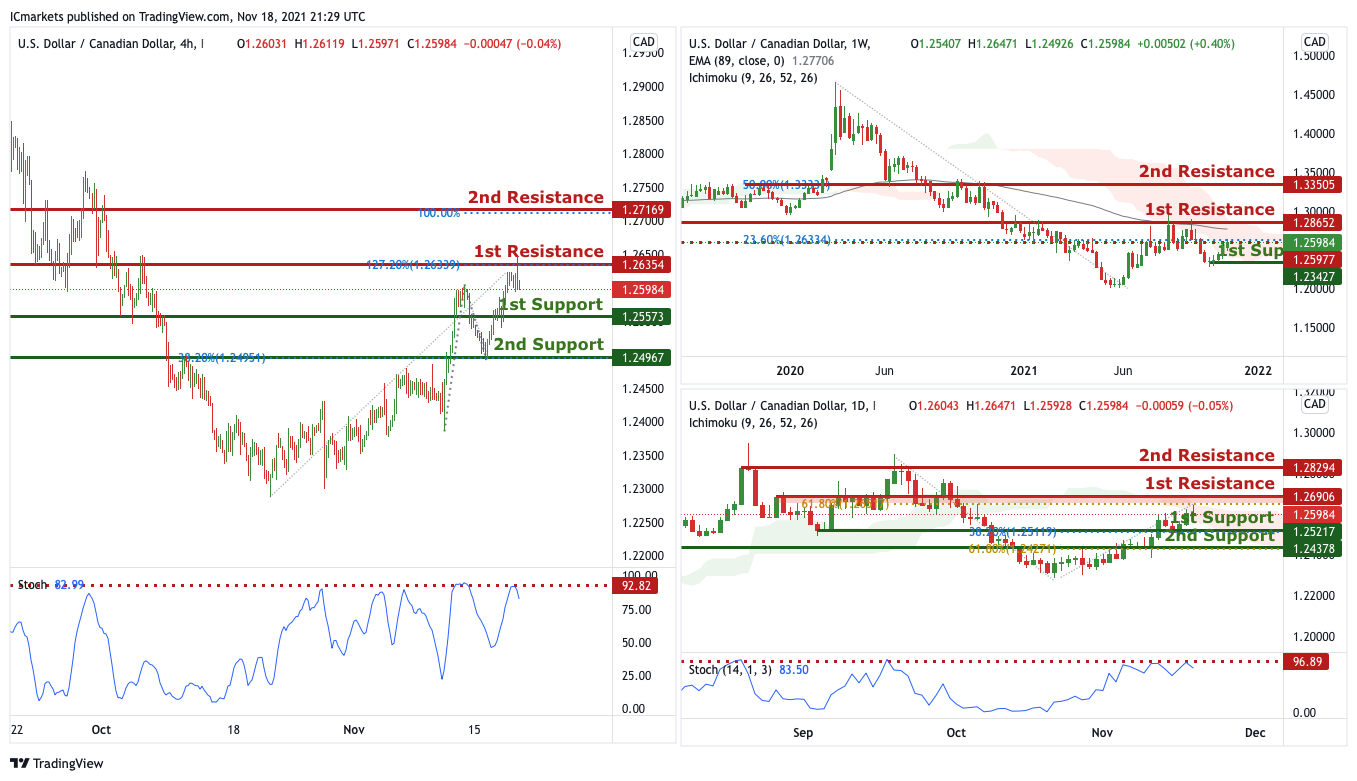
USD/CAD:
On the Weekly timeframe, price is moving below the ichimoku cloud and the moving average. As long as the price is holding below this level, we are expecting to see a bearish drop from 1st resistance at 1.23427 in line with the graphical horizontal resistance to 1st support at 1.23427 in line with the graphical swing low support. Alternatively, we may see price 1st resistance structure and head for 2nd resistance at 1.33505 in line with the 50% Fibonacci retracement level. Do take note that there is an intermediary resistance at 1.25977in line with the 23.6% Fibonacci retracement and price may just from here there instead.
On the Daily, with price testing the resistance of the stochastics indicator and the ichimoku cloud at 1.26906 in line with the 61.8% Fibonacci retracement, we are expecting to see price head to our 1st support at 1.25217 in line with 38.2% Fibonacci retracement and graphical overlap support and possibly to our 2nd support at 1.24378 in line with the 61.8% Fibonacci retracement. Alternatively, price may break 1st resistance and head for 2nd resistance at 1.28294 in line with the graphical swing high resistance.
On the H4, with price reversing off the resistance on the stochastics indicator and the a graphical level, we have a bearish bias that price will dip to 1st support at 1.25573 in line with the graphical overlap support and possibly to 2nd support at 1.24967 in line with the graphical overlap support from 1st resistance at 1.26354 in line with the horizontal overlap resistance and 127.2% Fibonacci extension level. Alternatively, we may see price break 1st resistance structure and head for 2nd resistance at 1.27169 in line with the 100% Fibonacci projection level and horizontal swing high resistance.
Areas of consideration:
- H4 time frame, support at 25573
- H4 time frame, resistance at 26354
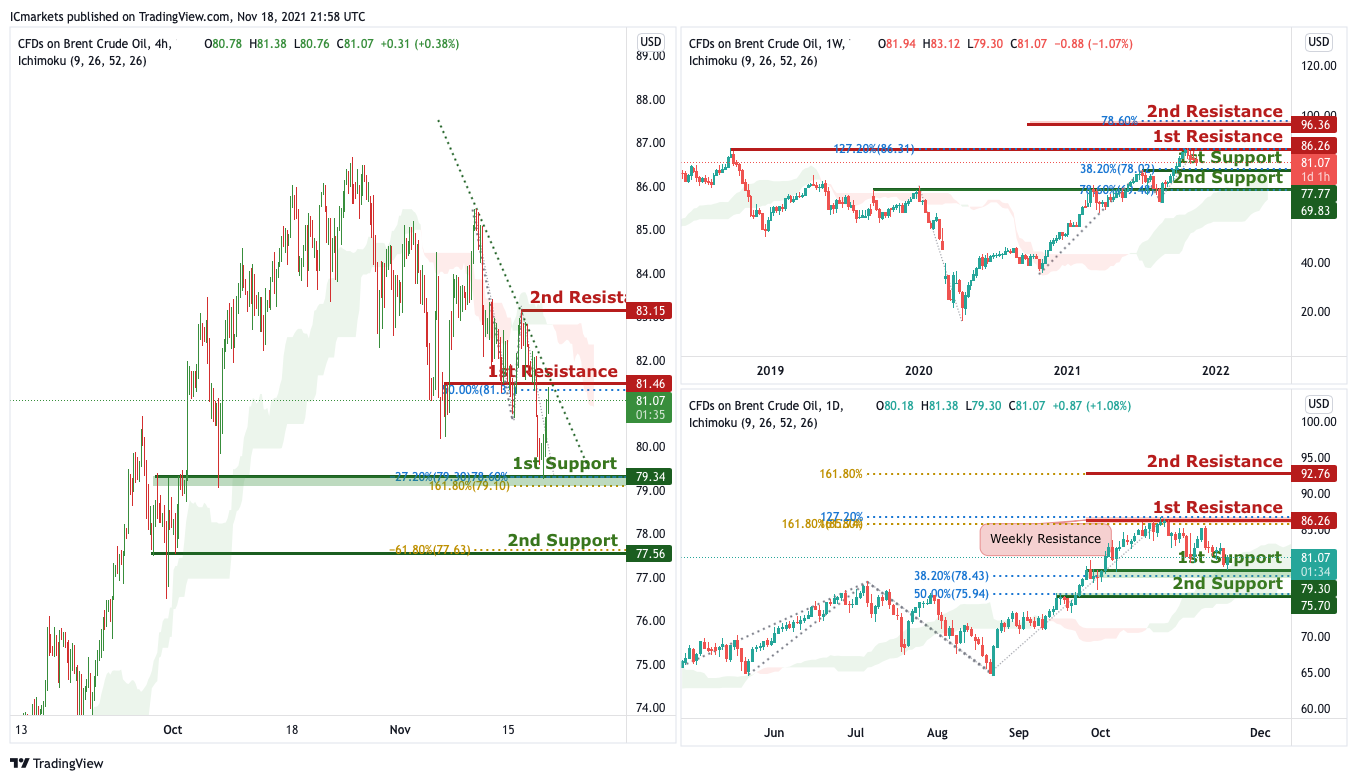
OIL:
On Weekly timeframe, with price moving above the ichimoku, we are likely to see price rise to 1st resistance at 86.26 in line with the 127.2% Fibonacci retracement and possibly to 2nd resistance at 96.36 in line with the 78.6% Fibonacci retracement level from 1st support at 81.08. Otherwise, price may break 1st support and make its way to 2nd support at 77.77 in line with the 78.6% Fibonacci retracement.
On the Daily timeframe, as price is holding above the ichimoku cloud, we are likely to see price move further up to the 1st resistance at 86.26 in line with 127.2% and 161.8% Fibonacci extension and possibly even to 2nd resistance at 96.36 in line with the Fibonacci projection level from 1st support at 79.3 in line with the 38.2% Fibonacci retracement. Alternatively, price may break 1st support and head to 2nd support at 75.70 where the 50% Fibonacci retracement is.
On the H4 timeframe, as price is holding above the ichimoku cloud and a graphical horizontal resistance in line with the 50% Fibonacci retracement at 81.46, we have a bearish bias that price will drop from our 1st resistance to our 1st support at 79.34 in line with 161.8% Fibonacci extension and -27.2% Fibonacci expansion in line with the graphical overlap support and possibly 2nd support at 77.56 where the -61.8% Fibonacci expansion and horizontal swing low support is. Alternatively, price may break 1st resistance and head for 2nd resistance at 83.15 where the horizontal swing high resistance is.
Areas of consideration:
- H4 time frame, 1st resistance of 46
- H4 time frame, 1st support of34
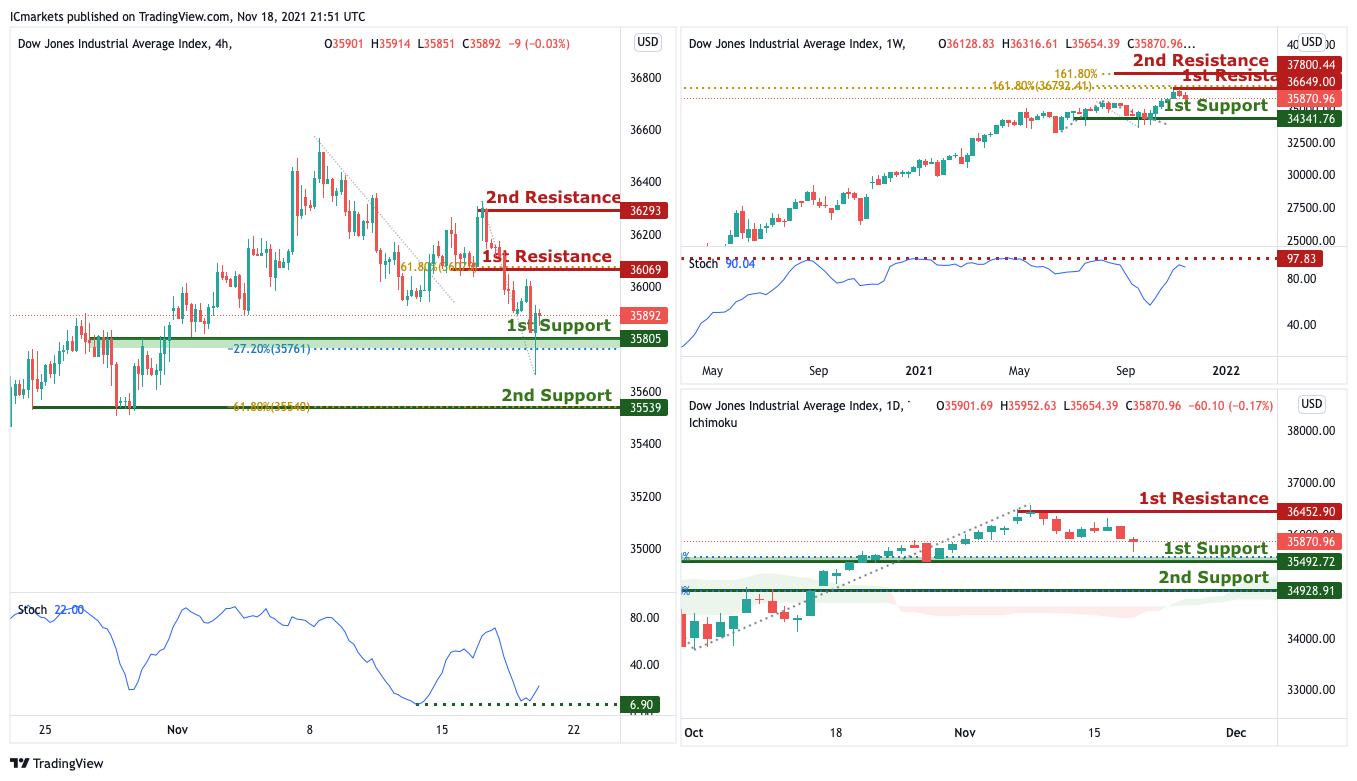
Dow Jones Industrial Average:
On the Weekly timeframe, price is approaching our resistance on the stochastics indicators and our graphical horizontal level at 36629 in line with the 161.8% Fibonacci projection. As long as the price is holding below this level, we could potentially see the price facing further bearish pressure in the long term or at least to 1st support at 34341 in line with our horizontal swing low support.
On the Daily, with price moving above the ichimoku cloud, we are expecting to see price do a bounce from 1st support at 35492 in line with the 78.6% Fibonacci retracement to 1st resistance at 36452 in line with the horizontal swing high resistance. Alternatively, price may break 1st support and head to 2nd support at 34928 in line with the horizontal overlap support.
On the H4, with price testing the support on the stochastics indicator, rejecting the graphical horizontal overlap support at 1st support at 35805 in line with the -27.2%Fibonacci expansion, we are biased that price will rise from 1st support to 1st resistance at 36069 in line with the 61.8% Fibonacci retracement and horizontal overlap resistance and possibly to 2nd resistance at 36293 in line with the graphical swing high resistance. Alternatively, we may see price break 1st support and head for 2nd support at 35539 in line with graphical swing low support and 61.8% Fibonacci projection.
Areas of consideration:
- 4H resistance at 36069
- 4H support at 35805
The accuracy, completeness and timeliness of the information contained on this site cannot be guaranteed. IC Markets does not warranty, guarantee or make any representations, or assume any liability regarding financial results based on the use of the information in the site.
News, views, opinions, recommendations and other information obtained from sources outside of www.icmarkets.com.au, used in this site are believed to be reliable, but we cannot guarantee their accuracy or completeness. All such information is subject to change at any time without notice. IC Markets assumes no responsibility for the content of any linked site.
The fact that such links may exist does not indicate approval or endorsement of any material contained on any linked site. IC Markets is not liable for any harm caused by the transmission, through accessing the services or information on this site, of a computer virus, or other computer code or programming device that might be used to access, delete, damage, disable, disrupt or otherwise impede in any manner, the operation of the site or of any user’s software, hardware, data or property.


