
EUR/USD:
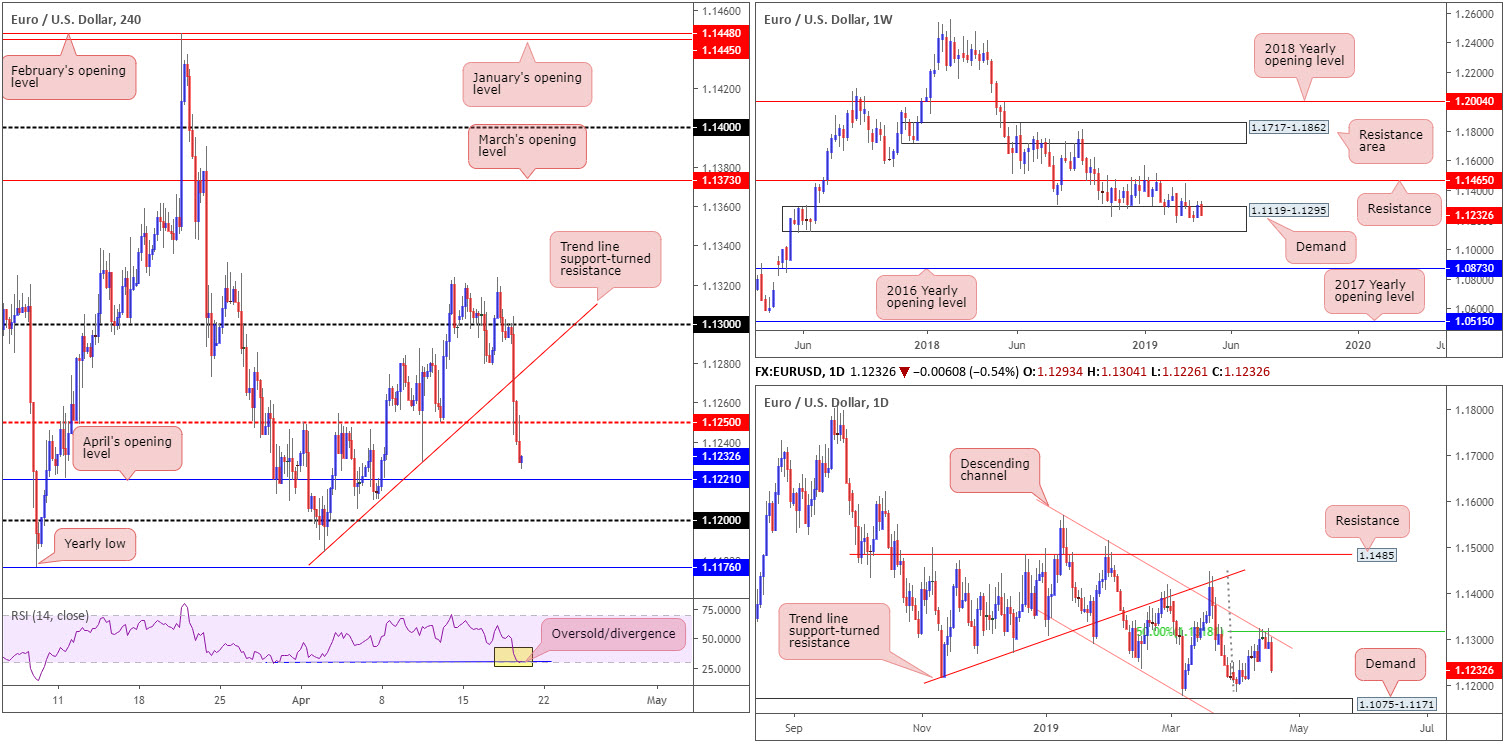
The single currency ceded ground to the dollar Thursday, following sour IHS Markit PMI surveys. After a brief stopover at the underside of 1.13 on the H4 timeframe the EUR/USD fell sharply, conquering neighbouring trend line support (extended from the low 1.1183) and eventually dipping beneath the 1.1250 support. Further weighing on the euro yesterday was the greenback reclaiming 97.00+ status, now currently poised to shake hands with weekly resistance (US dollar index) at 97.72. Note upbeat retail sales data out of the US helped fuel recent USD buying.
At this stage, the H4 candles could potentially dip their toes into support at 1.1221: April’s opening level, or even the 1.12 handle. Some technicians may also want to note the RSI is presently exhibiting an oversold/divergence reading.
Expanding the technical view, we can see daily action pressed lower from its channel resistance (taken from the high 1.1569) and merging 50.0% resistance value at 1.1318 yesterday, gesturing a possible test of the 1.1183 Apr 2 low, shadowed closely by demand at 1.1075-1.1171, today. In terms of weekly movement, the buyers and sellers remain warring for position within the walls of demand at 1.1119-1.1295. Buying out of this region may eventually call for a test of resistance priced in at 1.1465.
Areas of consideration:
As we head into Friday’s sessions, the research team notes limited confluence in view at the moment and, therefore, is a market probably best left on the back burner today.
Weekly price shows possible buying may arise out of its demand zone, while daily action proposes further selling could be on the cards. Although April’s opening level at 1.1221 on the H4 timeframe has the potential to serve as short-term support, the temptation to bring in buyers from 1.12, or even the 2019 yearly low at 1.1176, may be too much.
On top of the above, traders are reminded below-average volume is expected today and Monday as many banks close in observance of Good Friday and Easter Monday.
Today’s data points: US Building Permits; Bank Closures In Observance Of Good Friday.
GBP/USD:
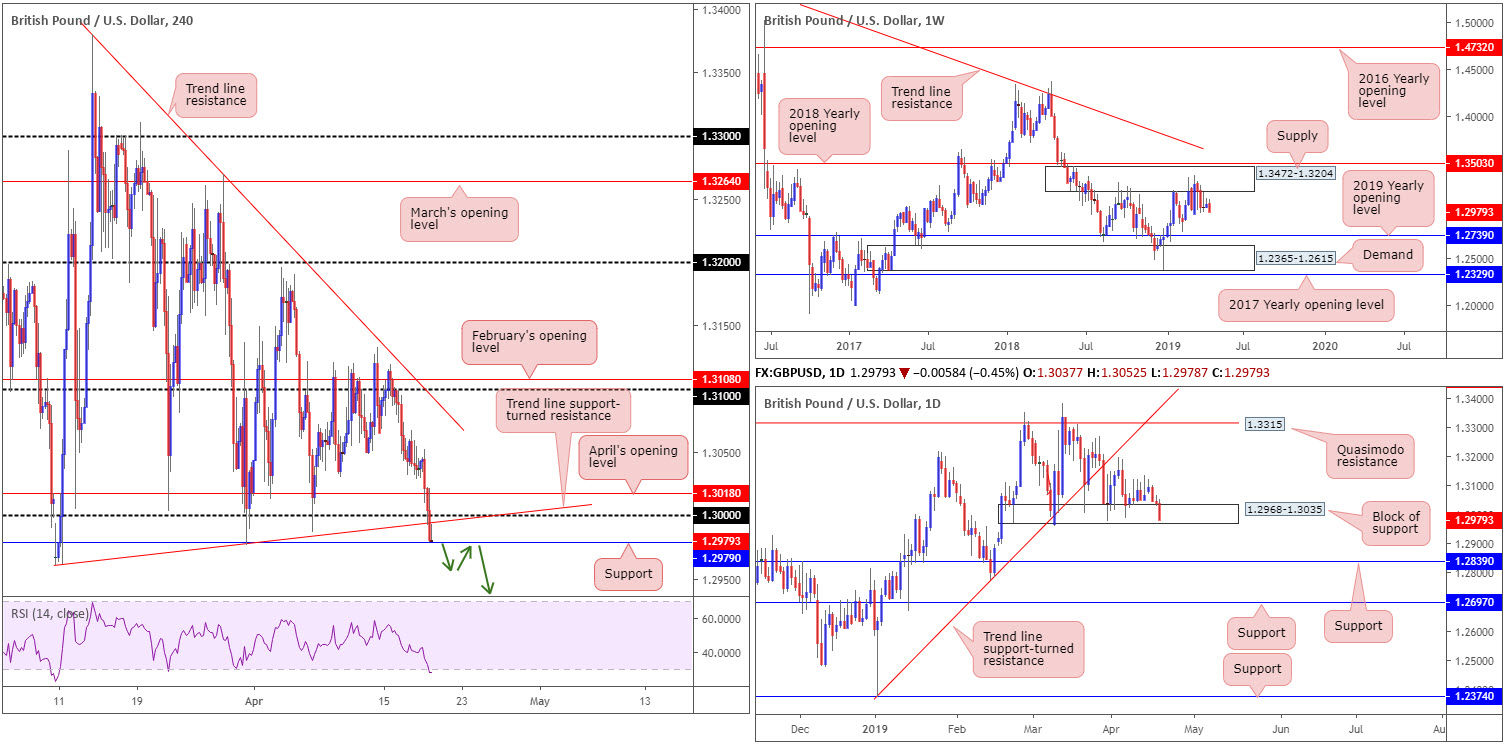
Sterling extended losses Thursday vs. its US counterpart, down 0.45%. Weighed on by a strong dollar across the board, H4 flow brushed aside April’s opening level at 1.3018 and ultimately dethroned key figure 1.30, leaving support at 1.2979 exposed into the close. In the event we press for lower ground, the next downside target falls in at demand drawn from 1.2891-1.2926, which happens to house 1.29 within (not seen on the screen).
Through the lens of a technician, the odds of the H4 candles respecting the current support are low. Overhead, traders face 1.30 as potential resistance, as well as a trend line support-turned resistance (taken from the low 1.2960) and April’s opening level.
Analysis of the weekly timeframe also has the unit fading the underside of supply at 1.3472-1.3204, situated a few points south of the 2018 yearly opening level at 1.3503. Since the end of February this supply area has been home to many traders. With the next obvious downside target not realised on this timeframe until the 2019 yearly opening level at 1.2739, followed by demand coming in at 1.2365-1.2615, sellers still have plenty of room to manoeuvre lower.
Against the backdrop of weekly flow, daily activity remains teasing a block of support at 1.2968-1.3035, albeit appearing somewhat fragile at the moment. Buying from here is likely to find resistance at a Quasimodo formation drawn from 1.3315. If the current support zone fails, as weekly structure suggests, support coming in at 1.2839 is in sight, alongside another layer of support at 1.2697 (at this point we’ll be trading below the 2019 yearly opening level on the weekly timeframe).
Areas of consideration:
On account of our technical studies above, sellers appear to have the upper hand. Should the analysis turn out correct and H4 action closes beneath its current support at 1.1279, a retest to the underside of this level as resistance (green arrows) could serve as an ideal platform for shorts today, targeting the H4 demand highlighted above at 1.2891-1.2926.
Traders looking to add a little more confirmation to the mix from 1.2979 might look for a H4 bearish candlestick to form on the retest. Not only will this help confirm seller intent from this angle, it’d provide entry/risk levels to work with.
Today’s data points: US Building Permits; Bank Closures In Observance Of Good Friday.
AUD/USD:
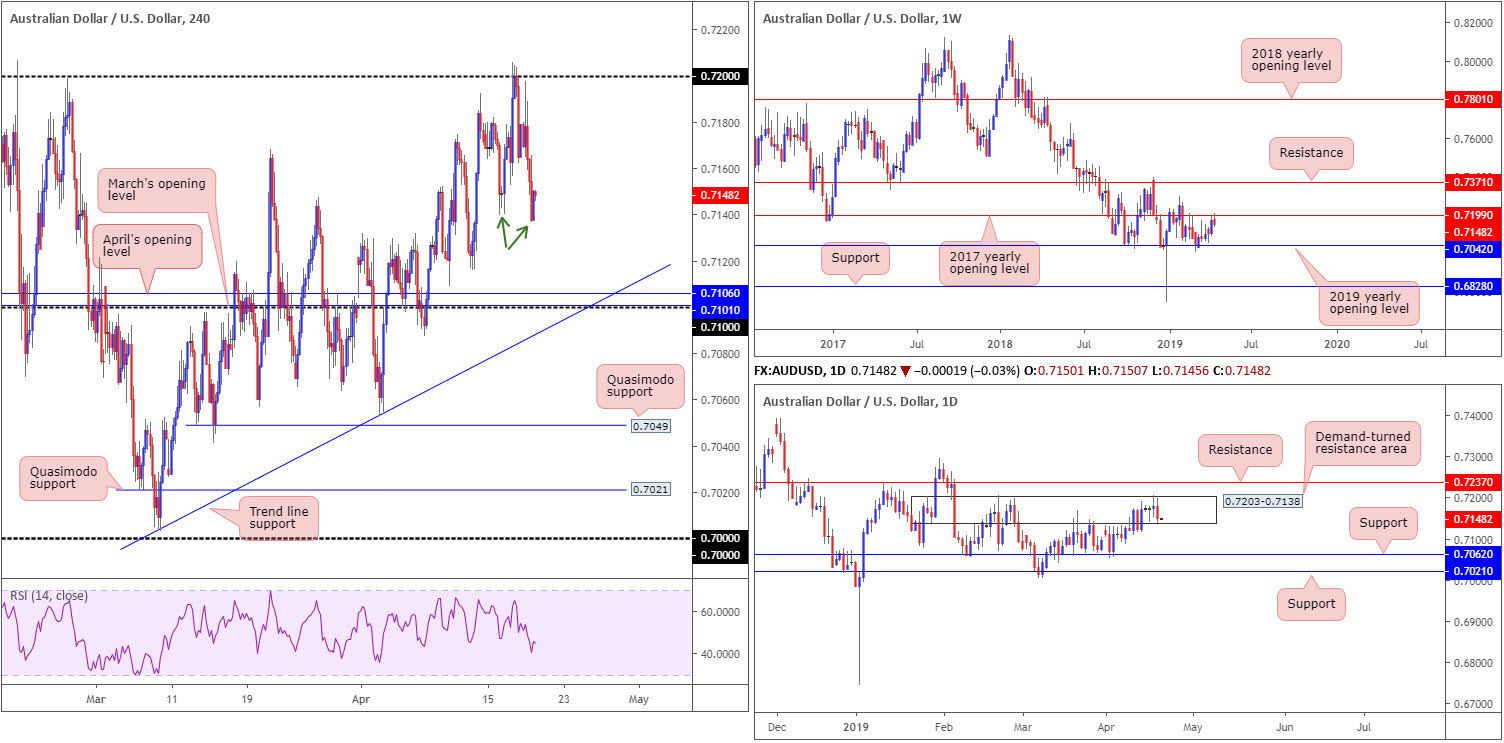
Wednesday’s failure to sustain gains beyond 0.72 on the H4 timeframe saw the commodity-linked currency extend its downside presence Thursday, largely in response to healthy USD demand. In addition to this, sluggish Eurozone PMIs reignited global growth concerns, somewhat counterweighing the latest optimism over a possible US/China trade deal. The already stronger dollar also received fresh impetus in wake of upbeat US monthly retail sales data.
Weekly structure has the pair fading the 2017 yearly opening level at 0.7199, which could eventually shoulder price action towards the 2019 yearly opening level at 0.7042. In conjunction with weekly flow, a daily demand-turned resistance zone at 0.7203-0.7138 is in motion, potentially setting the stage for a run in the direction of support priced in at 0.7062.
A closer reading of price action on the H4 timeframe witnessed the candles break 0.7139 to the downside Thursday (the April 16 low – green arrows). In response to the research team noting this as an important move (largely due to 0.7139 being the last obvious low preceding the 0.7205 high), further selling could be on the cards to 0.71. Note this psychological number is closely associated with April and March’s opening levels at 0.7106/0.7101 and a trend line support (taken from the low 0.7003).
Areas of consideration:
A H4 bullish candlestick signal printed from 0.71 (entry/risk levels can be determined according to this structure) is, according to local confluence highlighted above, a high-probability support level. Whether or not this number will enter the mix today or Monday, though, is difficult to judge given the possibility of thin volume on account of Good Friday and Easter Monday.
As for selling at current price, aside from a retest of 0.72, the research team notes limited resistance to base a sell from. This is unfortunate considering both weekly and daily timeframes indicate seller intent.
Today’s data points: US Building Permits; Bank Closures In Observance Of Good Friday.
USD/JPY:
Outlook unchanged owing to lacklustre movement.
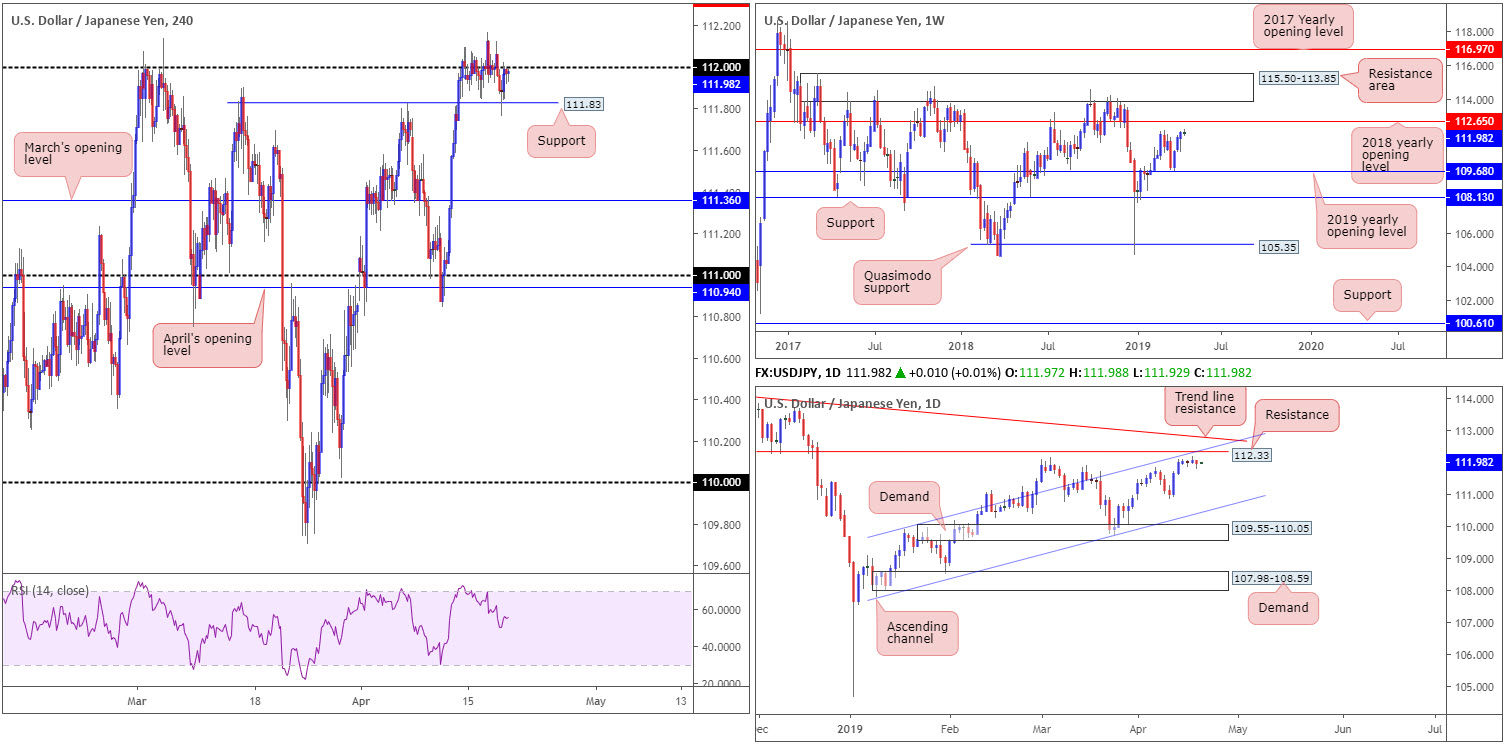
Since the beginning of the week, the USD/JPY has stressed somewhat of a subdued tone, narrowly flipping between gains/losses around 112 on the H4 timeframe. With this likely to continue into Good Friday and Easter Monday, traders are reminded support remains situated nearby at 111.83: a Quasimodo resistance-turned support, which, as you can see, was brought into the fight Thursday. Above 112, traders’ crosshairs are likely fixed on daily resistance coming in at 112.33 (not visible on the H4 timeframe).
Crossing over to daily structure, the research team notes the 112.33 resistance level also fuses with a channel resistance (drawn from the high 109.88), and is closely positioned nearby a trend line resistance (etched from the high 114.54). Structure on the weekly timeframe has the candles facing the March 4 high at 112.13, shadowed closely by the 2018 yearly opening level priced in at 112.65.
Areas of consideration:
Daily resistance at 112.33 appears a prime location for shorts in this market, according to our technical reading, with stop-loss orders plotted beyond the daily trend line resistance highlighted above. The only caveat to this, aside from a reasonably strong trending market at the moment (clearly visible on the daily timeframe), is weekly price threatening to press as far north as 112.65. For that reason, before pulling the trigger on a sell from 112.33, traders are recommended to wait for additional confirmation. This could be anything from a moving average crossover, a H4 bearish candlestick signal or even drilling down to the lower timeframes and trading local structure.
Today’s data points: US Building Permits; Bank Closures In Observance Of Good Friday.
The accuracy, completeness and timeliness of the information contained on this site cannot be guaranteed. IC Markets does not warranty, guarantee or make any representations, or assume any liability with regard to financial results based on the use of the information in the site.
News, views, opinions, recommendations and other information obtained from sources outside of www.icmarkets.com.au, used in this site are believed to be reliable, but we cannot guarantee their accuracy or completeness. All such information is subject to change at any time without notice. IC Markets assumes no responsibility for the content of any linked site. The fact that such links may exist does not indicate approval or endorsement of any material contained on any linked site.
IC Markets is not liable for any harm caused by the transmission, through accessing the services or information on this site, of a computer virus, or other computer code or programming device that might be used to access, delete, damage, disable, disrupt or otherwise impede in any manner, the operation of the site or of any user’s software, hardware, data or property.


