
Key risk events today:
UK GDP m/m; UK Manufacturing Production m/m; US Prelim UoM Consumer Sentiment.
(Previous analysis as well as outside sources – italics).
EUR/USD:
USD longs made a comeback Thursday, with the DXY staging a stronger-than-expected recovery above 96.50. This firmly weighed on the euro, the largest component of the index making up almost 58%.
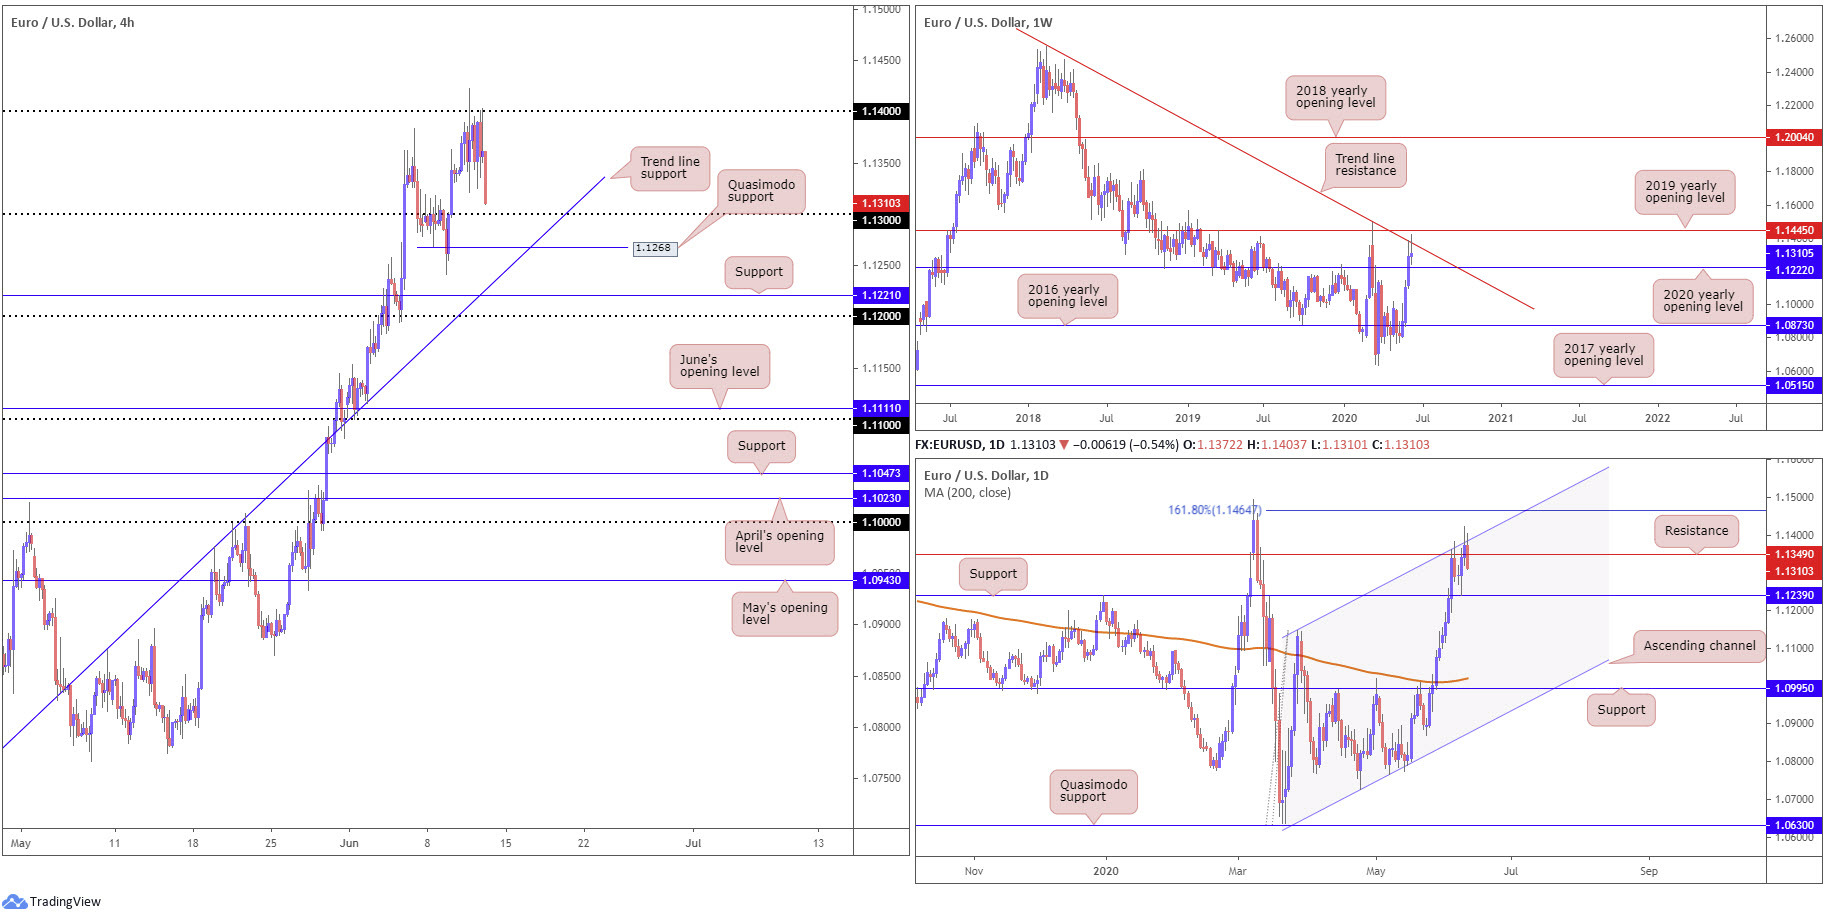
With USD/CHF holding north of its 0.94 handle, EUR/USD, based on the H4 timeframe, found thin air above 1.14, on track to greet the 1.13 handle, as we write. The latter, as you can see, shares space with Quasimodo support at 1.1268 and trend line support, extended from the low 1.0727.
On the data front, US unemployment claims fell to 1.5 million last week and US PPI data for May came in better than expected.
The US department of Labour noted:
In the week ending June 6, the advance figure for seasonally adjusted initial claims was 1,542,000, a decrease of 355,000 from the previous week’s revised level. The previous week’s level was revised up by 20,000 from 1,877,000 to 1,897,000. The 4-week moving average was 2,002,000, a decrease of 286,250 from the previous week’s revised average. The previous week’s average was revised up by 4,250 from 2,284,000 to 2,288,250.
The US Bureau of Labour Statistics noted:
The Producer Price Index for final demand rose 0.4 percent in May, seasonally adjusted, the US Bureau of Labour Statistics reported today. This increase followed declines of 1.3 percent in April and 0.2 percent in March. On an unadjusted basis, the final demand index decreased 0.8 percent for the 12 months ended in May.
The technical landscape on the higher timeframes had weekly price recently go toe-to-toe with long-standing trend line resistance, stretched from the high 1.2555. Sellers are beginning to make an appearance here and could unwind to 1.1222, the 2020 yearly opening level. Further upside, though, may have the unit cross swords with the 2019 yearly opening level at 1.1445.
In conjunction with the weekly timeframe, daily flow recently touched gloves with resistance at 1.1349, a level converging closely with channel resistance, taken from the high 1.1147. Remaining on the backfoot here throws support at 1.1239 into the light, with a break potentially exposing the 200-day SMA (orange – 1.1020).
Areas of consideration:
Sellers short 1.14 have likely reduced risk to breakeven, with 1.13 eyed as an initial downside target.
1.13, as well as H4 Quasimodo support at 1.1268, is likely to make an entrance thanks to noted higher-timeframe resistance. Technically speaking, though, the pair is unlikely to seek bids until reaching daily support at 1.1239, sited ahead of weekly support at 1.1222 (2020 yearly opening level)/H4 support at 1.1221. Therefore, bearish strategies could be an option upon closing under 1.13 on a H4 basis.
GBP/USD:
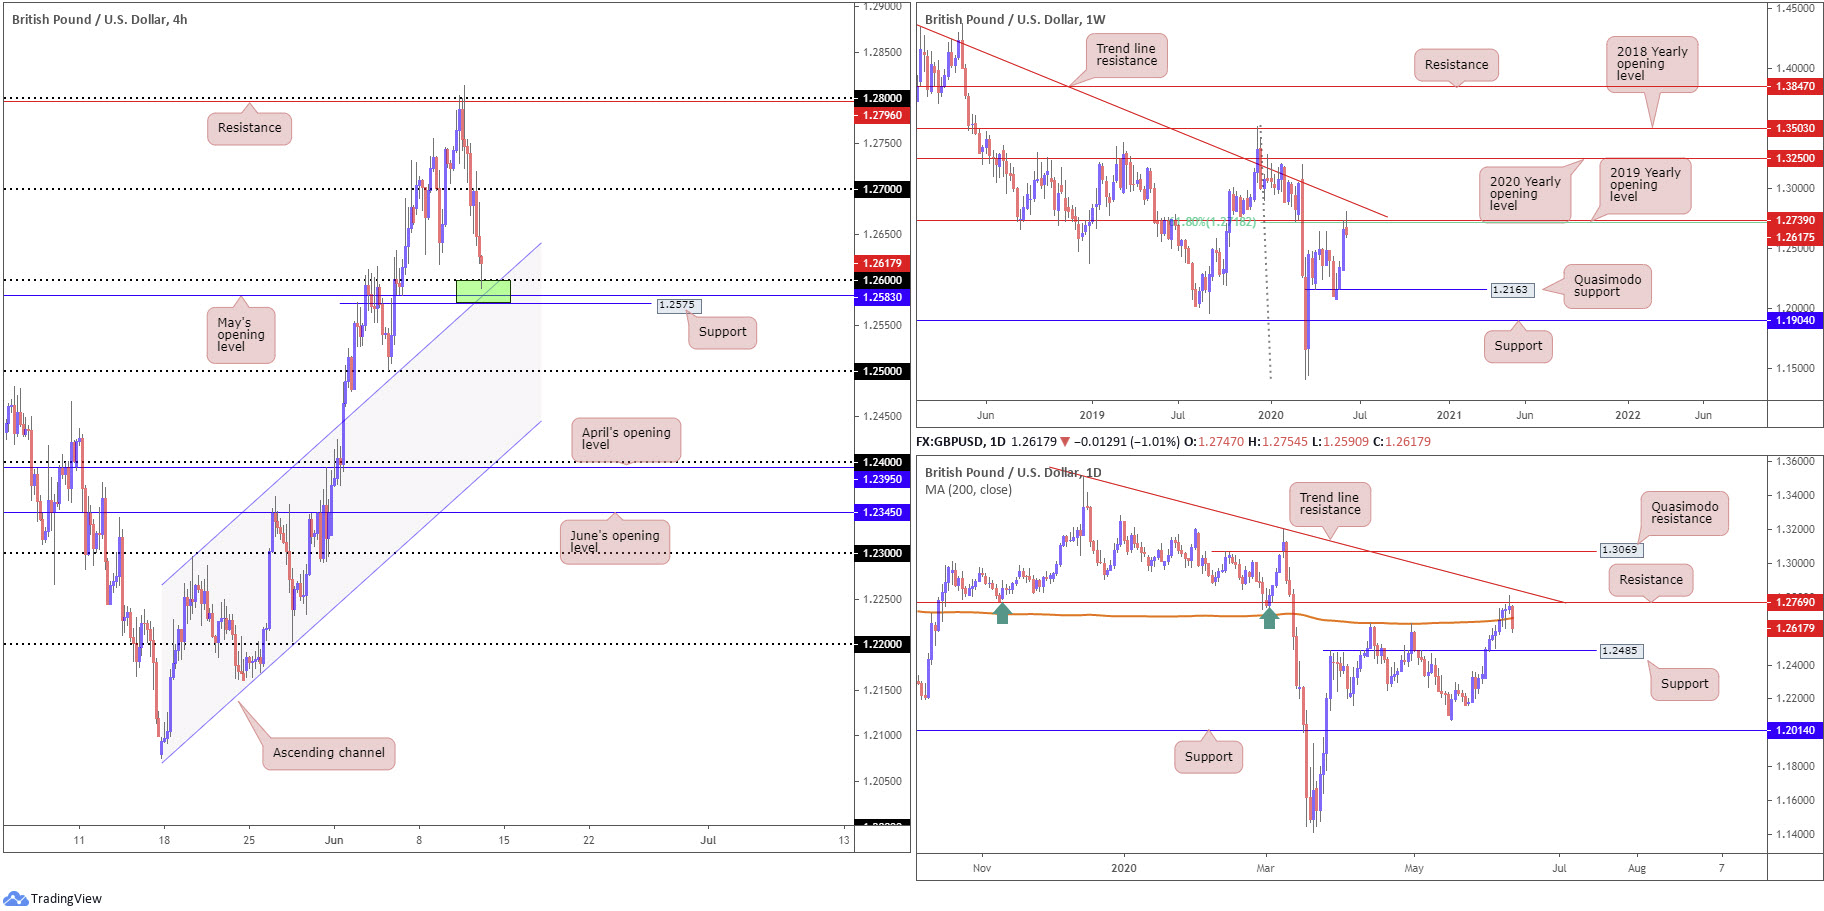
Increased dollar demand weighed on the British pound Thursday, with GBP/USD unwinding through 1.27 to 1.26 on the H4 timeframe. 1.26, as you can see, joins with additional support in the shape of May’s opening level at 1.2583, support at 1.2575 and channel resistance-turned support, extended from the high 1.2296.
Meanwhile, on the weekly timeframe, healthy selling emerged from the 61.8% Fibonacci retracement ratio at 1.2718 and the 2019 yearly opening level at 1.2739 in recent movement, on track to close in the form of a shooting star candle pattern. Additional downside has Quasimodo support at 1.2163 to target, while a strong bid could eventually take the currency pair to trend line resistance, extended from the high 1.5930.
Daily price, after Wednesday’s rejection off resistance at 1.2769, dipped through the 200-day SMA (orange – 1.2677) yesterday and underlined the possibility of further declines to support drawn from 1.2485.
Areas of consideration:
While 1.26 on the H4 currently holds, higher-timeframe direction indicates possible weakness off the round number. However, given local H4 structure exhibits additional support nearby (highlighted above), along with the current trend displaying an upward bias, buyers are likely to still attempt a recovery.
Once/if we cross beneath H4 support at 1.2575, open space to 1.25 is visible for shorting opportunities, backed, of course, by current higher-timeframe resistances.
AUD/USD:
Risk sensitive currencies took a back-seat Thursday, as global equities plunged across the board.
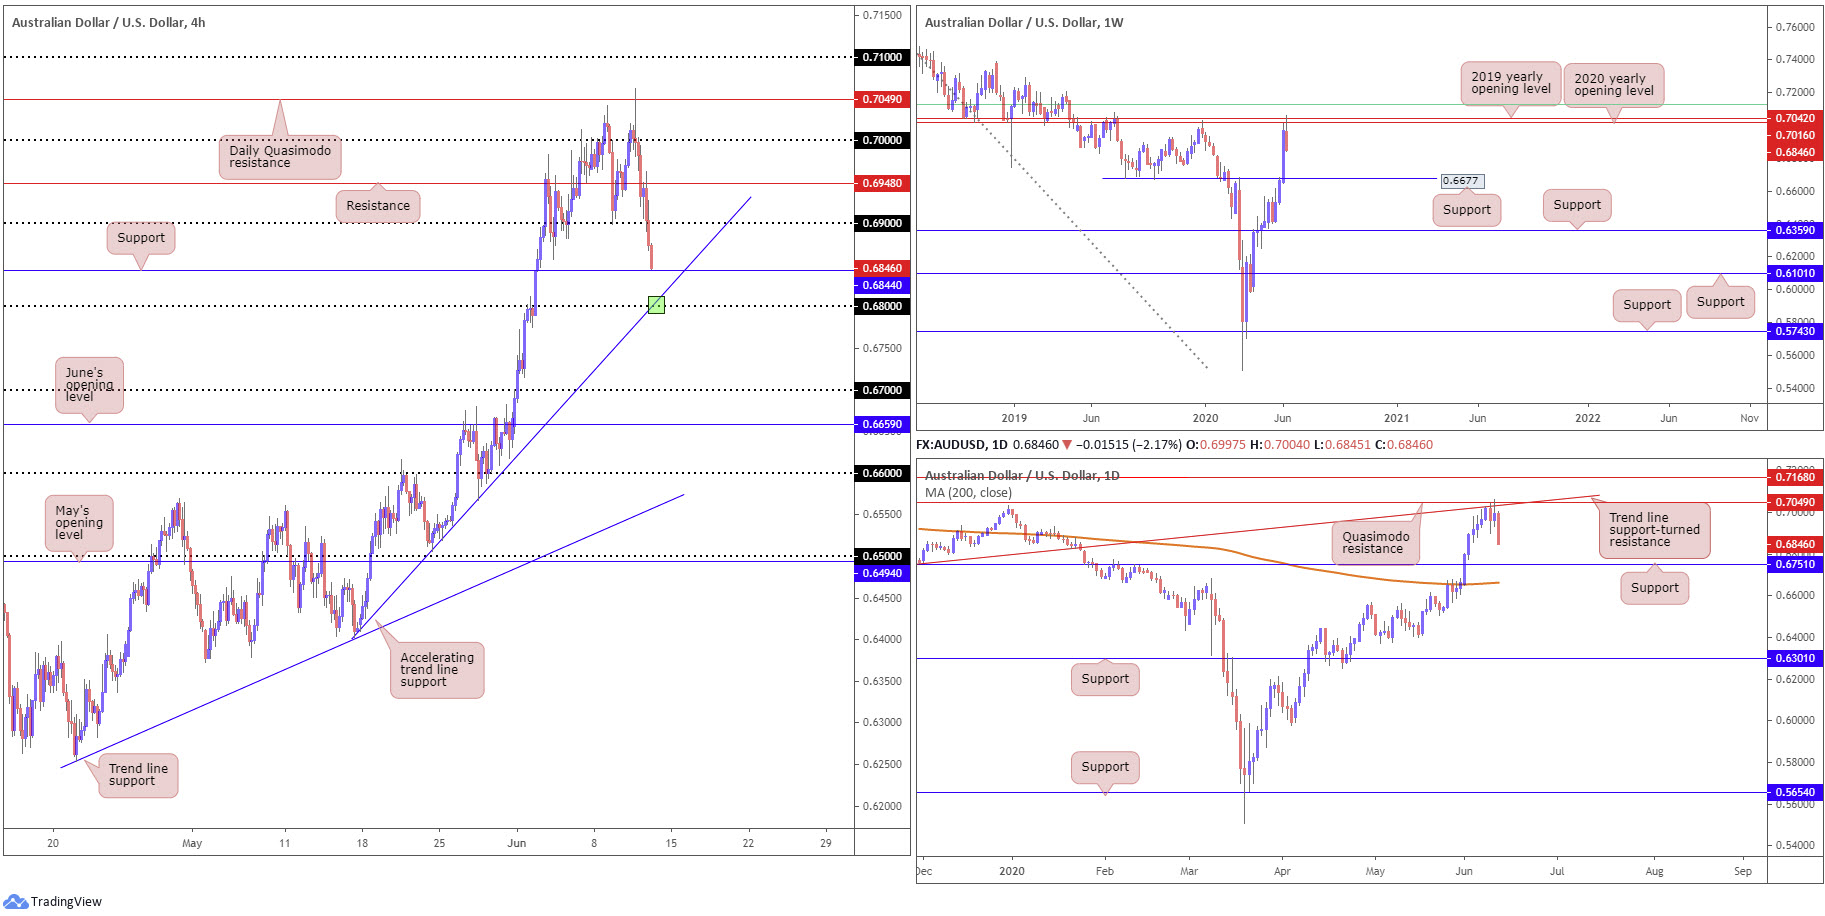
Down more than 2%, AUD/USD made quick work of 0.69 on the H4 timeframe and is fast approaching support priced in at 0.6844, merging closely with trend line support, taken from the low 0.6402. Under the aforementioned structure, focus shifts to the 0.68 handle.
Resistance, forged in the shape of the 2020 yearly opening level and the 2019 yearly opening level at 0.7016 and 0.7042, respectively, held price action lower in recent trade, consequently shining the spotlight on support at 0.6677.
Interestingly, daily price also engaged with trend line support-turned resistance, taken from the low 0.6670, and Quasimodo resistance at 0.7049 (also marked on the H4 timeframe), turning attention to support coming in at 0.6751, positioned above the 200-day SMA (orange – 0.6663).
Areas of consideration:
H4 support at 0.6844 may make a stand today, as might trend line support and the round number 0.68. Despite positioned alongside the current uptrend, higher-timeframe support suggests we may dive to deeper waters before levelling off. However, price action traders will be particularly fond of 0.68 intersecting with H4 trend line support (green) for a possible rebound.
Under 0.68, sellers may watch for moves to daily support at 0.6751, followed by 0.67 and then weekly support at 0.6677.
USD/JPY:
Safe-haven flows found demand on Thursday amid softness across global equities.
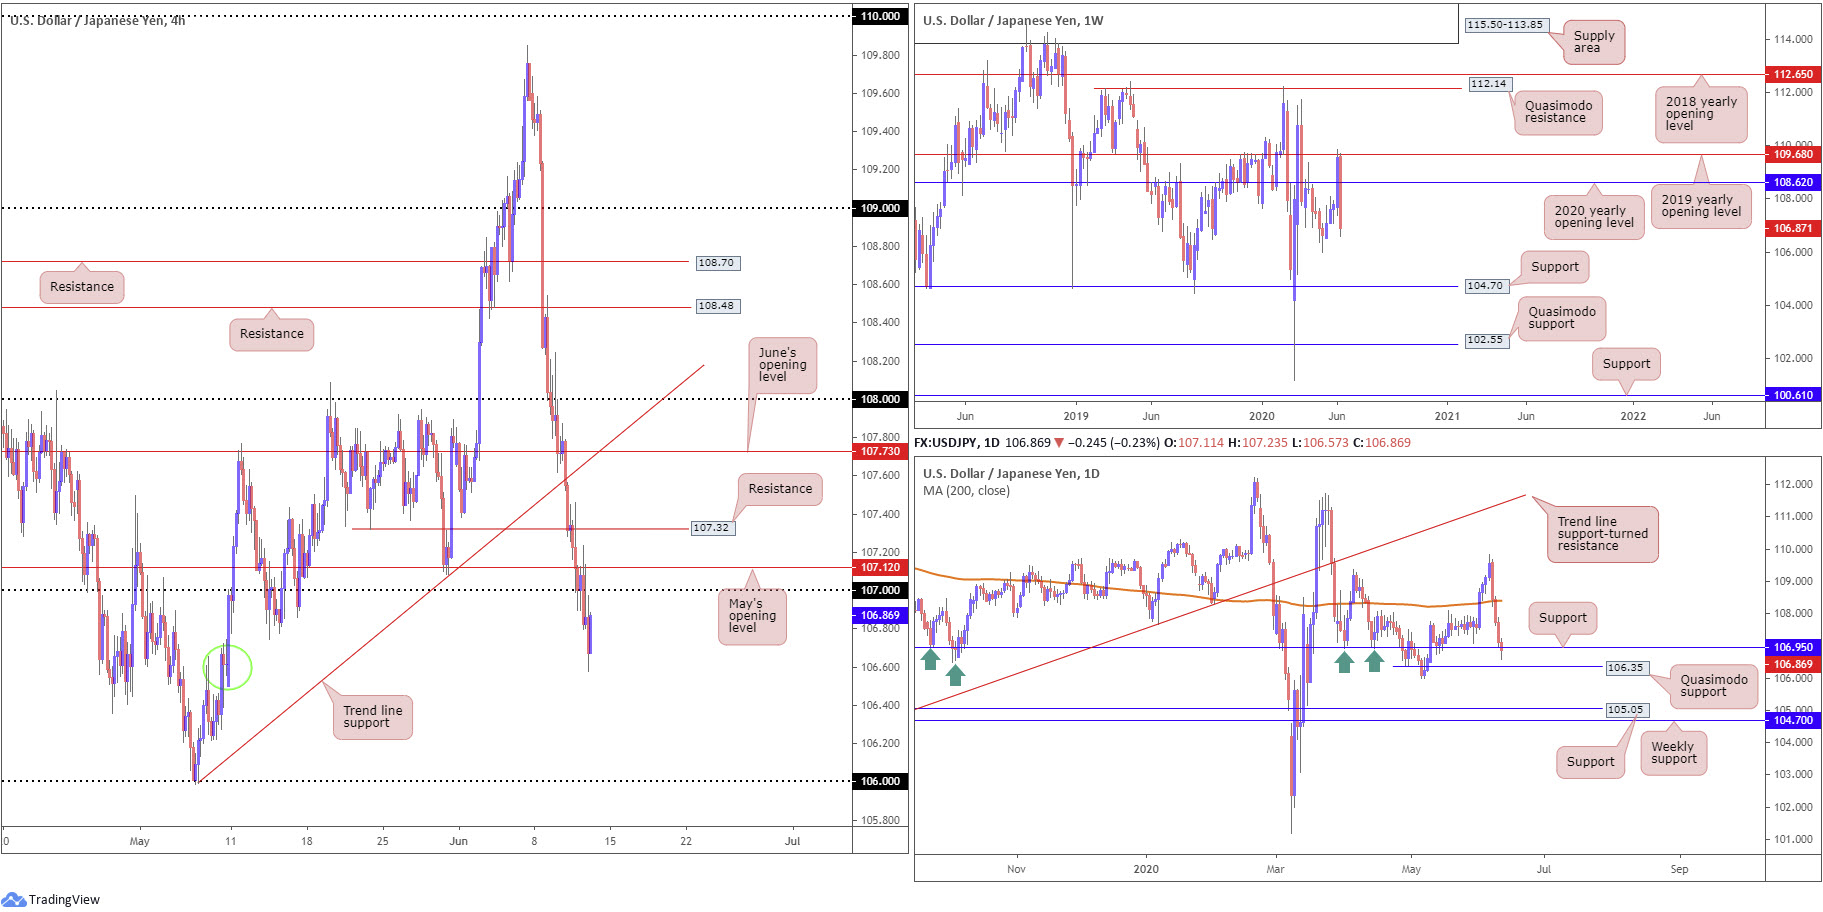
USD/JPY spun through 107 on the H4 timeframe, reinforced by May’s opening level at 107.12, to reach session lows of 106.57. Highlighted in Thursday’s technical briefing, demand was expected to occur around the 106.60ish region (green circle) upon breaking 107, which so far has been the case. Continued selling, nonetheless, could eventually draw in the 106 handle.
Across the page on the weekly timeframe, this week’s candle is quite something. Down 2.5%, after firmly rejecting the 2019 yearly opening level at 109.68 and cruising through the 2020 yearly opening level at 108.62, recent movement shifts focus to the 105.98 6th May low as the next downside target.
The landscape on the daily timeframe had the pair dip its toes under support at 106.95 yesterday, missing Quasimodo support at 106.35 by a hair and recording its fourth consecutive daily loss.
Areas of consideration:
In light of the end-of-day recovery off lows at 106.57, a retest at 107/May’s opening level at 107.12 is not out of the question today. A H4 bearish candle forming out of this zone would likely be enough to reignite selling, ultimately targeting daily Quasimodo support at 106.35, followed by the 106 handle.
In addition to the above, traders are also urged to pencil in 107.32 (prior Quasimodo support) as possible resistance today, in the event we snap above 107.12. In this case, a H4 close back under 107 will likely be required before sellers make an appearance.
USD/CAD:
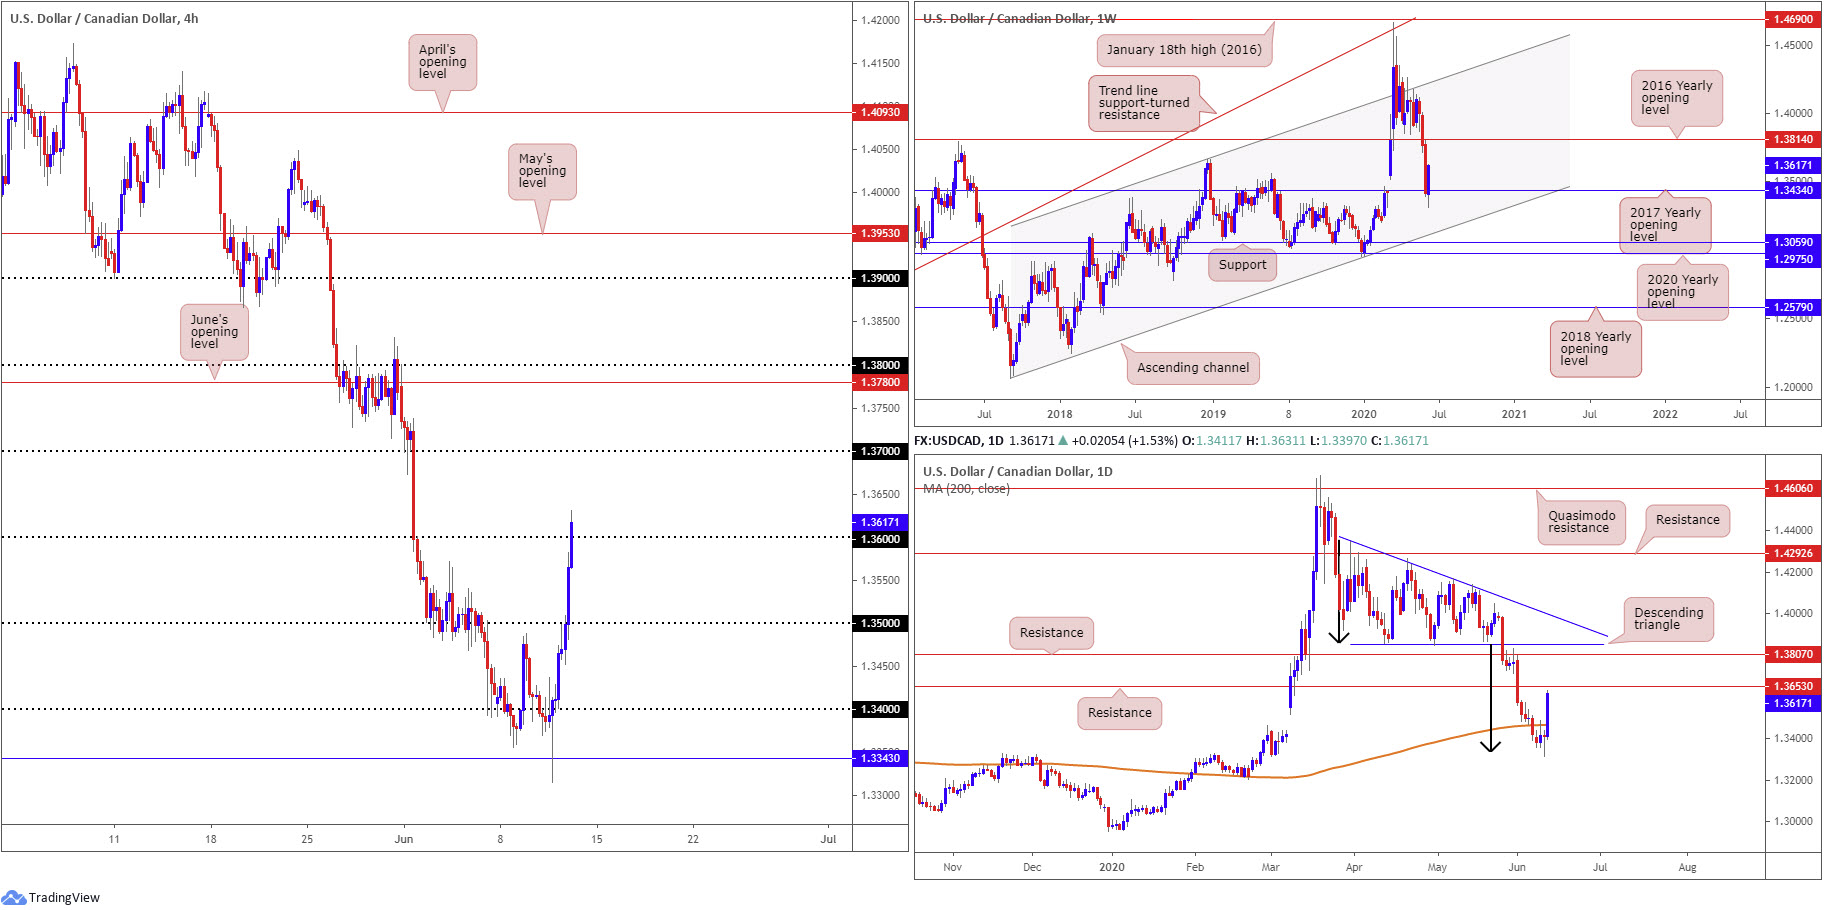
Broad USD bidding, along with WTI plummeting through $36.00/bbl, elevated USD/CAD 1.5% higher on Thursday, slicing through two big figures in the process. With limited resistance visible on the H4 timeframe north of 1.36, this could spark additional breakout longs today, targeting the 1.37 neighbourhood.
In support of further upside is the weekly timeframe, recently establishing a base off the 2017 yearly opening level at 1.3434 with room to stretch as far north as the 2016 yearly opening level at 1.3814.
Meanwhile, on the daily timeframe, after cruising through the 200-day SMA (orange – 1.3466) and spinning into the descending triangle’s (between 1.4349 and 1.3855) take-profit base at 1.3332 (black arrows), we’ve recently retaken the SMA and closed a touch off best levels ahead of resistance forged at 1.3653.
Areas of consideration:
Bullish strategies above 1.36 may face opposition off daily resistance mentioned above at 1.3653 today.
As such, traders long must factor the possibility of a rejection off 1.3653 into trade management, ensuring risk/reward remains favourable.
A H4 close above daily resistance, though, nudges buyers into a favourable position, eyeing 1.37 as possible resistance and perhaps even the 1.38ish region which boasts a strong connection with higher-timeframe resistances.
USD/CHF:
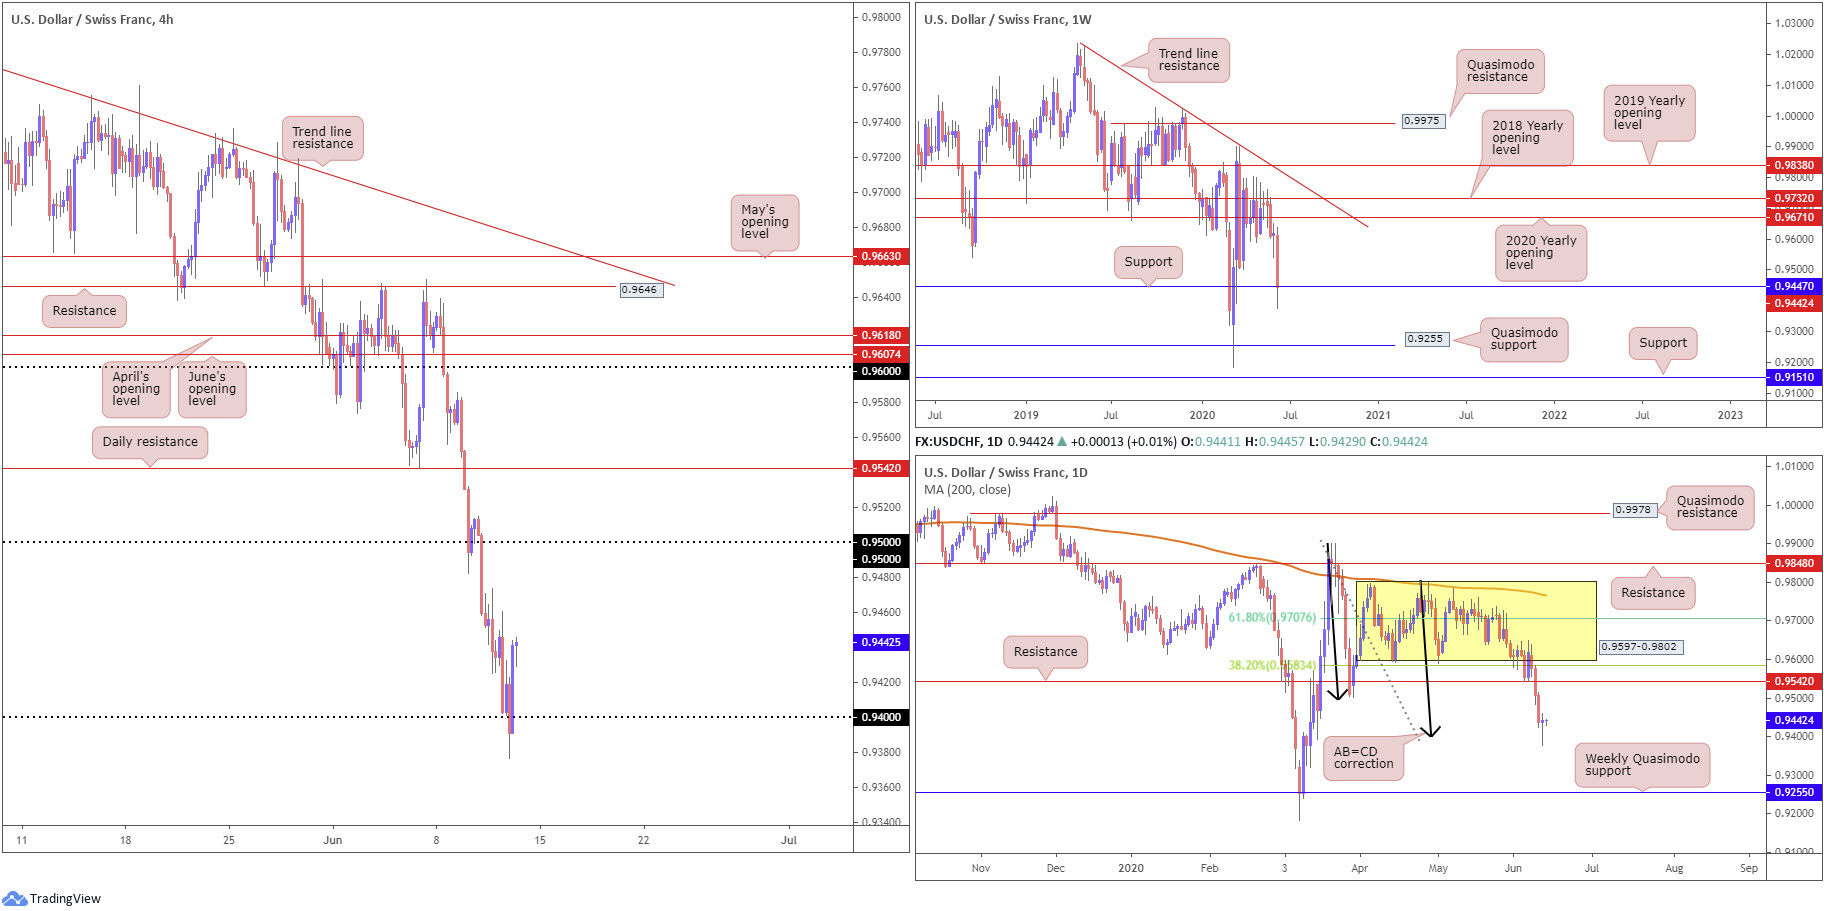
Thursday’s technical briefing highlighted that the break of weekly support at 0.9447 may have had sellers licking their lips in anticipation of further downside. It was also mentioned an AB=CD formation (black arrows) was in the process of completing its D-leg on the daily timeframe at 0.94.
As evident from the charts, the break of weekly support and pop beneath 0.94 on the H4 timeframe threw breakout sellers into a bear trap as daily buyers defend AB=CD structure. The initial upside target out of the daily AB=CD pattern, traditionally speaking, can be found at the 38.2% Fibonacci retracement at 0.9583, positioned above resistance plotted at 0.9542. Structure, based on the H4 timeframe, shows little stopping a run higher to 0.95, with the aforementioned daily resistance circling above.
Areas of consideration:
Well done to any traders who managed to jump aboard 0.94 as this was noted support to watch for in Thursday’s briefing. Given we’re heading into Friday, some traders may feel it right to reduce risk to breakeven at this point, with the expectation of further buying towards 0.95ish.
Dow Jones Industrial Average:
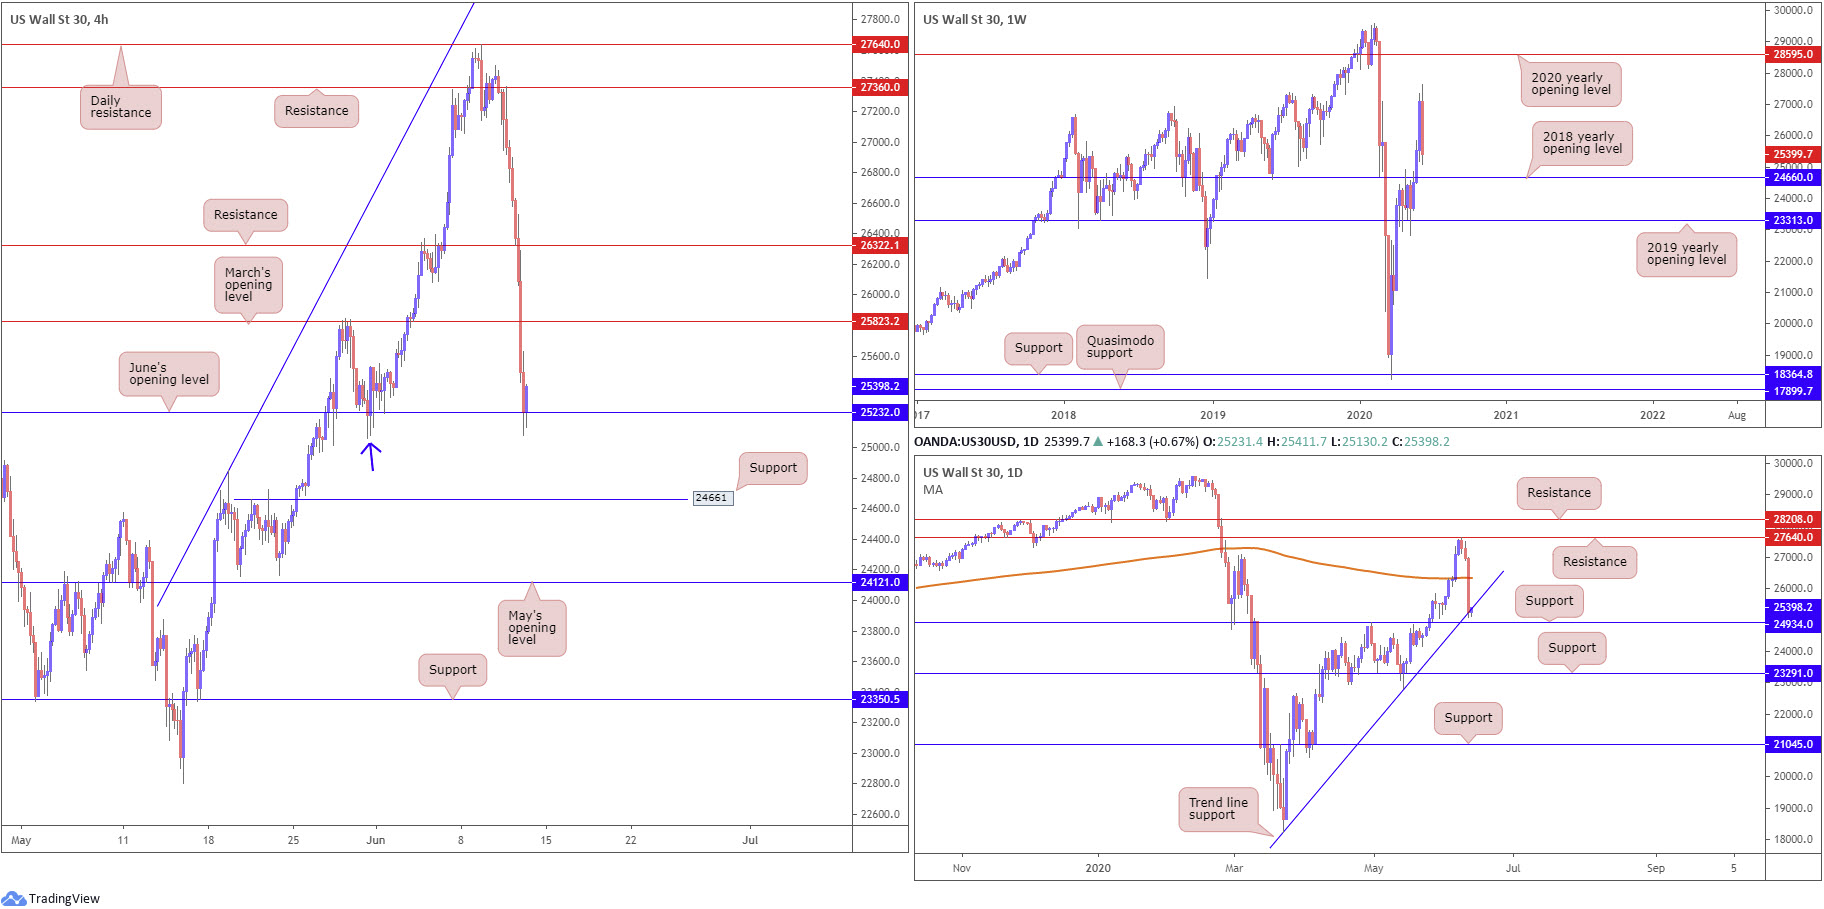
US equities plunged Thursday, marking the worst decline since March, weighed amid signs of COVID-19 cases accelerating. The Dow Jones Industrial Average dropped 1861.82 points, or 6.90%; the S&P 500 dipped 188.04 points, or 5.89%, and the tech-heavy Nasdaq 100 concluded lower by 505.78 points, or 5.01%.
Weekly price shows the recent downturn poured cold water on reaching the 2020 yearly opening level at 28595 (resistance) this week, settling Thursday just north of the 2018 yearly opening level at 24660 (support).
Elsewhere, daily flow, after topping just south of daily resistance at 27640 earlier in the week, Thursday hauled price through the 200-day SMA (orange – 26348) and landed things at trend line support, taken from the low 18213, sited ahead of support coming in at 24934.
On the H4 timeframe, Thursday concluded punching into support at 25232, shaped in the form of June’s opening level. In similar fashion to May’s retest (blue arrow), price action is holding the level for the time being. Continued bidding from here has March’s opening level at 25823 set as a potential upside hurdle, while breaching current support throws support at 24661 in the pot (prior Quasimodo resistance).
Areas of consideration:
Extending recovery gains off 25232 on the H4 is a possibility today, having noted daily trend line support recently entering the fight, targeting 25823.
Breaking 25232, according to daily support at 24934, offers limited room for breakout sellers to work with.
H4 support at 24661 is interesting, owing to the level melting with weekly support at 24660 (2018 yearly opening level).
XAU/USD (GOLD):
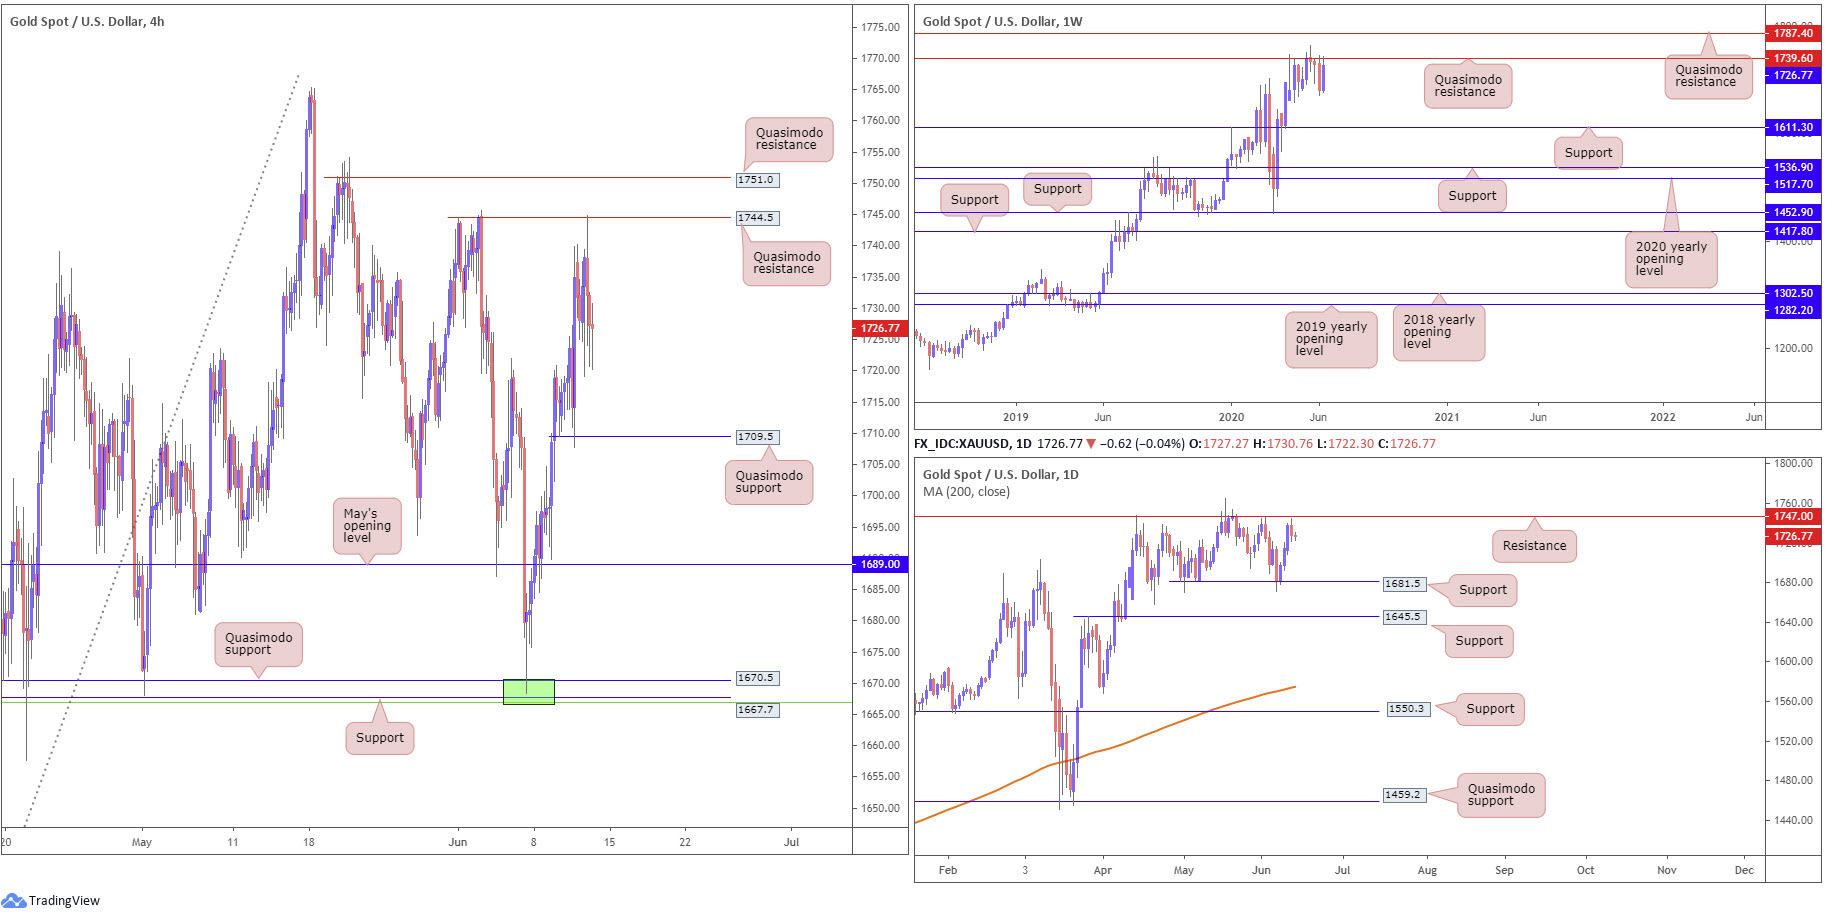
The price of gold, in $ terms, dipped to settle at $1727.3 Thursday, snapping a 3-day winning streak off H4 Quasimodo resistance at 1744.5. Initial upside gleaned support on the back of risk aversion.
Downside on the H4 targets another Quasimodo support positioned at 1709.5, with a break unmasking May’s opening level at 1689.0. To the upside, another Quasimodo resistance resides at 1751.0.
What’s also interesting is weekly price reconnected with a Quasimodo resistance level at 1739.6, sited under another layer of Quasimodo resistance at 1787.4. At the same time, daily price topped a few pips ahead of resistance coming in at 1747.0, opening up the possibility of drawing in support at 1681.5.
Areas of consideration:
Although the trend has faced north since 2016, all the while weekly Quasimodo resistance remains intact, this will likely turn away prospective buyers.
One possible scenario for sellers on the H4 timeframe today is a pop above current Quasimodo resistance at 1744.5 to Quasimodo resistance at 1751.0, consequently drawing in daily resistance at 1747.0. H4 Quasimodo support at 1709.5 rests as an initial target in this case.
Alternatively, a break under 1709.5 today may clear the pathway south to May’s opening level at 1689.0, highlighting intraday bearish themes.
The accuracy, completeness and timeliness of the information contained on this site cannot be guaranteed. IC Markets does not warranty, guarantee or make any representations, or assume any liability regarding financial results based on the use of the information in the site.
News, views, opinions, recommendations and other information obtained from sources outside of www.icmarkets.com.au, used in this site are believed to be reliable, but we cannot guarantee their accuracy or completeness. All such information is subject to change at any time without notice. IC Markets assumes no responsibility for the content of any linked site.
The fact that such links may exist does not indicate approval or endorsement of any material contained on any linked site. IC Markets is not liable for any harm caused by the transmission, through accessing the services or information on this site, of a computer virus, or other computer code or programming device that might be used to access, delete, damage, disable, disrupt or otherwise impede in any manner, the operation of the site or of any user’s software, hardware, data or property.


