
DXY:
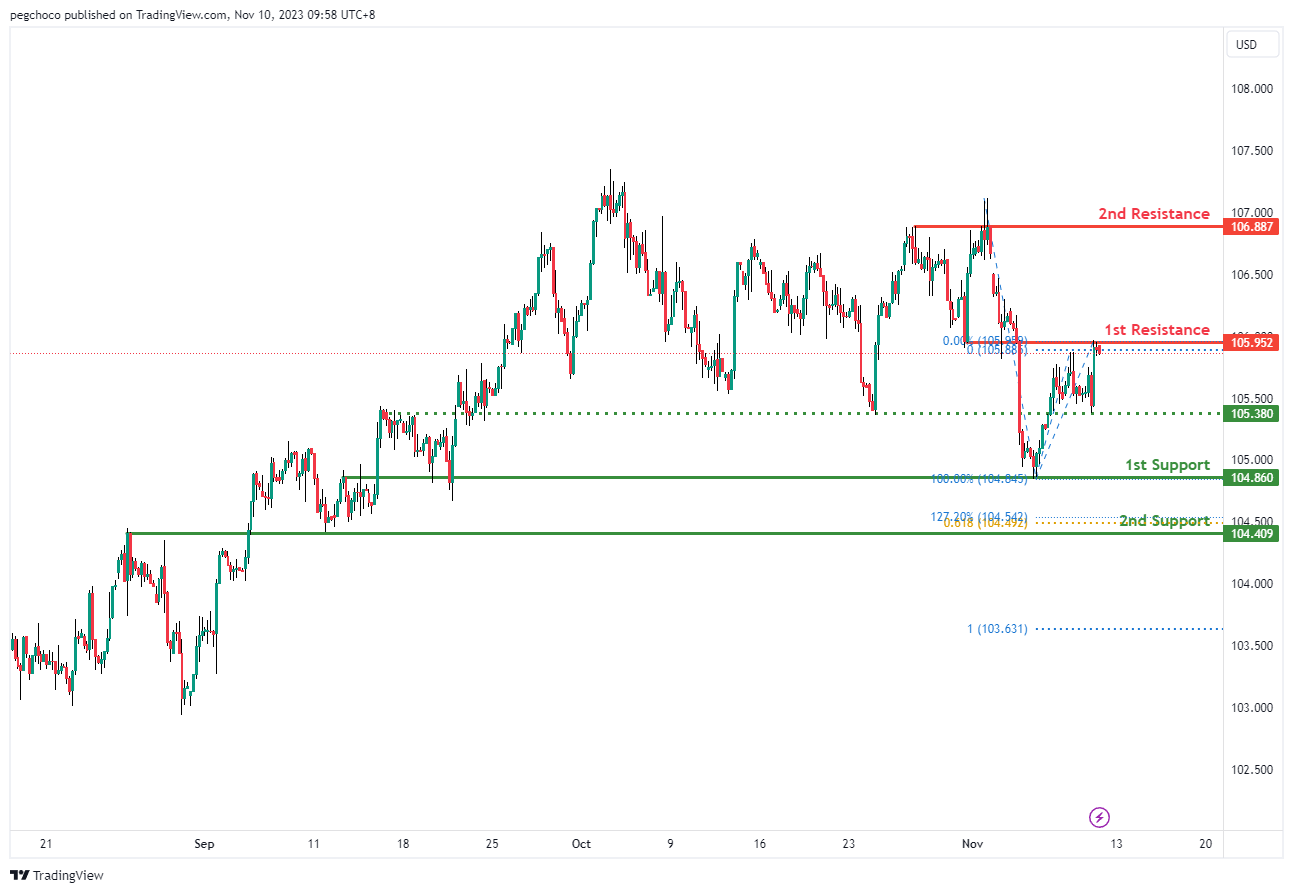
The DXY (US Dollar Index) chart currently maintains a bearish overall momentum, suggesting the potential for a bearish reaction off the 1st resistance level and a subsequent drop towards the 1st support level.
The 1st support at 104.86 is identified as an overlap support, indicating it has previously acted as a level where buying interest has emerged. Additionally, the presence of the 127.20% Fibonacci Extension and the 61.80% Fibonacci Projection at this level indicates Fibonacci confluence, further reinforcing its significance as a potential support level.
The 2nd support at 104.40 is also noted as an overlap support, adding to the potential support zones for DXY.
On the resistance side, the 1st resistance at 105.95 is categorized as an overlap resistance, and it’s the first level where price may encounter selling pressure as it attempts to move higher.
The 2nd resistance at 106.88 is characterized as a multi-swing high resistance, indicating it is a significant obstacle to upward movement.
Intermediate support at 105.38 is noted as a pullback support, adding to the potential areas where price might find support during a bearish move.
EUR/USD:
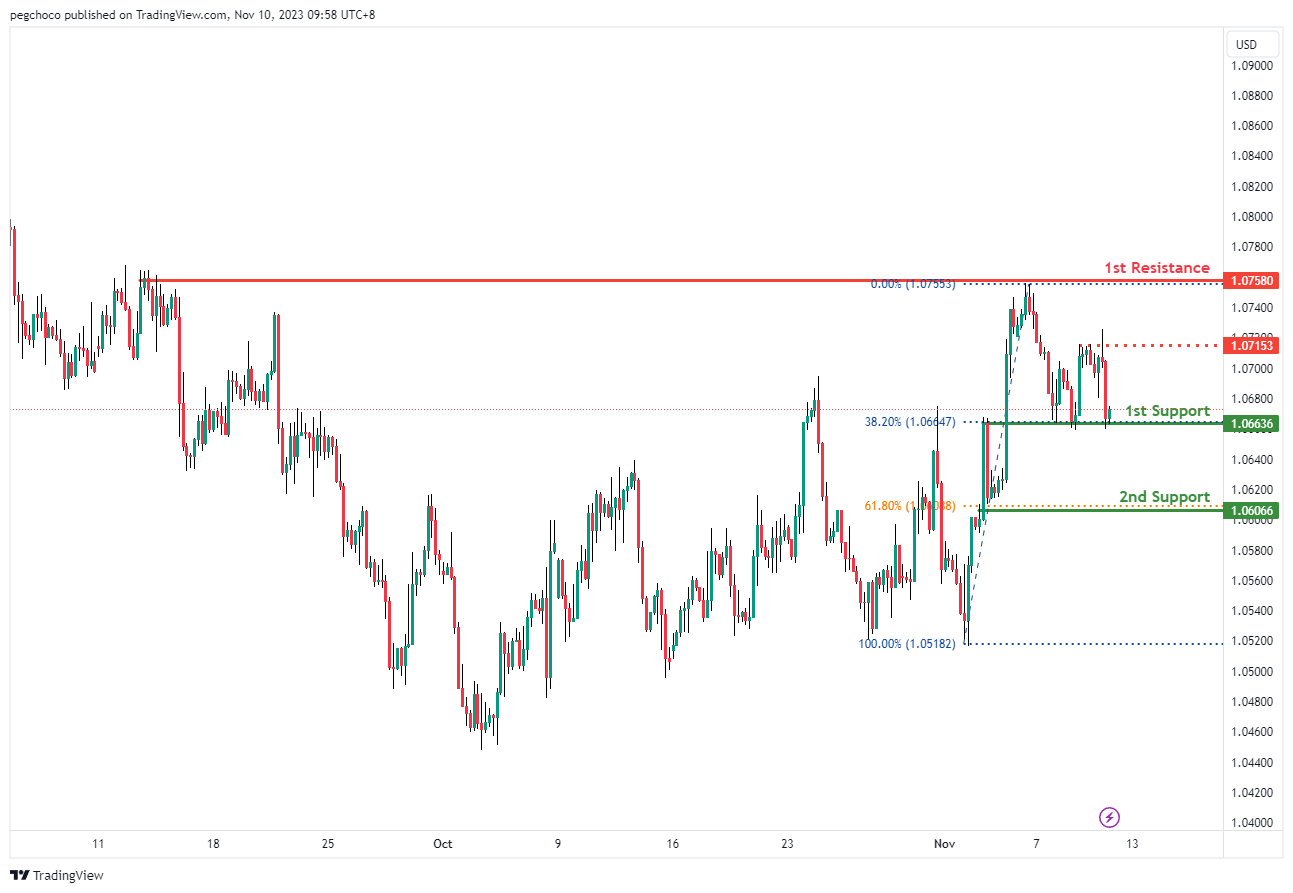
The EUR/USD chart currently has a bullish overall momentum, suggesting the potential for a bullish bounce off the 1st support level, which could lead the price towards the 1st resistance level.
1st support at 1.0663 is identified as an overlap support, indicating it has previously acted as a level where buying interest has been observed. Additionally, the presence of the 38.20% Fibonacci Retracement at this level adds to its significance as a potential support level.
The 2nd support at 1.0606 is noted as a 61.80% Fibonacci Retracement, further reinforcing its potential as a support level.
On the resistance side, the 1st resistance at 1.0758 is categorized as a multi-swing high resistance, and it’s the first level where price may encounter selling pressure as it attempts to move higher.
Intermediate resistance at 1.0715 is noted as a pullback resistance, indicating another potential area where the price might find resistance during its bullish move.
EUR/JPY:
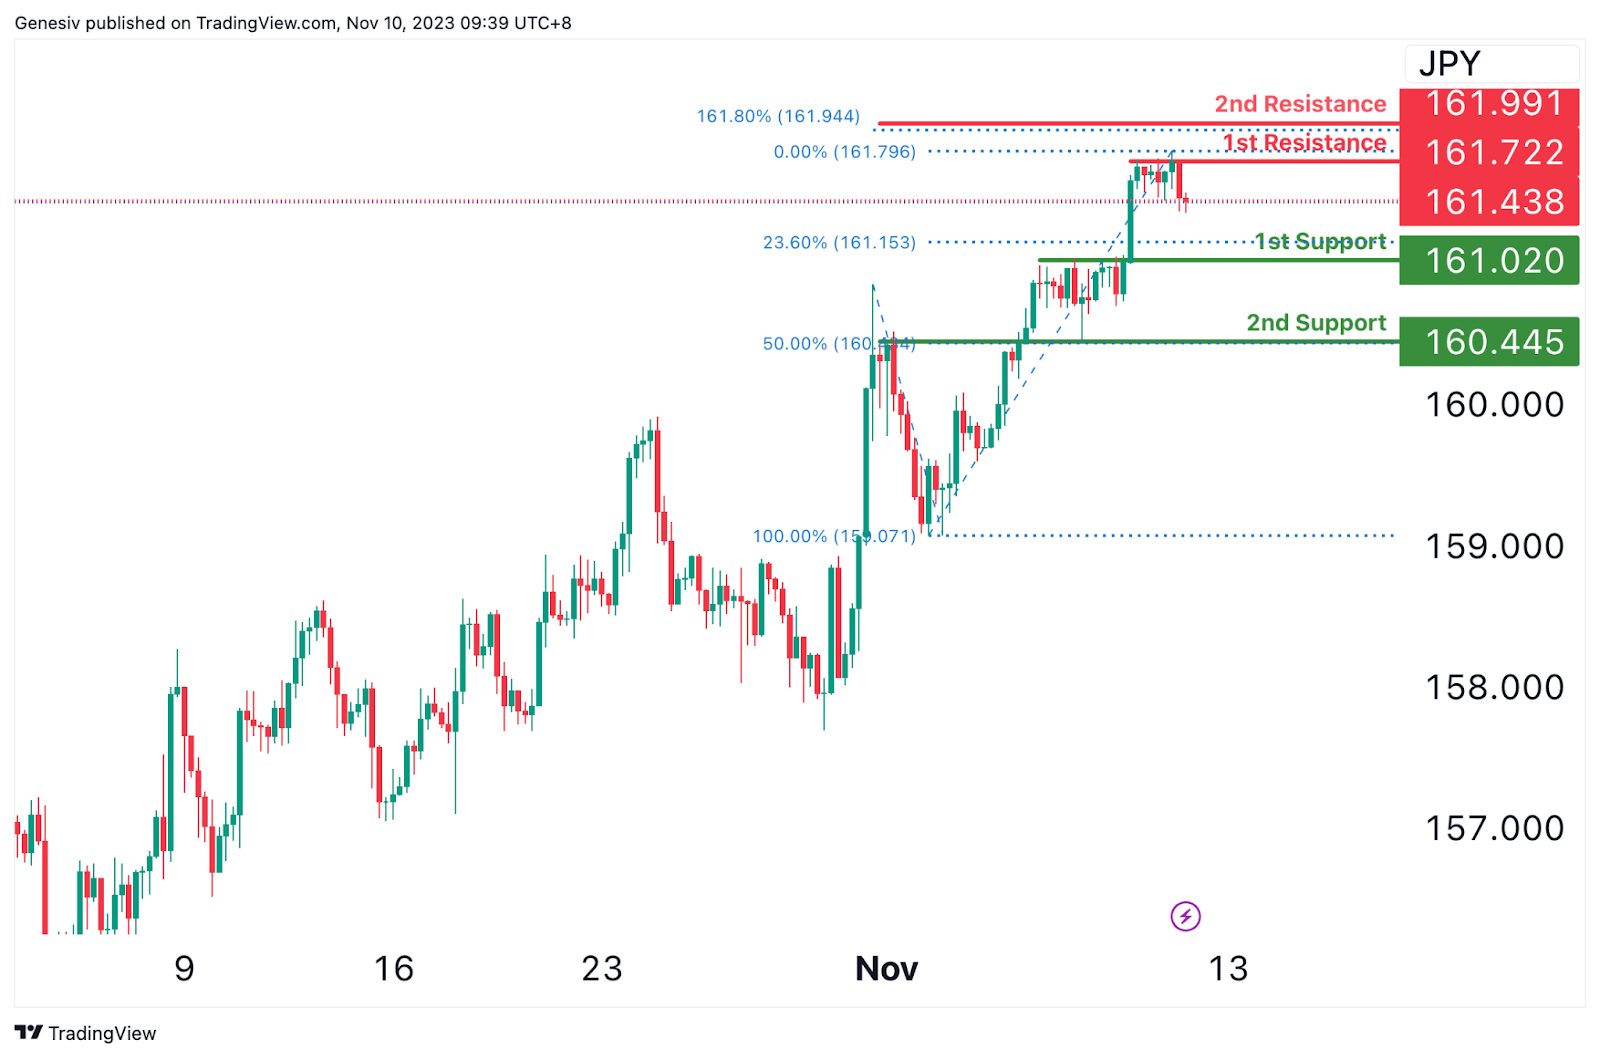
The EUR/JPY chart currently reflects a bearish momentum, indicating a potential bearish continuation towards the first support level at 161.02. This support level is recognized as a pullback support, coinciding with the 23.60% Fibonacci Retracement, potentially serving as a key area for a price rebound.
Additionally, the second support at 160.44 is identified as an overlap support, associated with the 50% Fibonacci Retracement level, further strengthening its significance as a potential area for price support.
On the other hand, the first resistance at 161.72 represents a point of multi-swing high resistance, indicating a significant barrier for the price to overcome. Furthermore, the second resistance at 161.99 aligns with the 161.80% Fibonacci Extension, marking another level where the price might face resistance within its downward movement.
EUR/GBP:
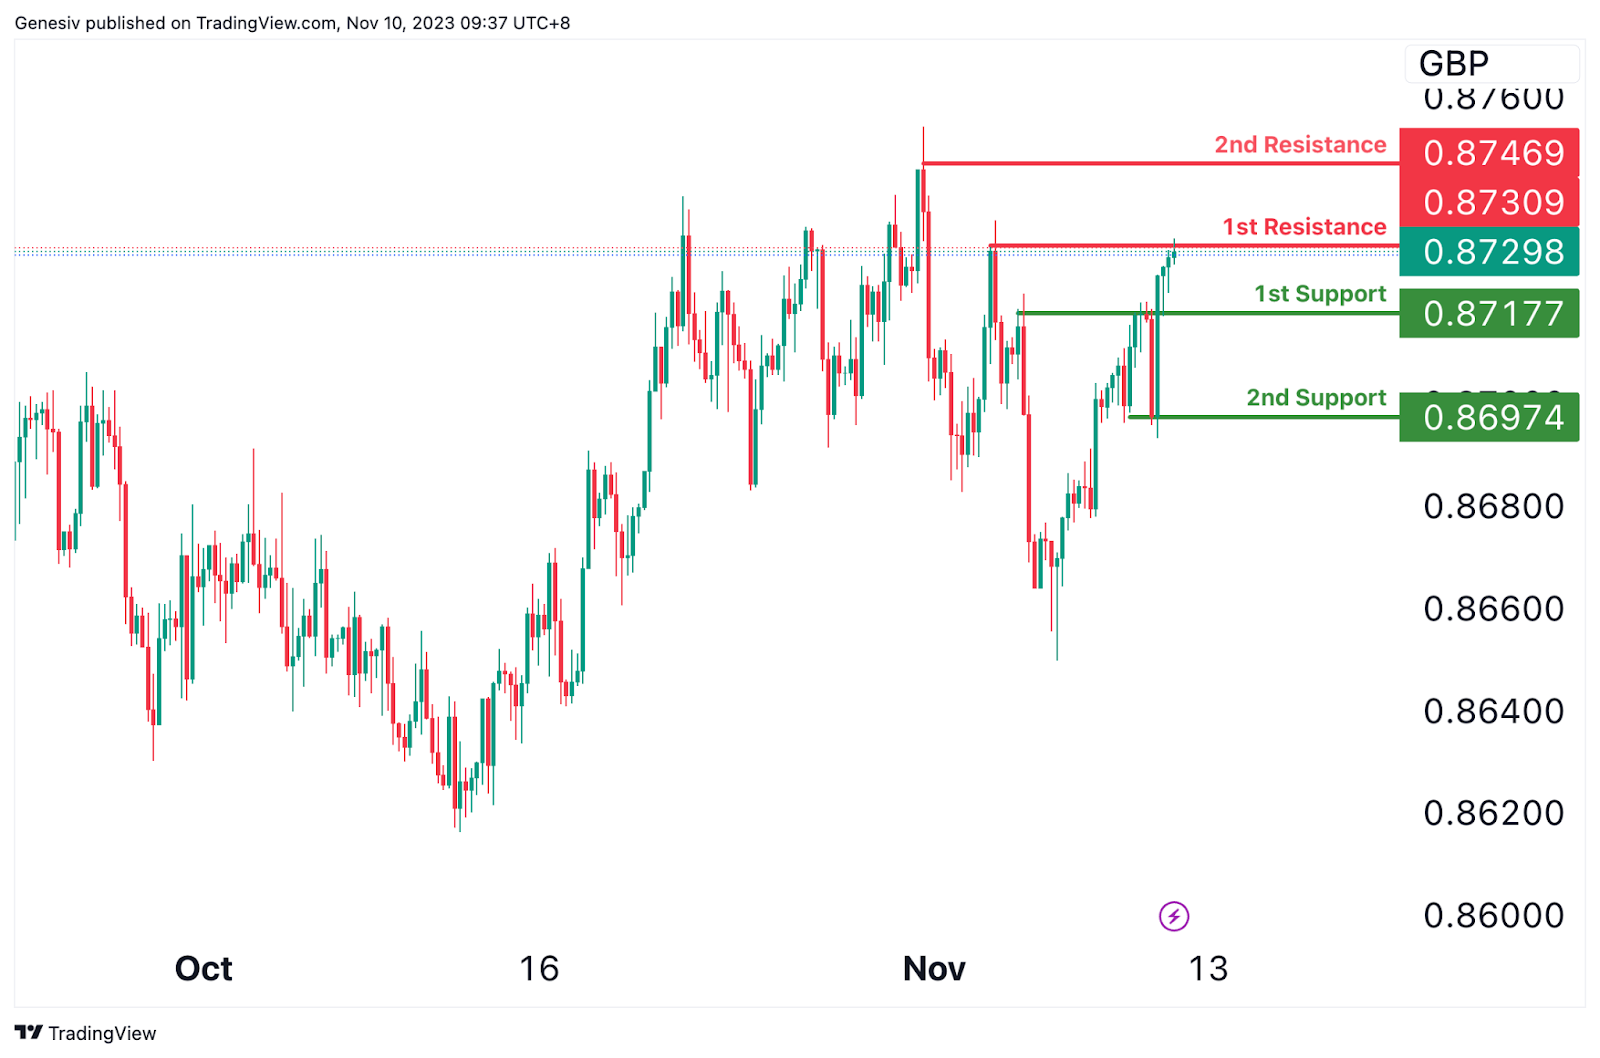
The EUR/GBP chart currently indicates a bullish momentum, suggesting a potential bullish break through the first resistance at 0.8730, leading the price to rise towards the second resistance at 0.8746.
The first support level at 0.8717 is identified as a pullback support, offering a foundational level for potential price rebounds. Additionally, the second support at 0.8697 holds significance as a swing low support, further reinforcing its potential to provide a supportive base for the price.
On the upside, the first resistance level at 0.8730 represents a point of swing high resistance, suggesting a notable hurdle that the price might break through. The second resistance at 0.8746 also marks a swing high resistance level, signifying another potential point where the price might face resistance within its upward movement.
.
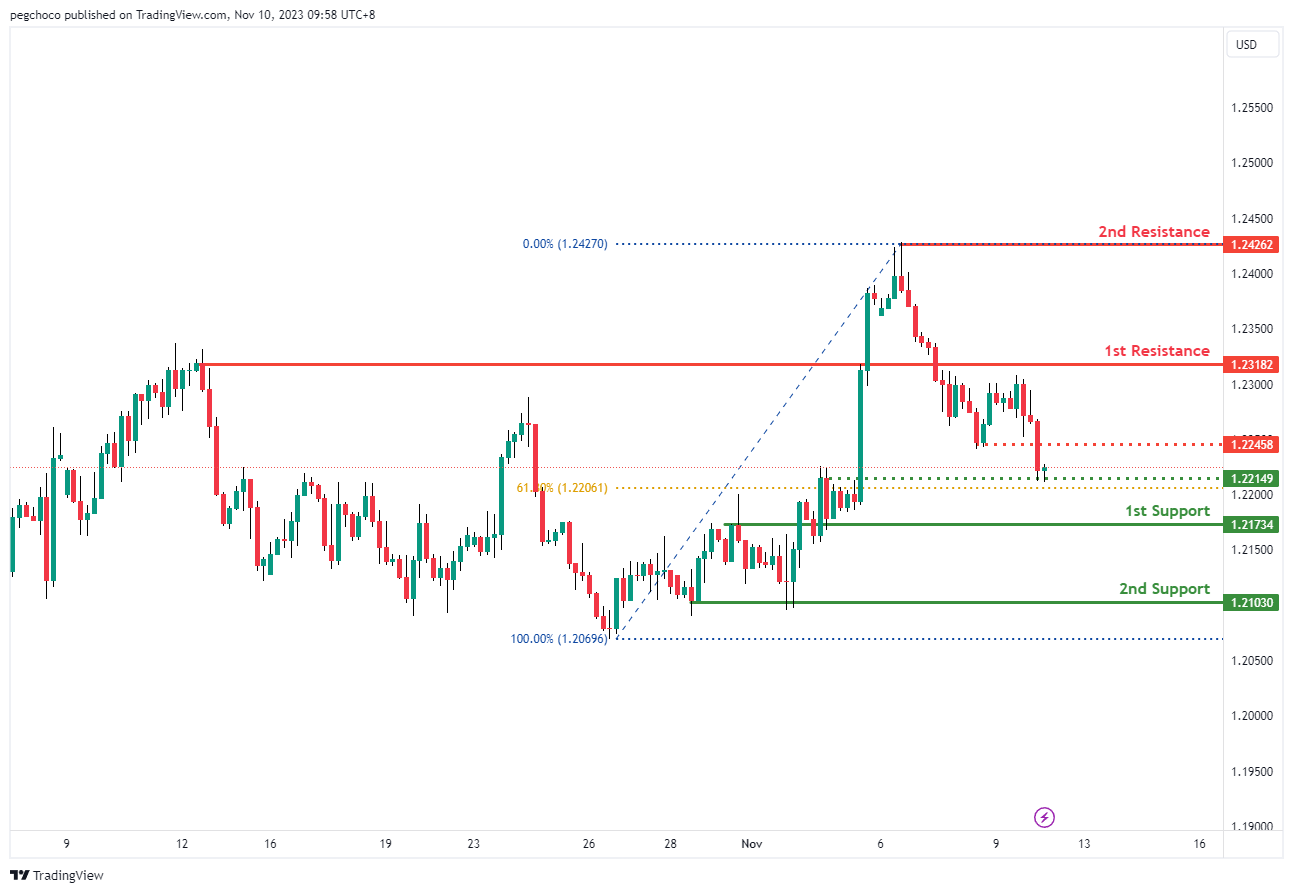
GBP/USD:
The GBP/USD chart currently exhibits a bullish overall momentum, suggesting the potential for a bullish bounce off the 1st support level, which could propel the price towards the 1st resistance level.
1st support at 1.2173 is identified as an overlap support, indicating it has previously served as a level where buying interest has been observed. This makes it a significant potential support level for the price.
The 2nd support at 1.2103 is noted as a multi-swing low support, further reinforcing its potential as a support level.
On the resistance side, the 1st resistance at 1.2318 is categorized as a pullback resistance, and it’s the first level where price may encounter selling pressure as it attempts to move higher.
The 2nd resistance at 1.2426 is identified as a swing high resistance, indicating another potential area where the price might face obstacles in its bullish movement.
Intermediate resistance at 1.2245 is also noted as a pullback resistance, adding to the potential areas where the price might find resistance.
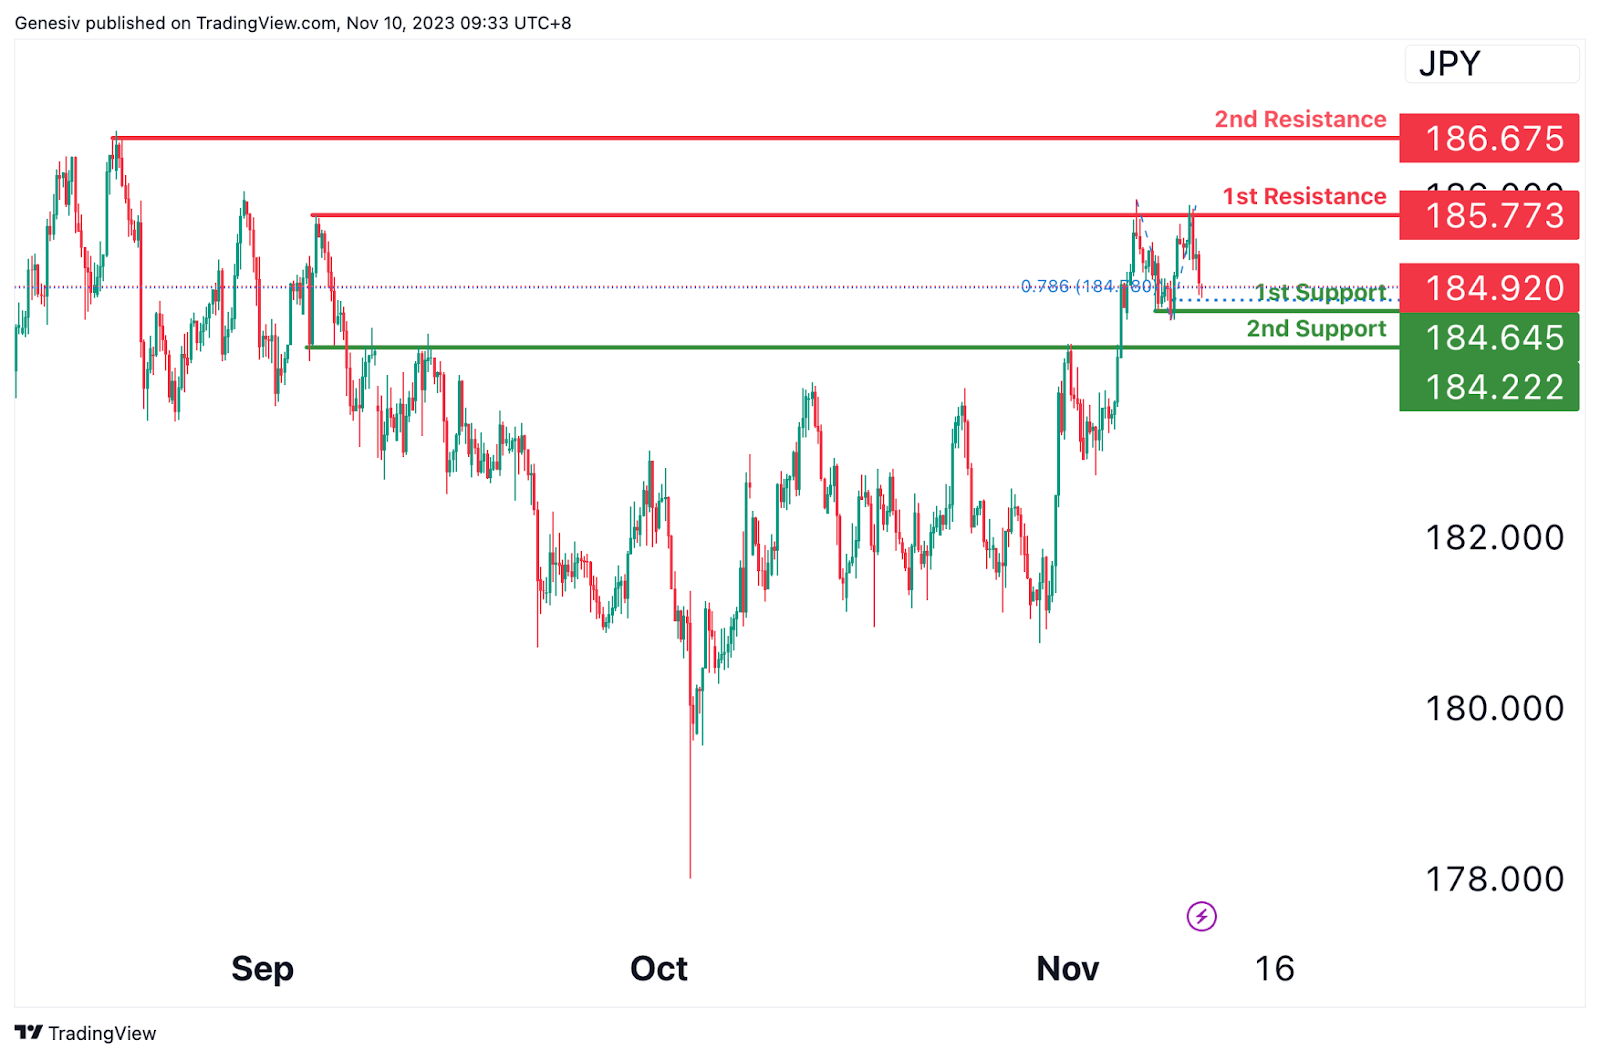
GBP/JPY:
The GBP/JPY chart currently reflects a bullish momentum, indicating a potential bullish bounce at the first support level of 184.64. This level is significant as a swing low support and aligns with the 78.60% Fibonacci Projection. Additionally, the second support at 184.22 is identified as a pullback support.
On the upward side, the first resistance at 185.77 is recognized as a point of multi-swing high resistance, which might pose a significant hurdle for the price. Furthermore, the second resistance at 186.67 is characterized by its significance as a swing high resistance, indicating another level where the price might face resistance within its upward movement.
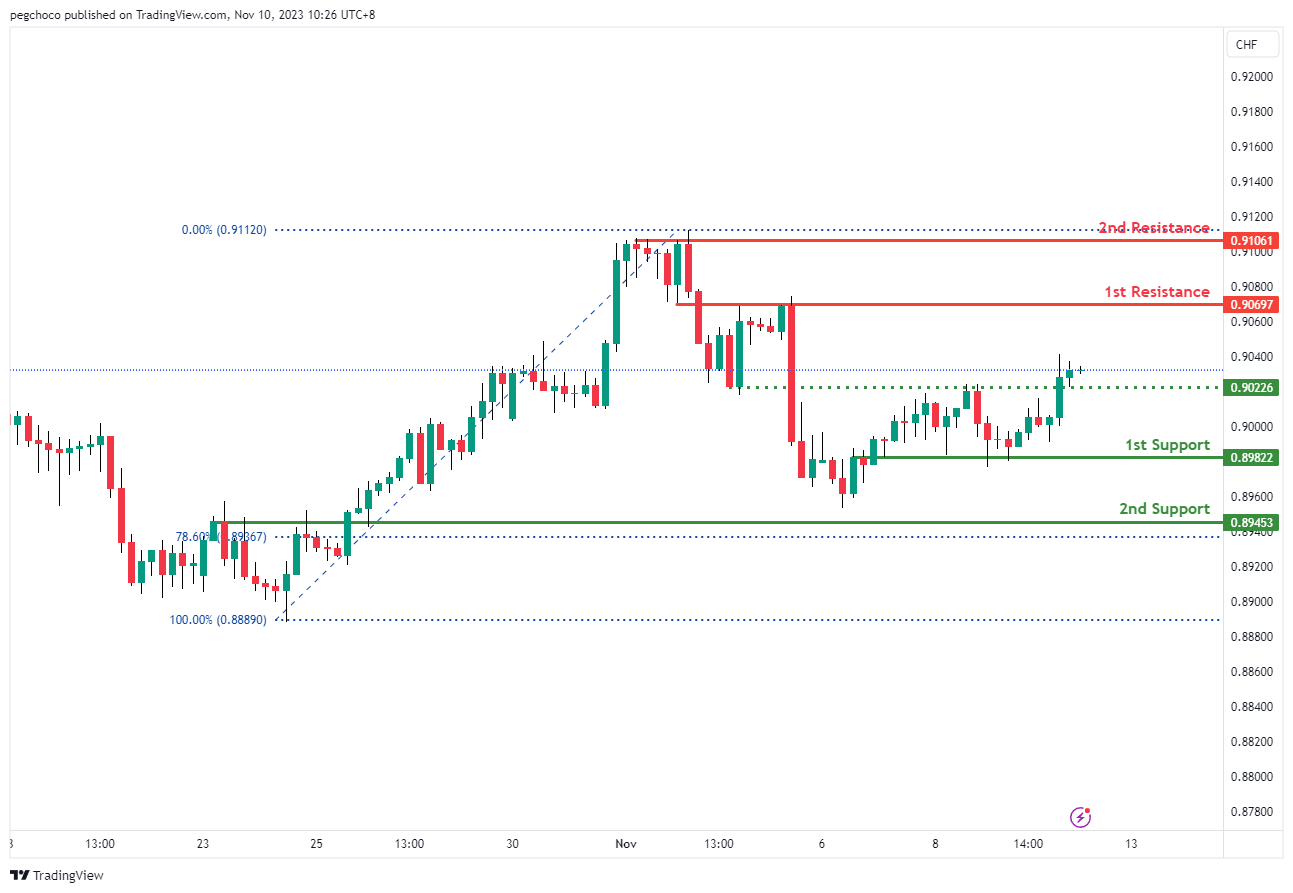
USD/CHF:
The USD/CHF chart currently has a bullish overall momentum, suggesting the potential for a bullish continuation towards the 1st resistance level.
1st support at 0.8982 is identified as an overlap support, indicating it has previously acted as a level where buying interest has been observed. This makes it a significant potential support level for the price.
The 2nd support at 0.8945 is noted as an overlap support as well, and it’s further reinforced by the presence of the 78.60% Fibonacci Retracement level, making it another important support level to watch.
On the resistance side, the 1st resistance at 0.9069 is categorized as an overlap resistance, suggesting it could be a level where the price may face selling pressure as it attempts to move higher.
The 2nd resistance at 0.9106 is identified as a multi-swing high resistance, indicating another potential area where the price might encounter obstacles in its bullish movement.
.
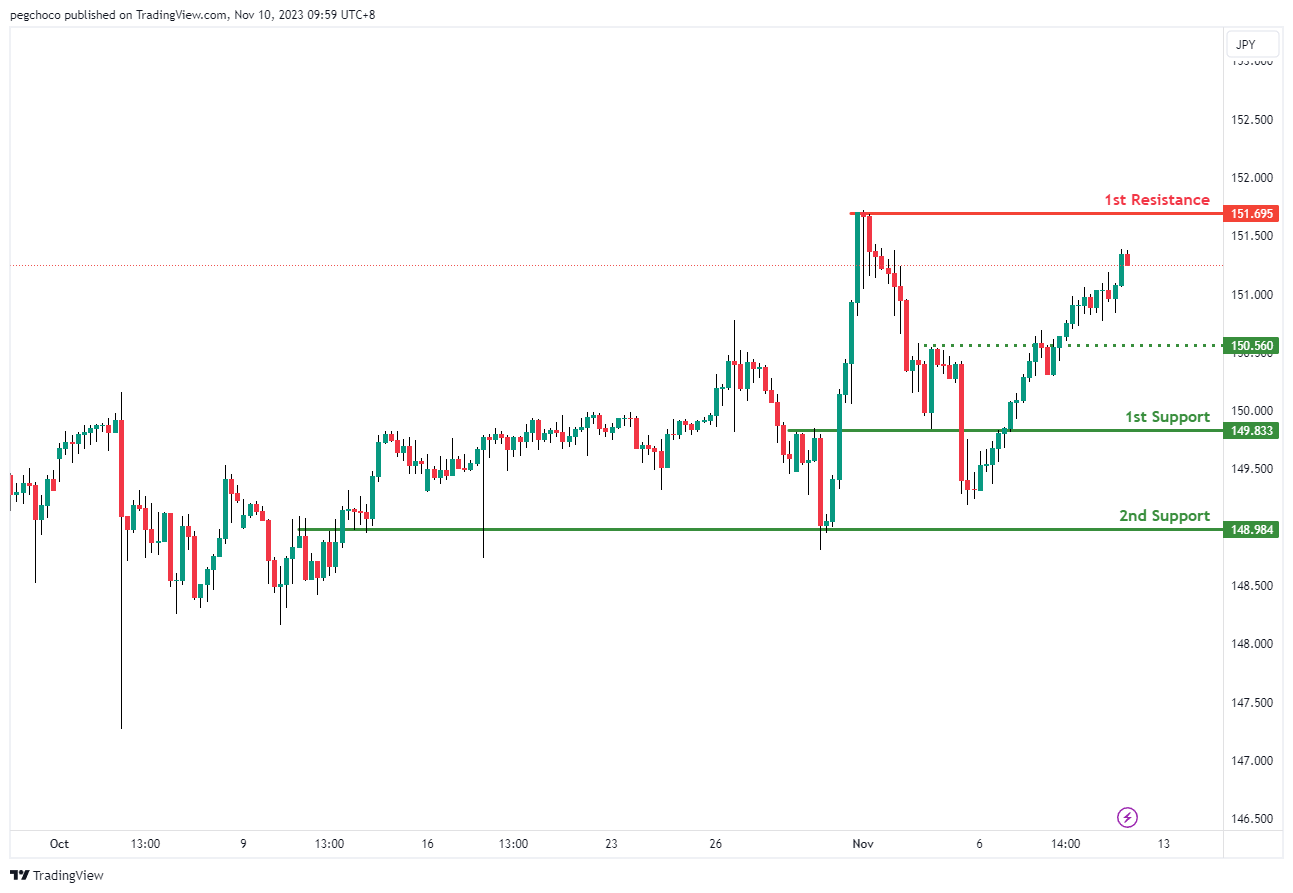
USD/JPY:
The USD/JPY chart currently has a bullish overall momentum, suggesting the potential for a bullish continuation towards the 1st resistance level.
1st support at 149.83 is identified as a pullback support, indicating it could be a significant level where the price might find buying interest. This support level suggests that there could be demand for the currency pair at this point.
The 2nd support at 148.98 is considered an overlap support, further reinforcing its potential as a support level. Overlap support levels often have historical significance and can act as strong areas of support.
On the resistance side, the 1st resistance at 151.71 is categorized as a swing high resistance, indicating it could act as a level where the price may face selling pressure as it attempts to move higher.
Intermediate support at 150.56 is noted as a pullback support, adding to the potential areas where the price might find support during its bullish continuation.
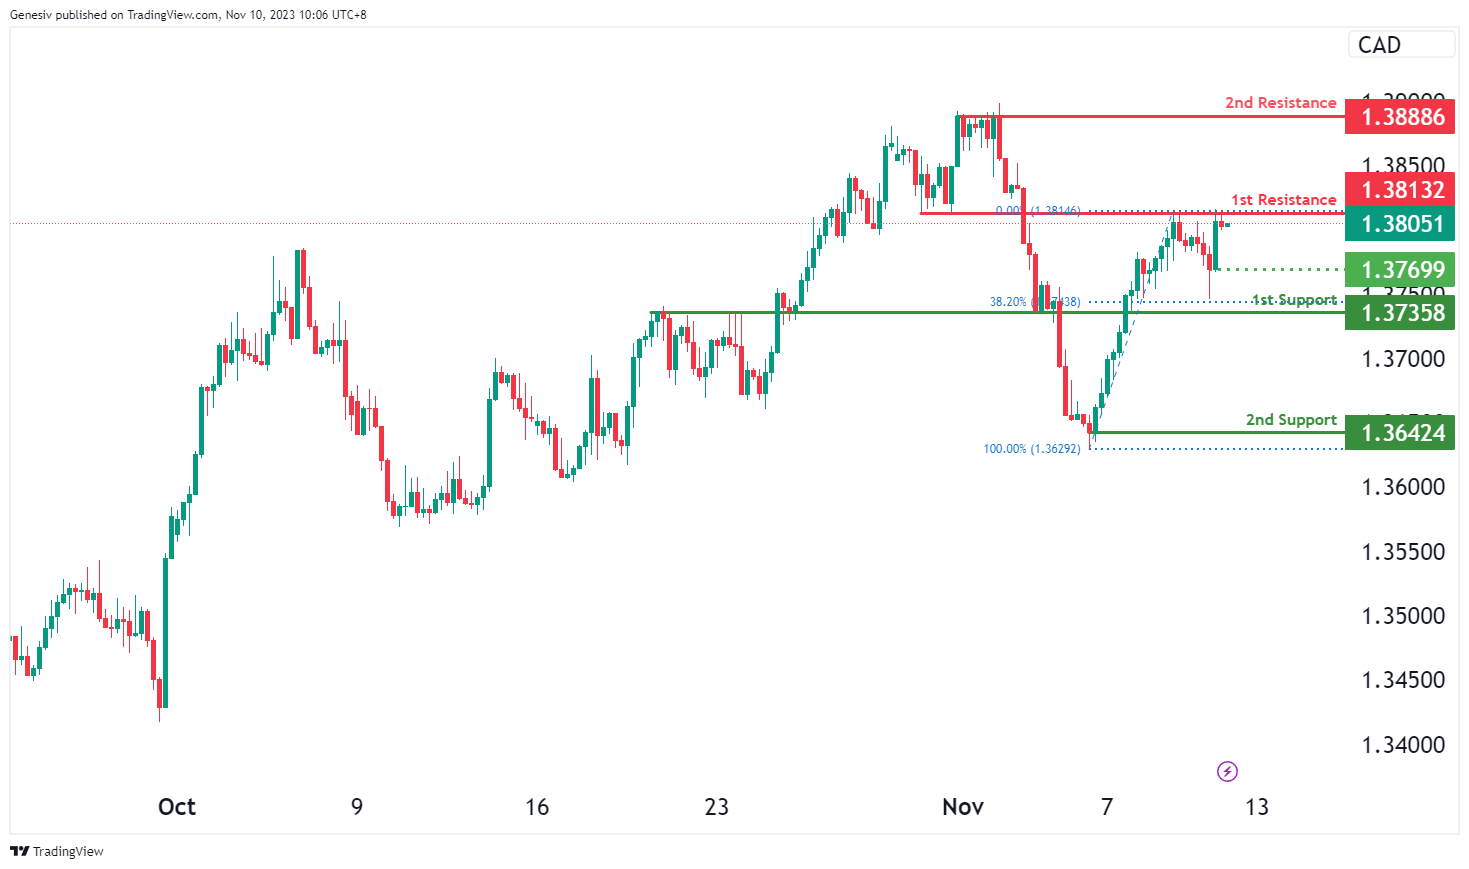
USD/CAD:
The USD/CAD chart is currently exhibiting an overall bullish momentum, indicating a potential for price to make a bullish continuation towards the 1st resistance.
The 1st resistance level at 1.3813 is identified as an overlap resistance. Higher up, the 2nd resistance level at 1.3889 is marked as a pullback resistance, suggesting that it may act as a strong resistance zone.
To the downside, the intermediate support level at 1.3769 is identified as a pullback support while the 1st support level at 1.3736 is noted as an overlap support that aligns with the 38.20% Fibonacci retracement level. Further below, the 2nd support level at 1.3642 is marked as a swing-low support, adding to its potential as a level where price could find support.
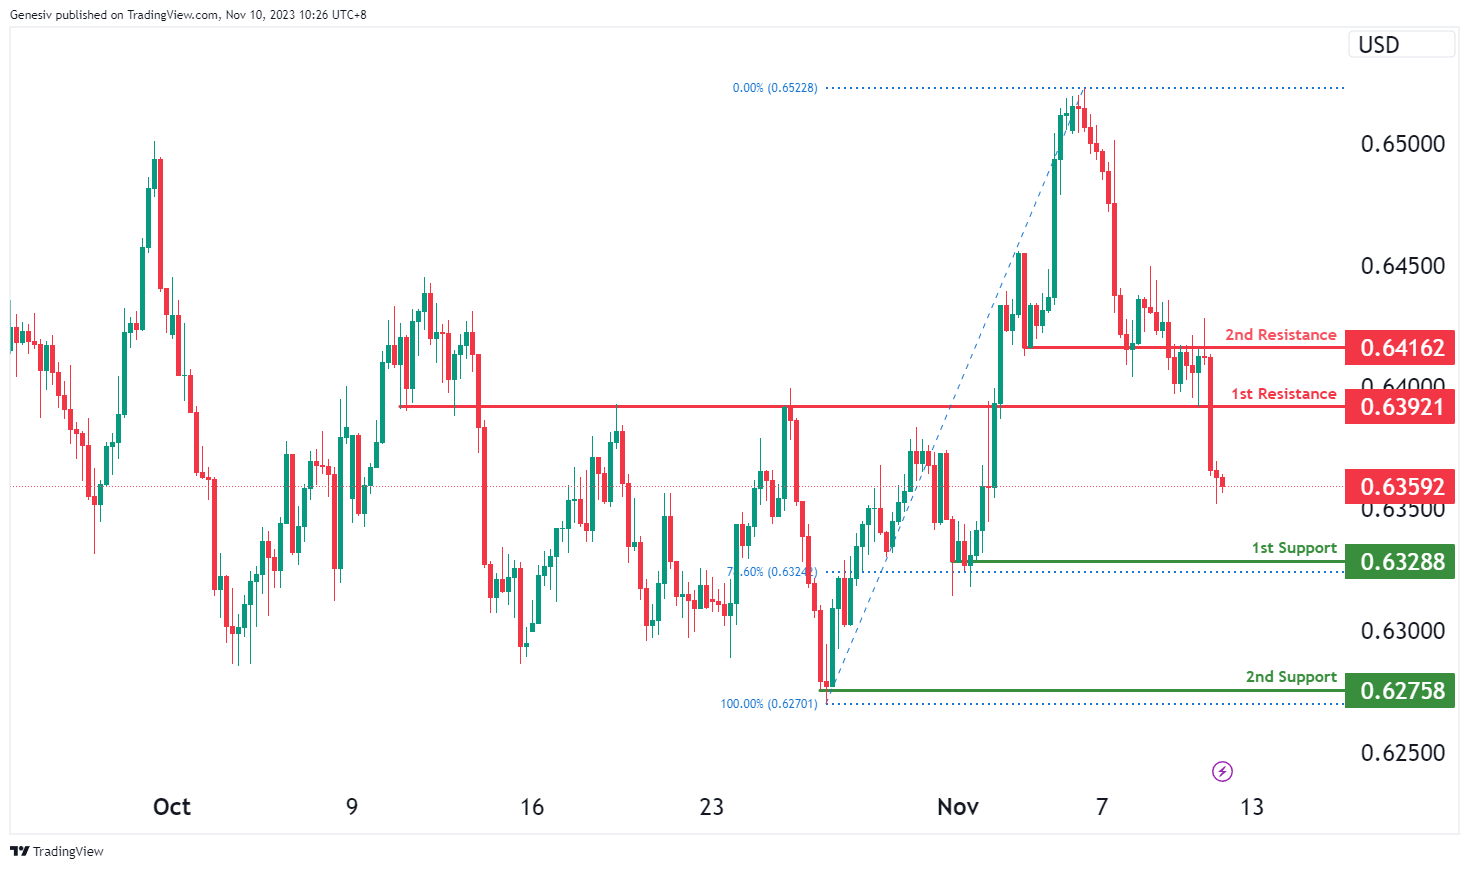
AUD/USD:
The AUD/USD chart is currently characterized by an overall bearish momentum. There is potential for price to make a bearish continuation towards the 1st support.
The 1st support level at 0.6329 is idenitfied as a pulllback support that aligns with the 78.60% Fibonacci retracement level. Further below, the 2nd support level at 0.6276 is also noted as a pullback support, reinforcing its potential as a level of support for the price.
On the resistance side, the 1st resistance level at 0.6392 is identified as an overlap resistance. Additionally, the 2nd resistance level at 0.6416 is also marked as an overlap resistance, indicating another potential obstacle for the price’s upward movement.
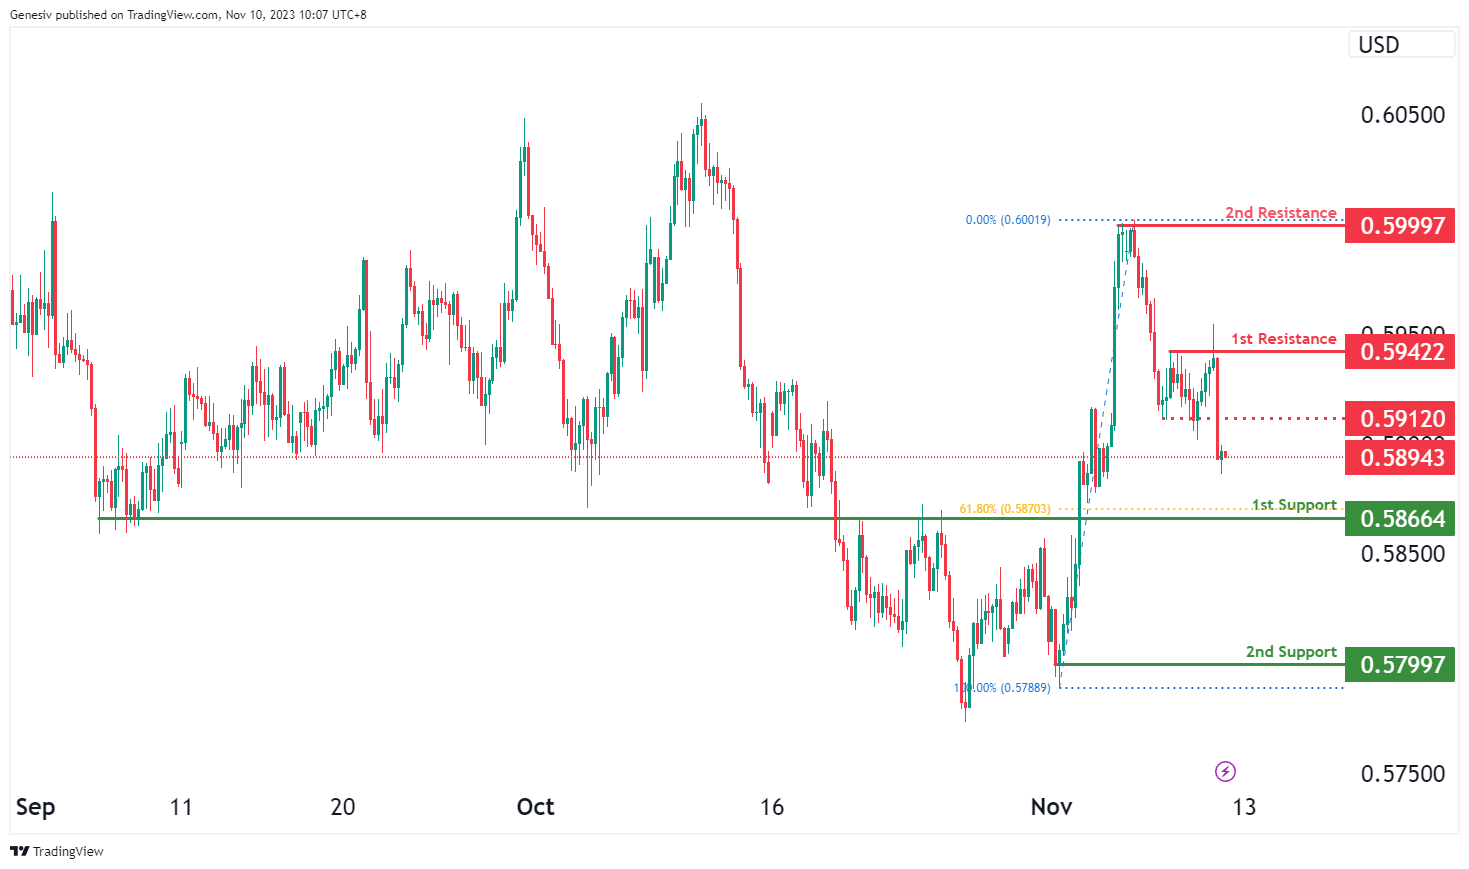
NZD/USD
The NZD/USD chart is currently characterized by an overall bearish momentum. There is potential for price to make a bearish continuation towards the 1st support.
The 1st support level at 0.5866 is identified as an overlap support that aligns with the 61.80% Fibonacci retracement level. Further below, the 2nd support level at 0.5799 is marked as a swing-low support, reinforcing its potential significance as a level of support.
On the resistance side, the intermediate resistance level at 0.5912 is identified as a pullback resistance while the 1st resistance level at 0.5942 is also noted as a pullback resistance. Higher up, the 2nd resistance level at 0.5999 is marked as a swing-high resistance, indicating another potential level where the price may face obstacles in its upward movement.
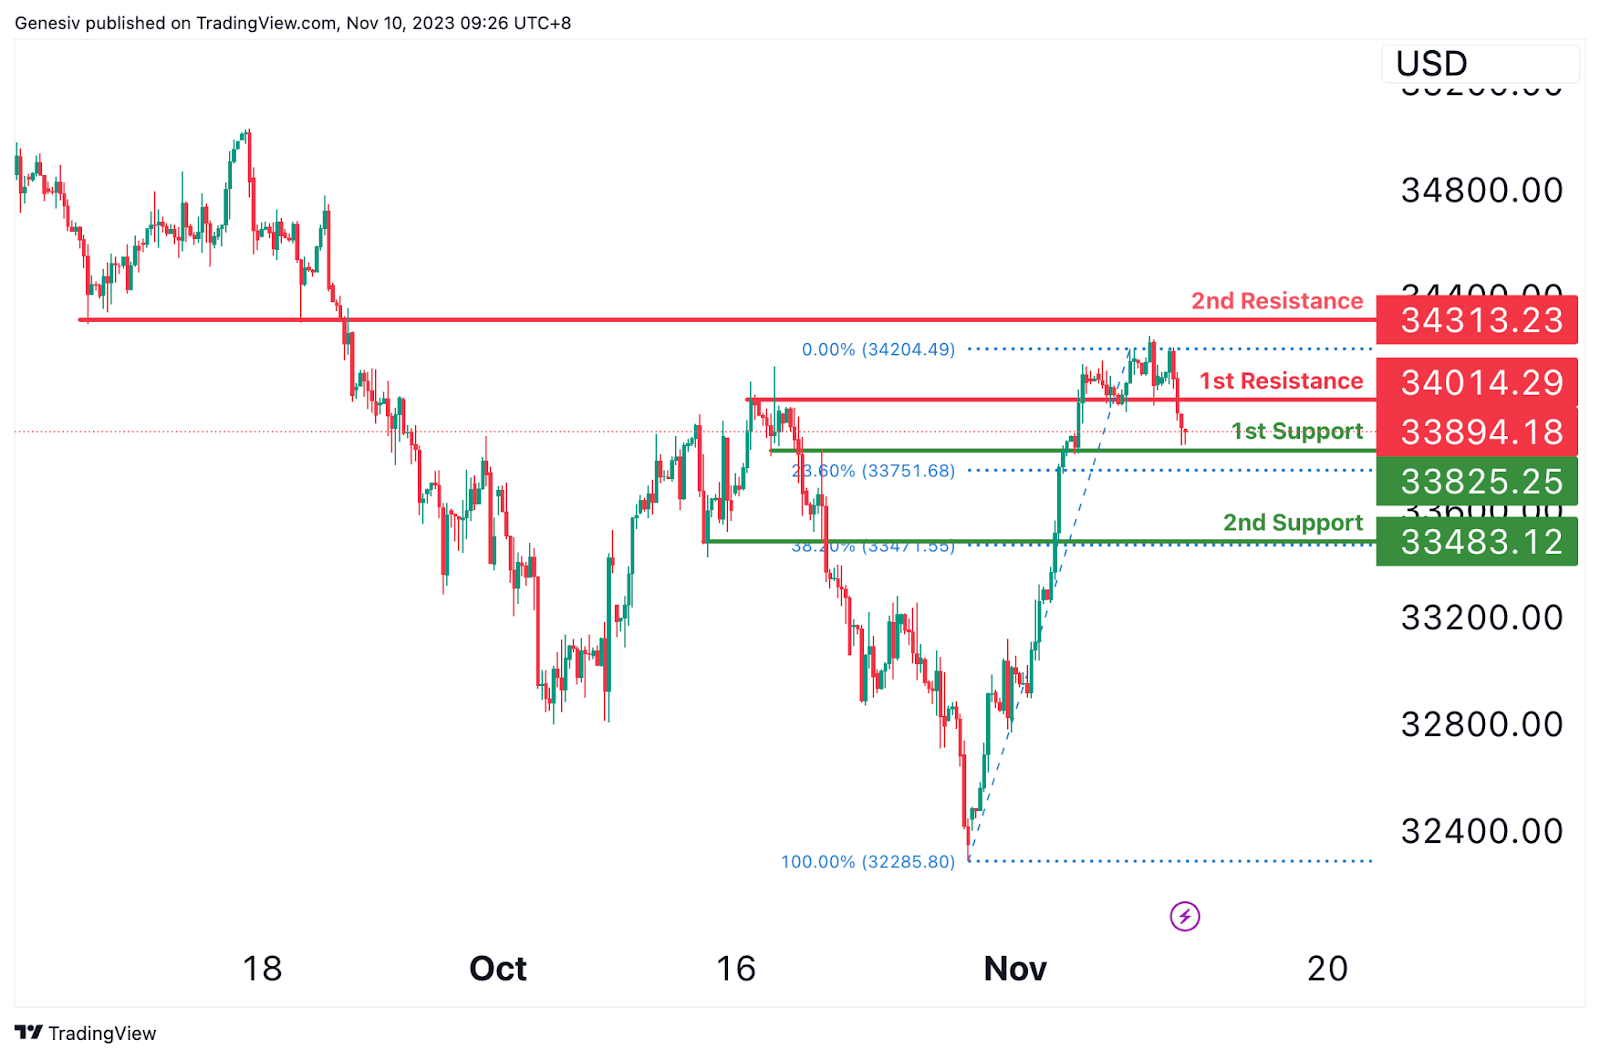
DJ30:
The DJ30 chart currently presents a bullish momentum, indicating a potential bullish bounce at the first support level of 33825.25, noted as an overlap support at the 23.60% Fibonacci Retracement. This bounce could drive the price towards the first resistance at 34014.29, recognized as a point of pullback resistance. Additionally, the second support at 33483.12 is identified as a pullback support at the 38.20% Fibonacci Retracement level. The second resistance level of 34313.23 also stands as a point of pullback resistance. These levels signal potential points where the price might face significant rebounds or obstacles within its upward movement.
GER40:
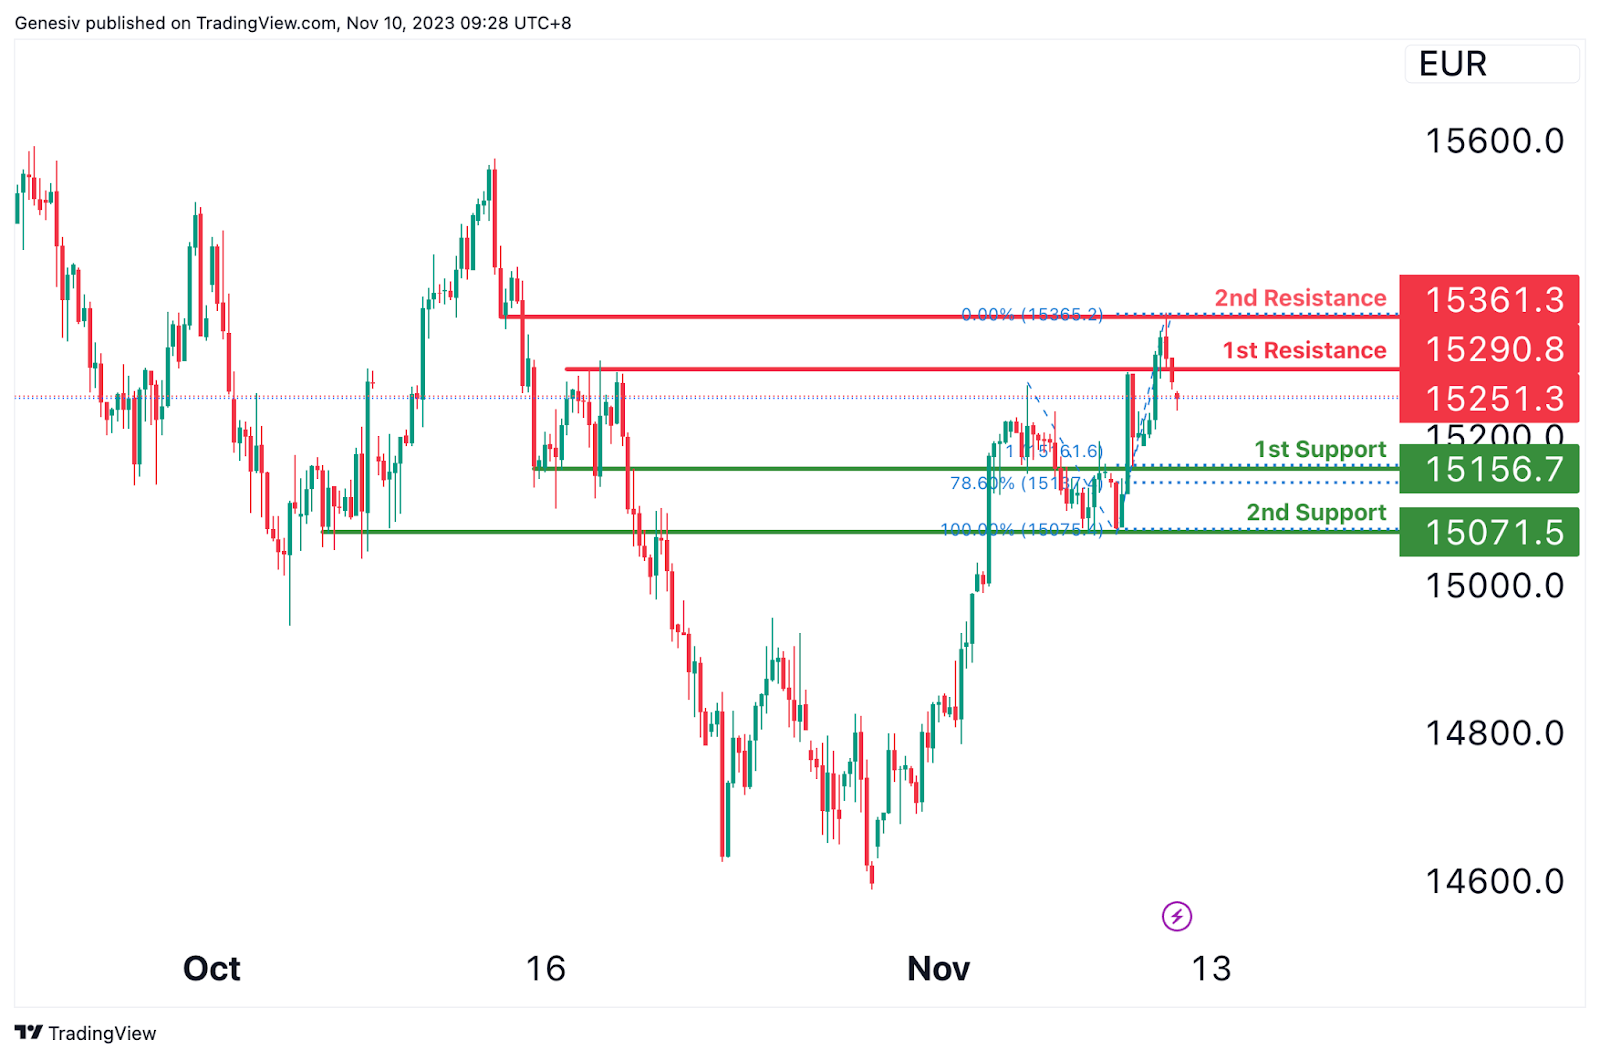
The GER40 chart currently demonstrates a bearish momentum, suggesting a potential bearish continuation towards the first support at 15156.70. This level is significant as an overlap support and demonstrates confluence between the 78.60% Fibonacci Retracement and the 100% Fibonacci Projection. Additionally, the second support at 15071.50 is also noted as an overlap support.
On the flip side, the first resistance at 15290.80 serves as a point of pullback resistance, while the second resistance at 15361.30 is characterized as an overlap resistance. These resistance levels are potential areas where the price might encounter hurdles or reversals within its downward movement.
`US500
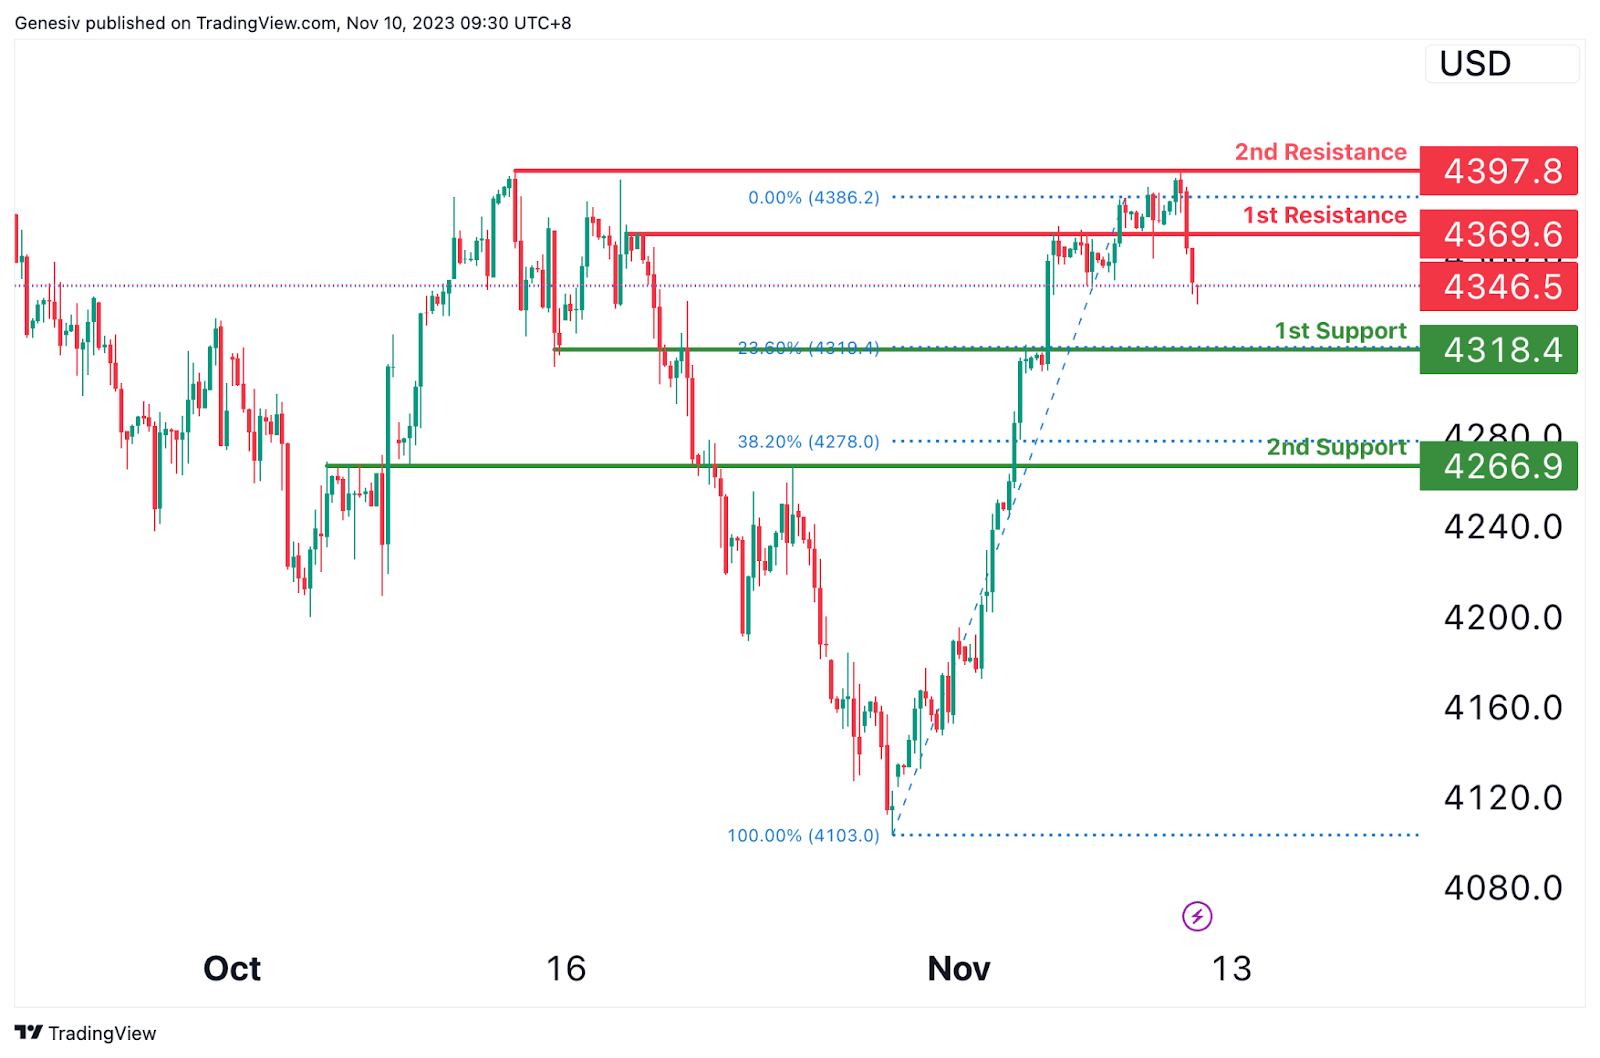
The US500 chart is currently indicating a bearish momentum, suggesting a potential bearish continuation towards the first support level at 4318.4. This level is identified as a pullback support, marked by the 23.60% Fibonacci Retracement. Additionally, the second support at 4266.9 is noted as another pullback support, associated with the 38.20% Fibonacci Retracement level.
Regarding resistance, the first resistance at 4369.6 is recognized as a point of pullback resistance. Furthermore, the second resistance at 4397.8 stands as a multi-swing high resistance level, indicating significant barriers where the price might encounter hurdles or reversals within its downward movement.
BTC/USD:
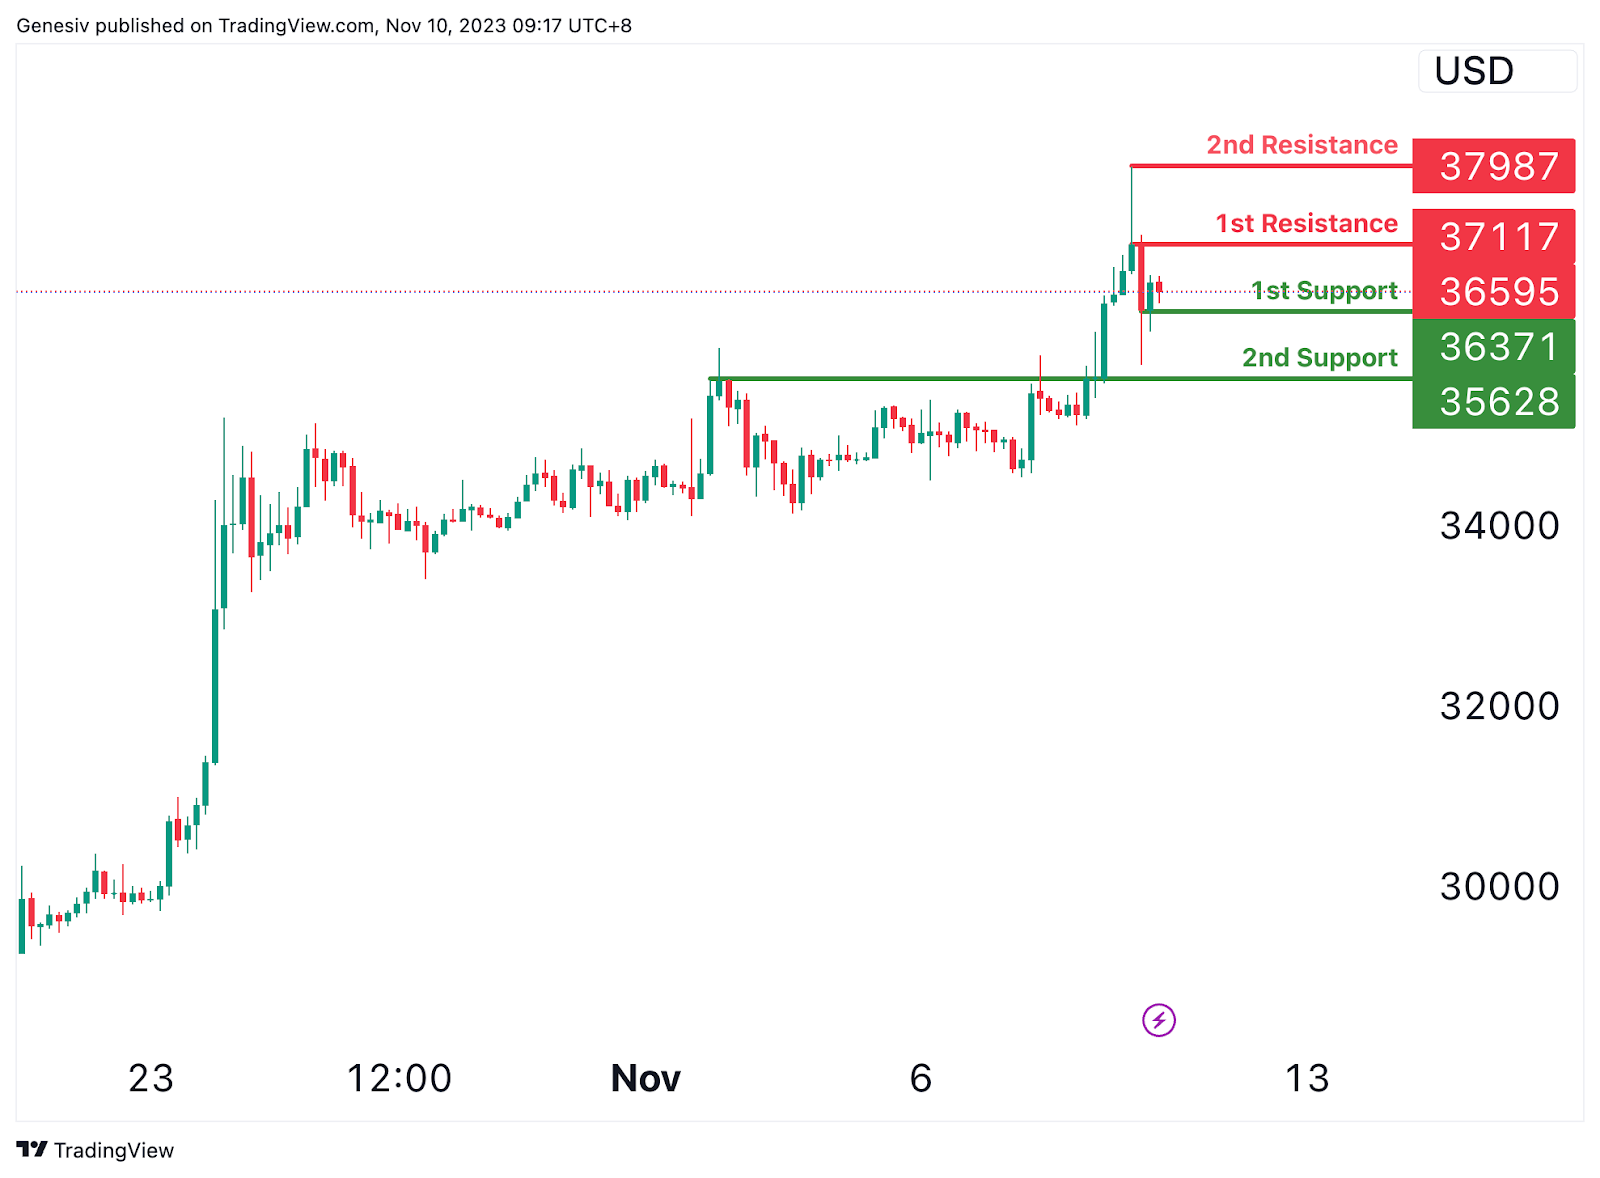
The BTC/USD chart currently displays a bullish momentum, suggesting a potential bullish bounce at the first support level of 36371, which signifies a swing low support. Furthermore, the second support at 35628 is identified as a pullback support. On the upside, the first resistance at 37117 is recognized as a point of significant swing high resistance, while the second resistance at 37987 also represents a swing high resistance, both indicating levels where the price might face notable hurdles or reversals within its upward movement.
ETH/USD:
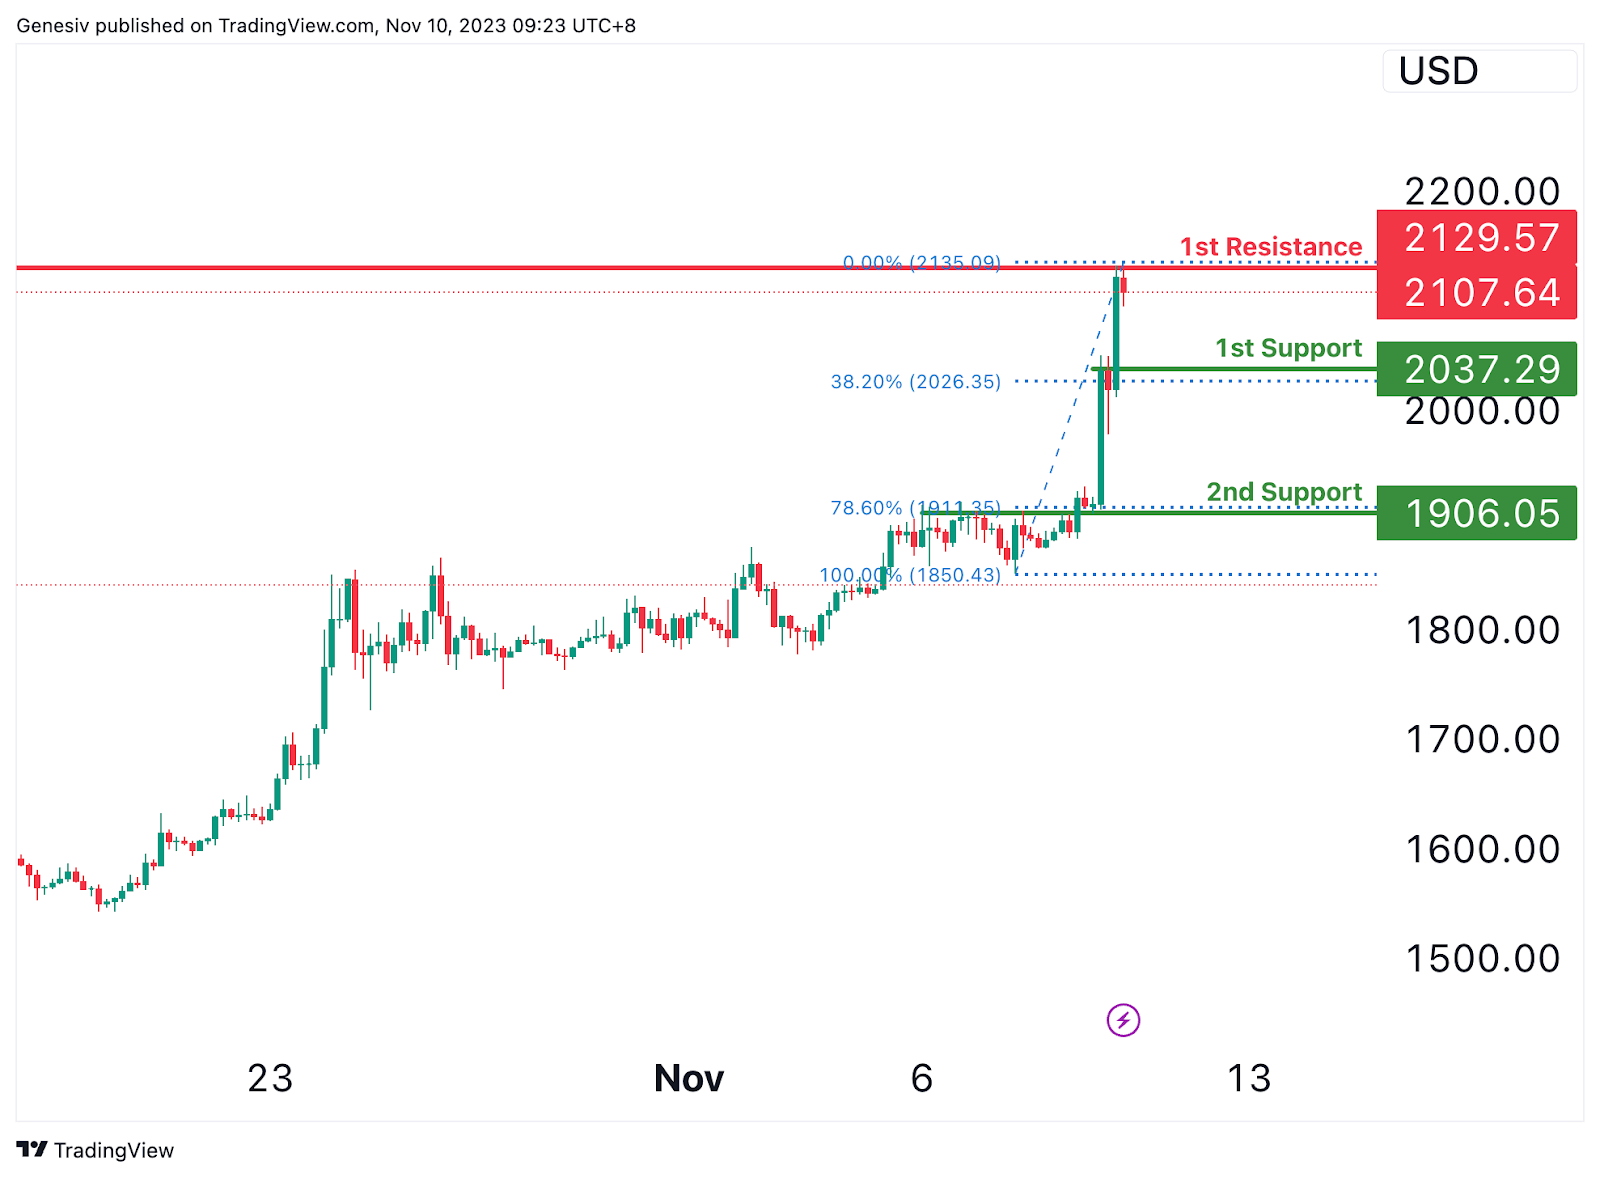
The ETH/USD chart currently indicates a bearish momentum, suggesting a potential bearish reaction at the first resistance level of 2129.57, identified as a point of multi-swing high resistance. This could lead the price to drop towards the first support at 2037.29, recognized as a pullback support at the 38.20% Fibonacci Retracement level. Additionally, a second support at 1906.05 is noted as another pullback support at the 78.60% Fibonacci Retracement level. These levels highlight potential points where the price might experience significant shifts or reversals within its downward movement.
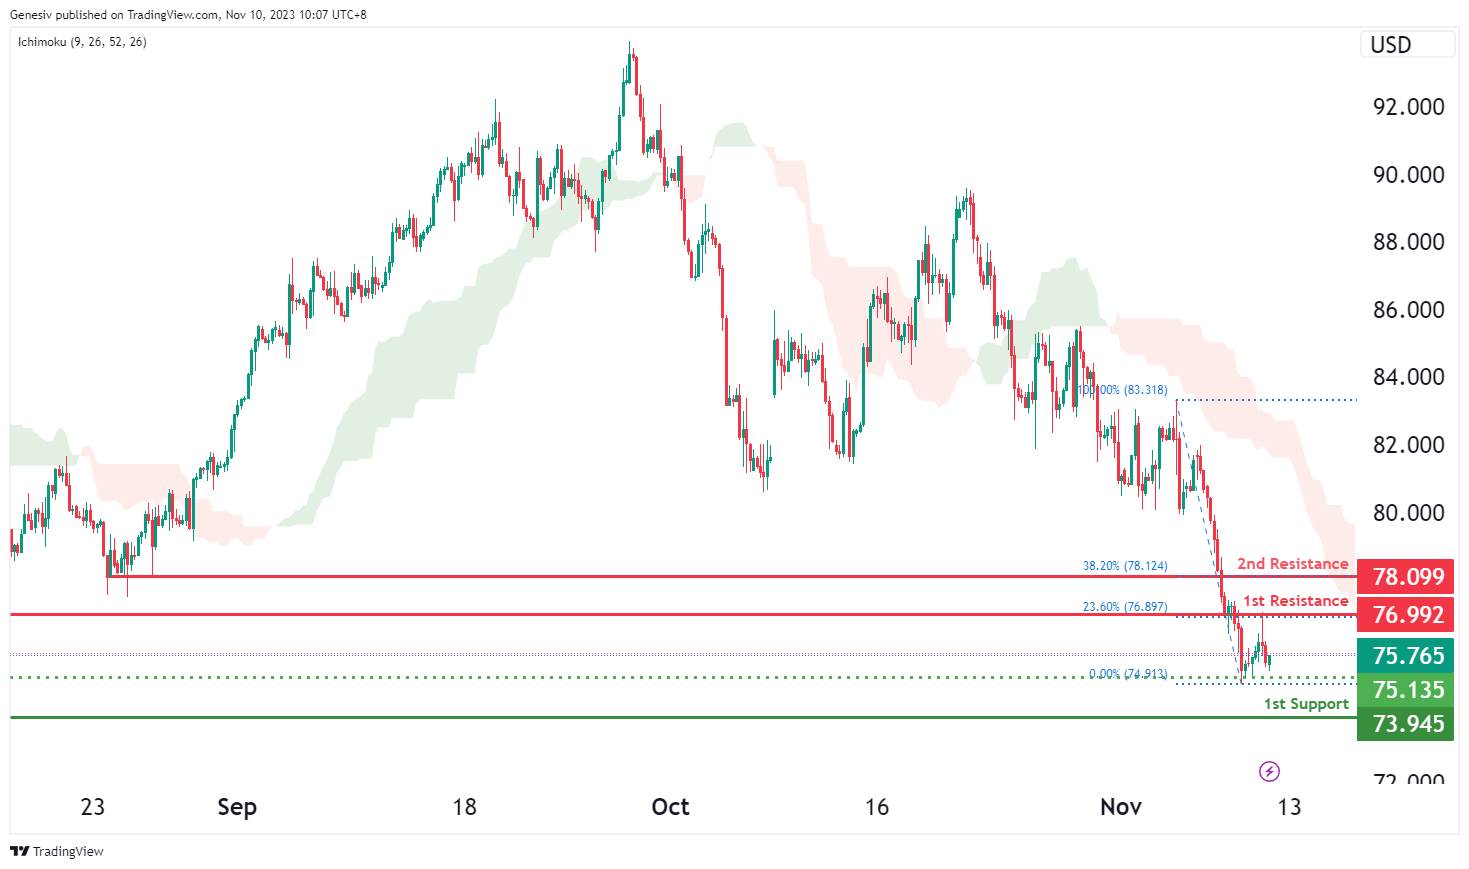
WTI/USD:
The WTI (West Texas Intermediate) chart currently demonstrates an overall bearish momentum. However, there is potential for price to rise towards the 1st resistance before making a bearish reaction and dropping towards the 1st support. Price is also trading under the bearish Ichimoku cloud, another factor contributing to the bearish momentum.
The 1st resistance level at 76.99 is identified as a pullback resistance that aligns with the 23.60% Fibonacci retracement level. Higher up, the 2nd resistance level at 78.09 is also noted a pullback resistance that aligns with the 38.20% Fibonacci retracement level, indicating another potential area where price could face resistance.
To the downside, the intermediate support level at 75.14 is identified as a pullback support. Further below, the 1st support level at 73.95 is marked as a swing-low support, potentially acting as a strong support zone.
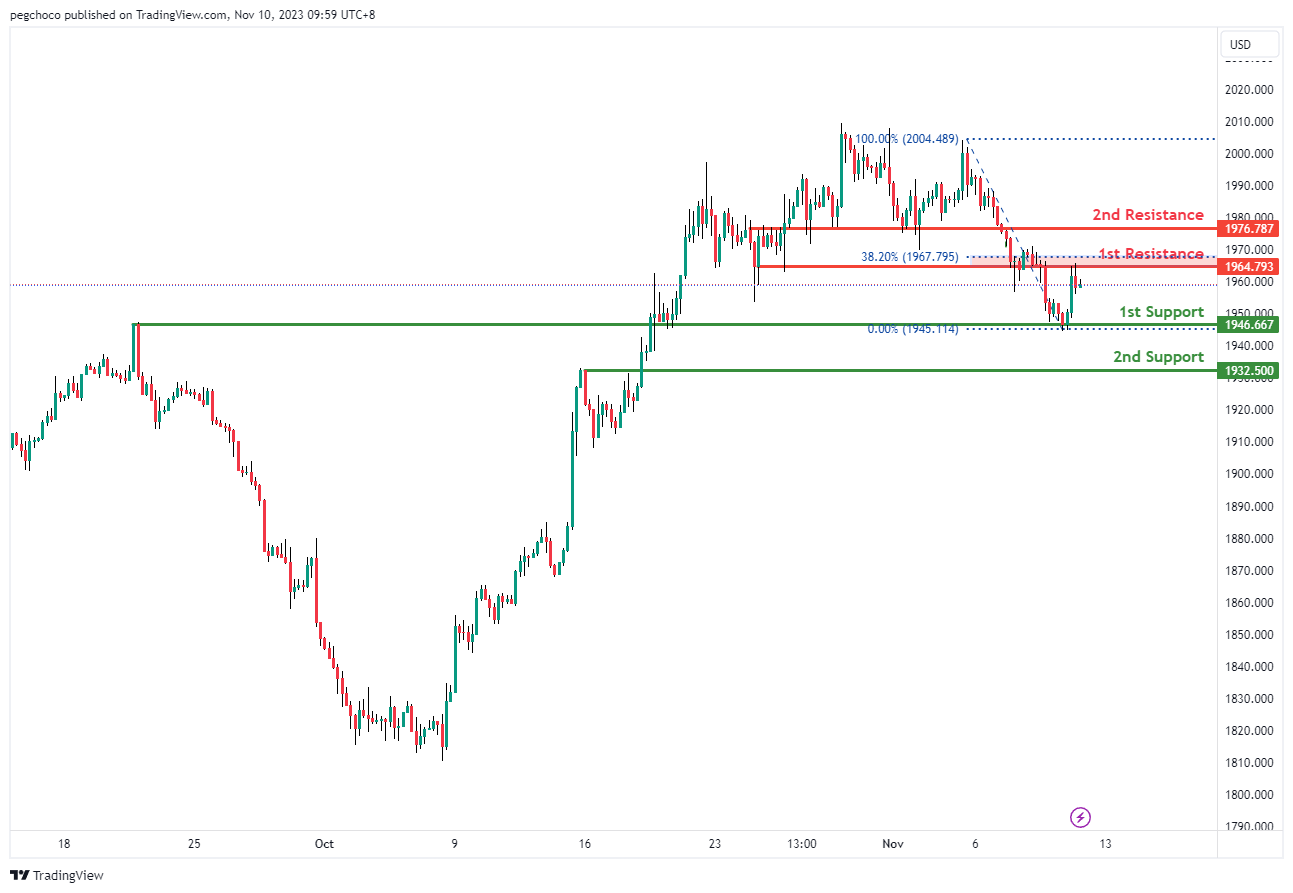
XAU/USD (GOLD):
The XAU/USD chart currently has a bearish overall momentum, suggesting the potential for a bearish continuation towards the 1st support level.
1st support at 1946.66 is identified as an overlap support, indicating it could be a significant level where the price might find some buying interest. Overlap support levels often have historical significance and can act as strong areas of support.
The 2nd support at 1932.50 is considered a pullback support, further reinforcing its potential as a support level. Pullback supports can be areas where traders who missed the initial move look to enter positions.
On the resistance side, the 1st resistance at 1964.79 is categorized as an overlap resistance and is also associated with the 38.20% Fibonacci Retracement level. This level suggests that there could be selling interest in this area, potentially acting as a barrier to further upward movement.
The 2nd resistance at 1976.78 is noted as a pullback resistance, adding to the potential areas where the price might find resistance during its bearish continuation.
The accuracy, completeness and timeliness of the information contained on this site cannot be guaranteed. IC Markets does not warranty, guarantee or make any representations, or assume any liability regarding financial results based on the use of the information in the site.
News, views, opinions, recommendations and other information obtained from sources outside of www.icmarkets.com, used in this site are believed to be reliable, but we cannot guarantee their accuracy or completeness. All such information is subject to change at any time without notice. IC Markets assumes no responsibility for the content of any linked site.
The fact that such links may exist does not indicate approval or endorsement of any material contained on any linked site. IC Markets is not liable for any harm caused by the transmission, through accessing the services or information on this site, of a computer virus, or other computer code or programming device that might be used to access, delete, damage, disable, disrupt or otherwise impede in any manner, the operation of the site or of any user’s software, hardware, data or property.


