
Key risk events today:
Australia Retail Sales m/m; China New Loans; Canada Employment Change and Unemployment Rate; US Average Hourly Earnings m/m, Non-Farm Employment Change and Unemployment Rate.
(Italics represents previous analysis)
EUR/USD:
Thursday had the euro slightly softer against a sturdier buck, as the US dollar index, or DXY, elbowed above 97.50. As of current price, buyers and sellers are squaring off a touch below the 1.11 handle on the H4 timeframe. As a result, a portion of sell stops beneath this psychological barrier have likely been tripped. Interestingly, though, the area between 1.1080/1.1092 (green), a 61.8% H4 Fibonacci retracement and a 127.2% AB=CD bullish correction, is likely to hamper downside. This, particularly for shorter-term traders, is an appealing reversal zone, given the liquidity generated from the filled sell stops. In addition to this, the setup boasts RSI (relative strength index) confirmation in the form of an oversold signal (pink).
Against the backdrop of shorter-term flow, the weekly timeframe recently crossed swords with channel resistance, extended from the high 1.1569. Noticeable downside objectives fall in around the 2016 yearly opening level at 1.0873 and channel support, taken from the low 1.1109.
Daily movement, on the other hand, trades within striking distance of the 50-day SMA (blue – 1.1091) after retesting channel support-turned resistance, taken from the low 1.0981. Another layer of support is seen nearby at 1.1072, closely trailed by longer-term channel support, extended from the low 1.0879.
Areas of consideration:
The combination of stop-taking beneath 1.11, the H4 AB=CD reversal zone at 1.1080/1.1092, RSI confirmation and the 50-day SMA is likely sufficient to tempt buyers into the market today, at least for an intraday bounce higher. A simple H4 bullish candlestick signal that closes back above 1.11 may serve as an entry trigger.
Traditional AB=CD take-profit targets favour the 38.2%/61.8% Fibonacci retracements set from legs A-D, at 1.1149 and 1.1183. Traders, however, are urged to also pencil in the 1.1125 January 3rd low as possible resistance.
Eyeing much higher than the aforementioned Fibonacci targets is dicey, considering where we’re coming from on the weekly timeframe.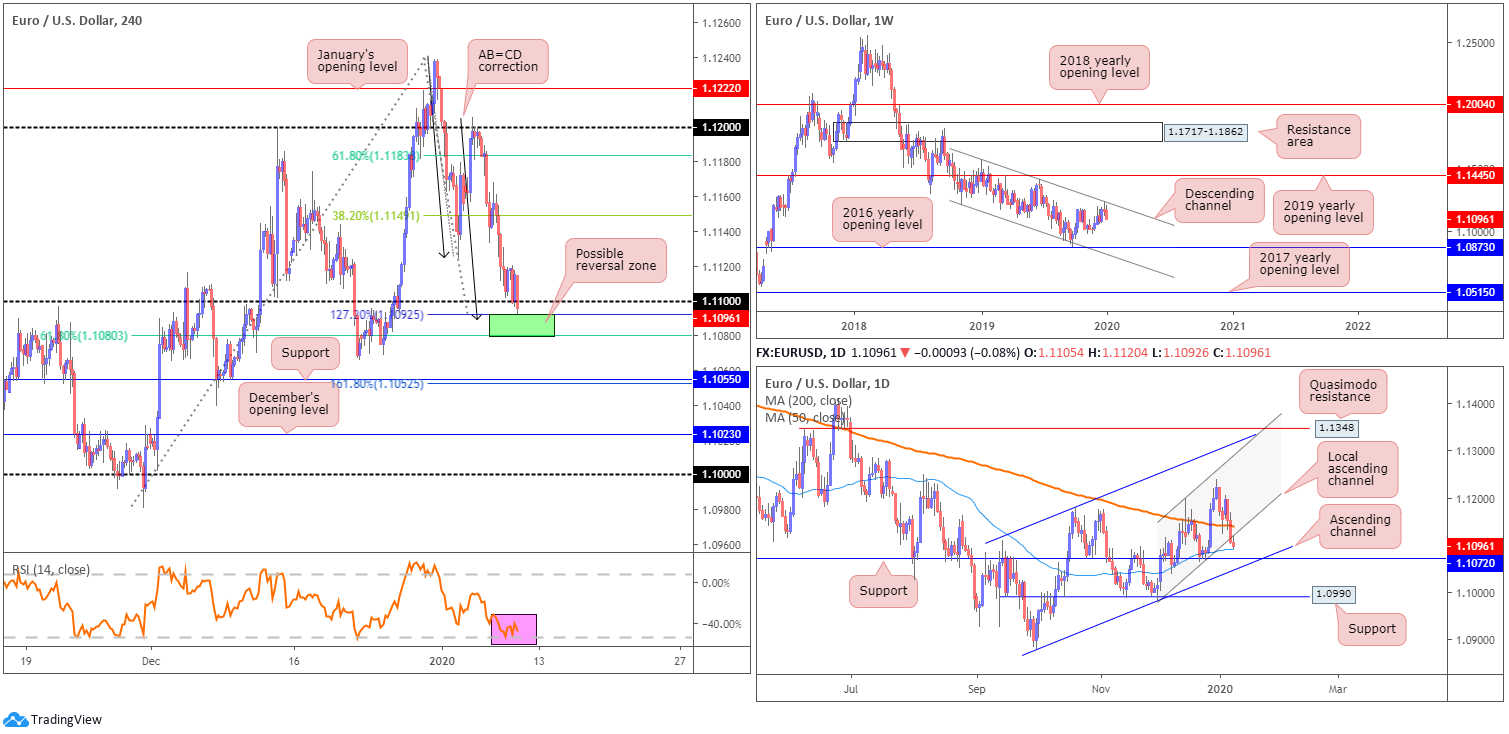
GBP/USD:
Unexpectedly dovish commentary from Bank of England (BoE) Governor Mark Carney, hinting at an interest rate cut, guided the British pound to lower levels Thursday. Carney raised doubt regarding the anticipated 2020 economic recovery, stating ‘the economy has been sluggish, slack has been growing, and inflation is below target. Much hinges on the speed with which domestic confidence returns’. The Governor added, ‘there are downside risks from global growth and the possibility that uncertainties over future trading relationships could remain entrenched’.
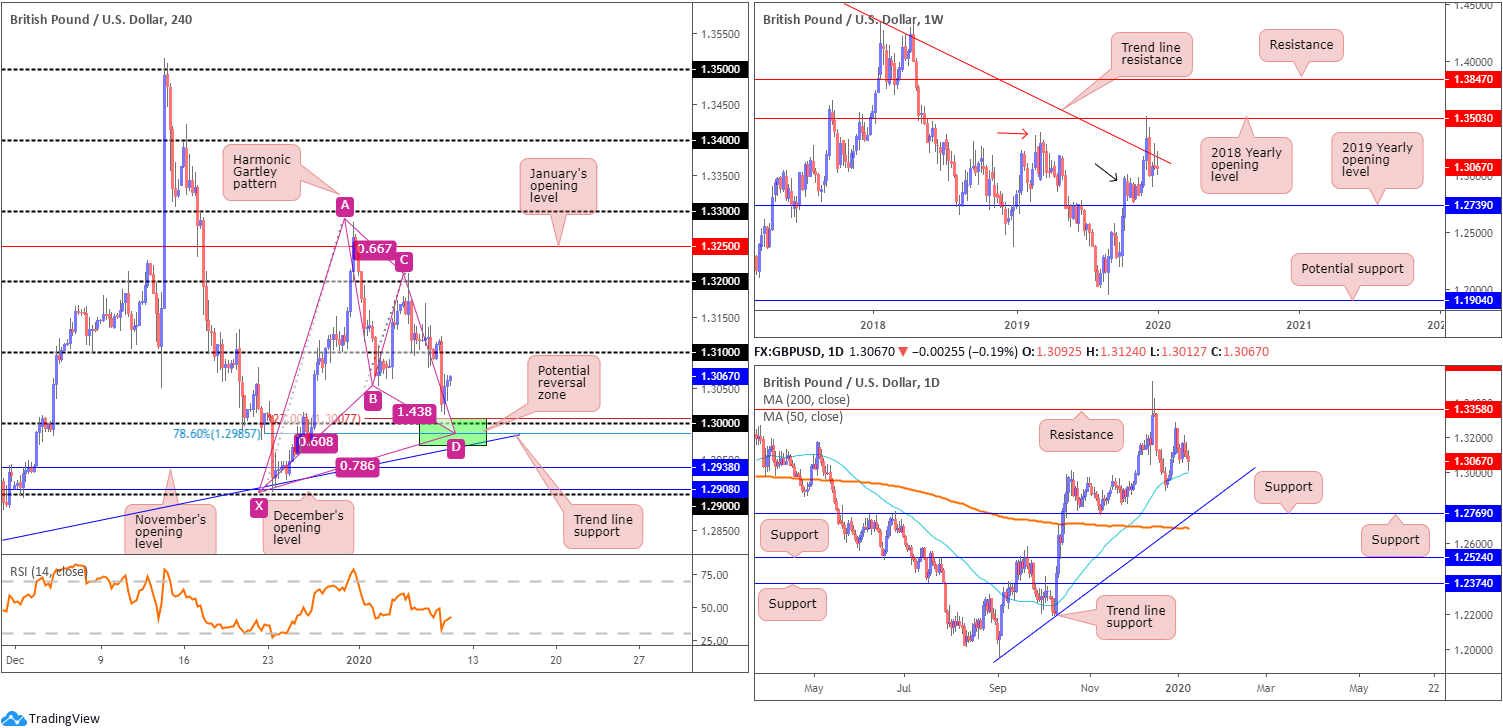
GBP/USD dethroned the 1.31 handle in strong fashion and bottomed a few points north of the key figure 1.30. Note (green) this level also forms together with a potential H4 harmonic Gartley pattern, boasting an AB=CD equivalent formation and a 78.6% XA retracement at 1.2985 as well as a 127.2% BC projection at 1.3007. Additionally, there’s H4 trend line support, extended from the low 1.2768.
Meanwhile, on the weekly timeframe, buyers and sellers continue to battle for position between long-standing trend line resistance, pencilled in from the high 1.5930, and nearby demand around the 1.2939 region (black arrow), likely seduced by the recent break of the notable high at 1.3380 (red arrow).
The 50-day SMA (blue – 1.3006) remains reasonably dominant support on the daily timeframe. Another layer of support that may eventually enter the fight, though, is 1.2769, which happens to merge closely with trend line support, pencilled in from the low 1.1958 and the 200-day SMA (orange – 1.2688). With respect to resistance, the only level of interest right now sits at 1.3358, capping upside since mid-June 2019.
Areas of consideration:
1.30 is an obvious point of direction for many buyers in this market, considering its convergence with a H4 Gartley combination and trend line support, as well as the 50-day SMA aligning closely with the round number.
Interest in entering long from the Gartley pattern has an entry point around the 1.30ish region, preferably the 78.6% Fibonacci retracement at 1.2985, with stop-loss order placement set beneath the X point – the 1.29 handle. In terms of take-profit targets, generally traders favour the 38.2%/61.8% Fibonacci retracements of legs A-D – reduce risk to breakeven at 38.2% and take-profit at 61.8%. This, of course, can only be set once the pattern is complete, the 78.6% retracement and AB=CD equivalent has been hit.
AUD/USD:
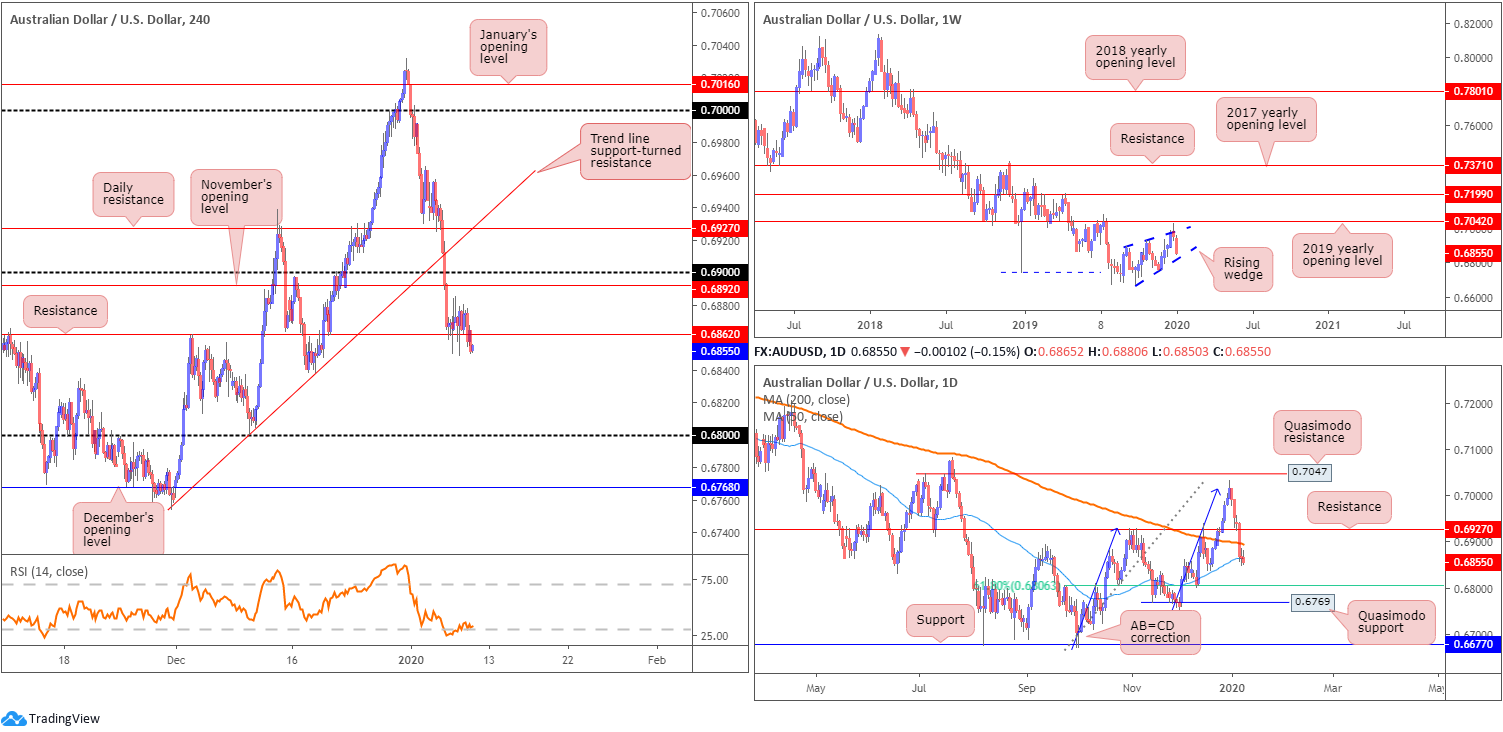
AUD/USD remained subdued off H4 support at 0.6862 in early trade Thursday, largely unresponsive to wider-than-forecast trade surplus and a no-change reading in China’s annual CPI print. In recent hours, however, the noted support yielded ground, weighed on by a stronger US dollar. Aside from the 0.6838 December 18 low, limited support is evident until reaching the 0.68 handle. Indicator-based traders may also note the relative strength index (RSI) is treading water around oversold territory, attempting to surface above the 30.0 value.
The 50-day SMA (blue – 0.6864) also gave way in recent trading on the daily timeframe, exposing the 61.8% daily Fibonacci retracement 0.6806, followed by Quasimodo support at 0.6769. Remember, AB=CD traders short the bearish pattern on the daily chart (blue arrows) will largely be targeting the said 61.8% Fibonacci level.
Weekly action, since registering a bottom in late September at 0.6670, has been busy carving out what appears to be a rising wedge formation, typically considered a continuation pattern. Recent selling witnessed price decline back into the rising wedge, with a break lower possible given the primary downtrend in this market has faced a southerly bearing since early 2018.
Areas of consideration:
All three timeframes, technically speaking, point to continuation selling, at least until crossing paths with the 61.8% daily Fibonacci retracement 0.6806. Aggressive traders may already be short this market on the break of H4 support at 0.6862. Conservative traders, on the other hand, possibly have eyes on a retest at 0.6862, while ultra conservative traders likely require a break of the 0.6838 December 18 low before a bearish signal is triggered.
Regardless of the entry trigger, downside targets fall in around the 0.68 handle, and daily Quasimodo support at 0.6769.
USD/JPY:
The US dollar continued to flex its financial muscle Thursday, towing the US dollar index above 97.50. US equities explored higher ground amid easing geopolitical tensions and Fed’s Clarida, speaking on the economy, noted global growth headwinds are beginning to abate. Clarida also stated we entered 2020 with the economy growing around trend rate, and downside risks have diminished, but he sees inflation risks as skewed to the downside.
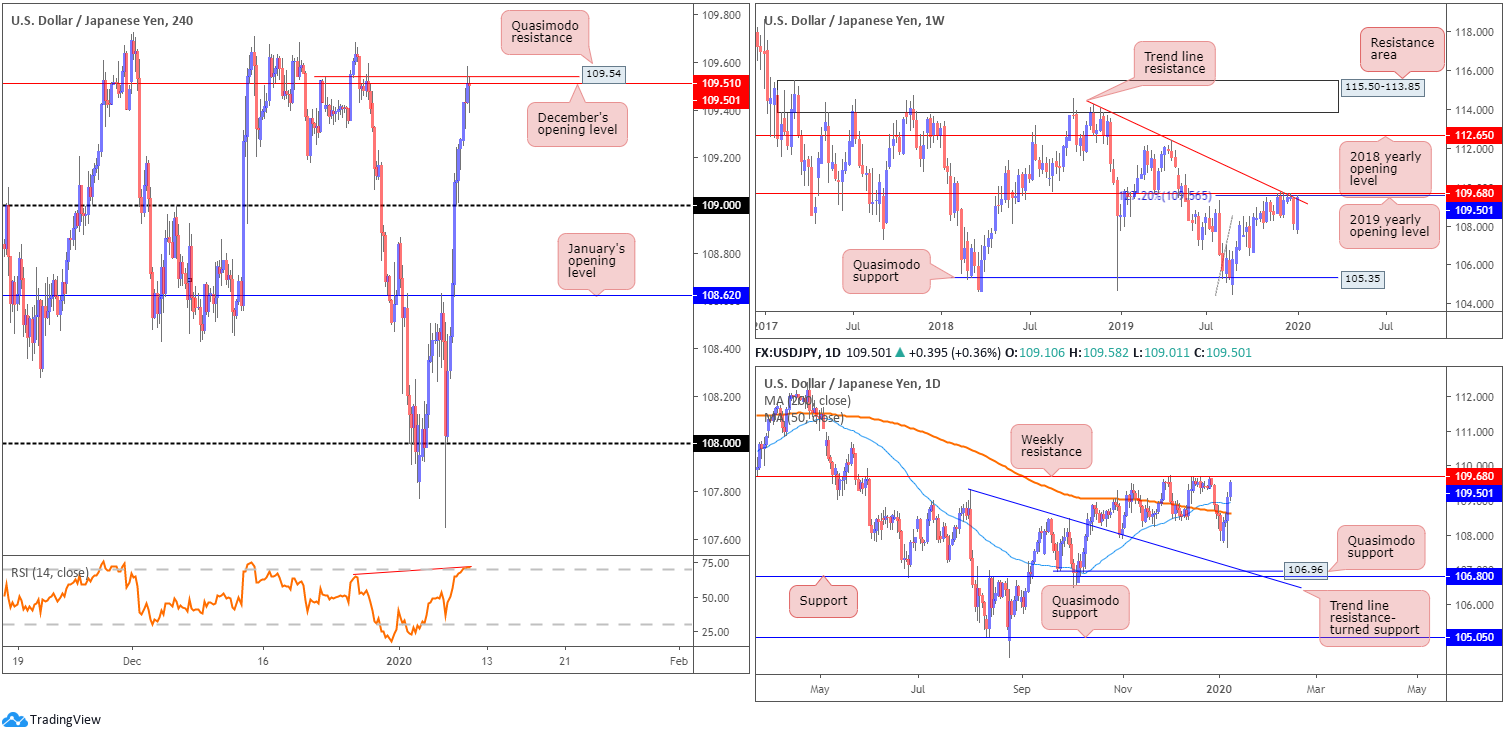
Following Wednesday’s break of the 109 handle, based on the H4 timeframe, further upside was seen, drawing the candles towards December’s opening level at 109.51, trailed by Quasimodo resistance drawn from 109.54. Traders may also wish to note the relative strength index (RSI) entered overbought territory, and is currently producing hidden bearish divergence (red line).
From the weekly timeframe, technical research shows price trades within striking distance of notable resistances, following the continued recovery (comprised of a 127.2% Fibonacci extension at 109.56 [taken from the low 104.44], the 2019 yearly opening level at 109.68 and trend line resistance, extended from the high 114.23).
Daily flow, like the weekly timeframe, has weekly resistance in sight at 109.68. The difference, in the event of a downturn occurring, is daily price may establish support nearby at the 200-day SMA (orange – 108.63) and the 50-day SMA (blue – 108.93).
Areas of consideration:
The collection of weekly resistances are likely on the radar for many traders today, either as an area to unwind long positions or assess price action for possible shorting opportunities.
A scenario of interest might be a test of weekly resistance at 109.68, followed through with a H4 close back beneath December’s opening level at 109.51. Entry on the close might then be an option worthy of consideration, with a protective stop-loss order tucked above weekly resistance, targeting 109 as the initial port of call.
USD/CAD:
Speaking at the Greater Vancouver Board of Trade’s Economic Outlook Forum Thursday, Bank of Canada’s (BoC) Governor Poloz, when asked about weak Q4 data, cited strikes and bad weather as contributing factors to mixed data. On inflation, he said it has been very close to the 2% target, which if on target, the bank can treat every shock symmetrically. Poloz also said it ‘remains to be seen’ how Canadian business will respond to the preliminary US/China trade pact. The implications for Canada are uncertain (Bloomberg).
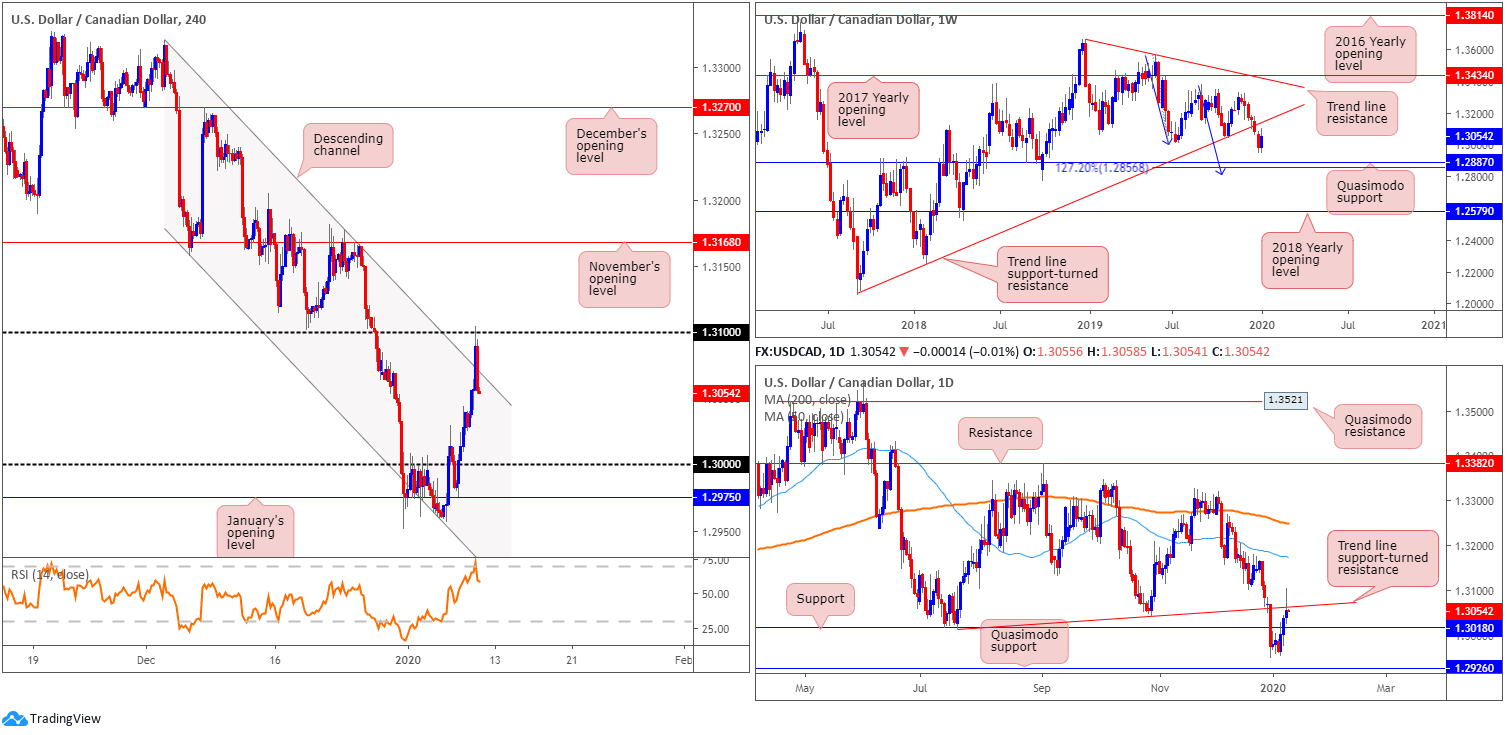
USD/CAD rose yesterday, clocking session highs of 1.3104. H4 price, in the shape of two near-full-bodied candles, whipsawed through channel resistance, extended from the high 1.3320, shaking hands with the 1.31 handle and testing overbought terrain on the relative strength index (RSI) in the process. In view of the strong H4 bearish close, additional selling may emerge today, eyeing key figure 1.30 as a possible target.
Technical structure on the weekly timeframe, despite the recent upturn, continues to reflect a bearish position. After engulfing trend line support, taken from the low 1.2061, the pair exhibits scope to test Quasimodo support at 1.2887, positioned close by a 127.2% AB=CD bullish correction (blue arrows) at 1.2856. As such, 1.2856/1.2887 on the weekly timeframe is likely a base active buyers reside.
In conjunction with the weekly chart, daily price recently chalked up a strong selling wick off trend line support-turned resistance, taken from the low 1.3015. Nearby support resides close by at 1.3018, with a break of this level exposing Quasimodo support at 1.2926.
Areas of consideration:
Sellers short the whipsaw through H4 channel resistance at around 1.3055 likely have protective stop-loss orders plotted above 1.31. That’s approximately a 47-point stop, with less than 40 points to the first take-profit target at daily support drawn from 1.3018. Reducing risk to breakeven at 1.3018 and partial profit taking off the 1.30 key figure is still a viable approach, though, given room seen for this market to push lower on the weekly timeframe.
USD/CHF:
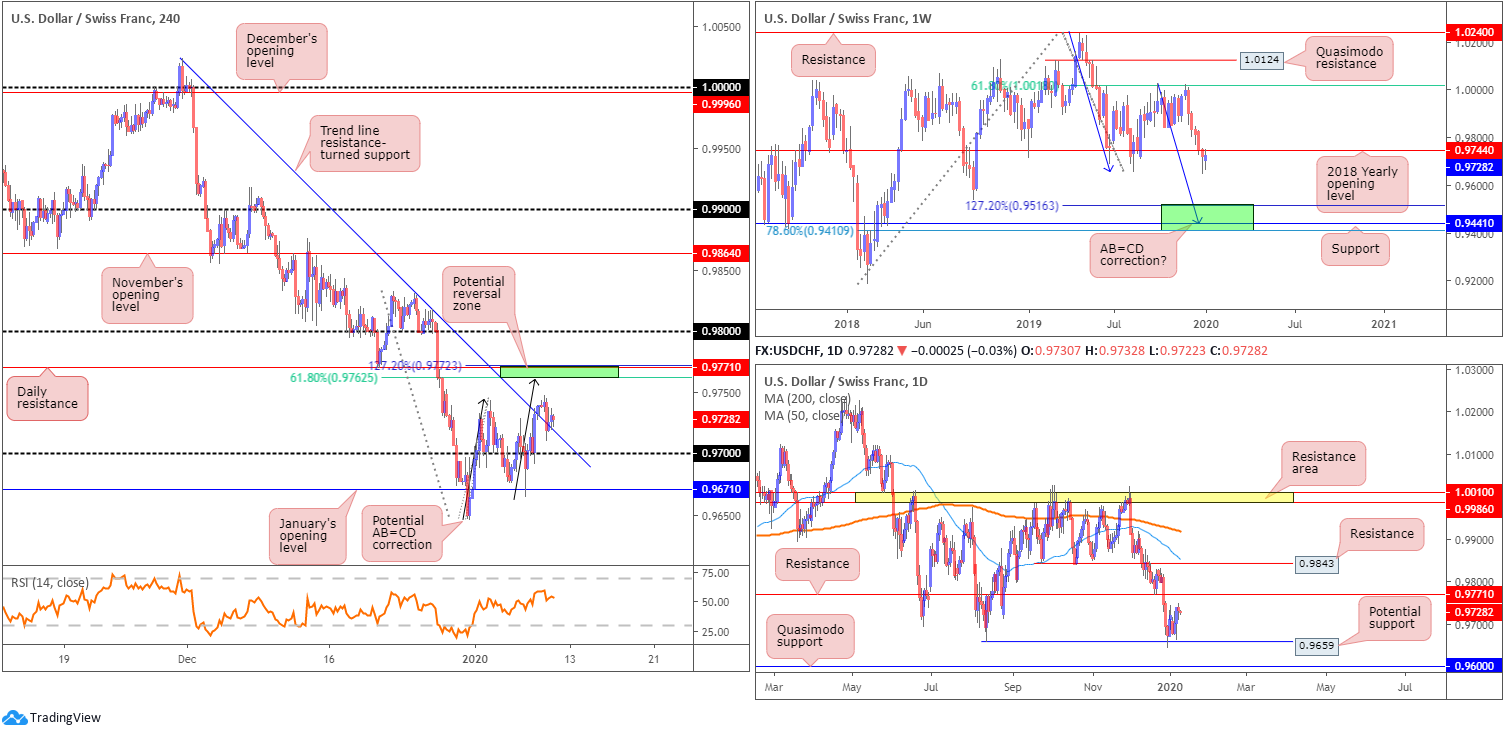
USD/CHF prices concluded pretty much unchanged Thursday, noting minor losses off session highs at 0.9748. H4 trend line resistance-turned support, etched from the high 1.0023, however, entered the mix yesterday, modestly holding ground.
As highlighted in Thursday’s technical briefing, further buying towards daily resistance at 0.9771 is possible. Note this level merges closely with a 127.2% H4 AB=CD bearish correction (black arrows) and a 61.8% H4 Fibonacci resistance at 0.9762 (green). Also notable is the weekly timeframe: the 2018 yearly opening level at 0.9744 is currently in motion.
Areas of consideration:
While some H4 buyers may load up on the break of the trend line resistance, having seen a correction/retest pattern form, entering long knowing higher-timeframe resistance resides nearby is chancy.
Therefore, daily resistance at 0.9771 is in focus today for possible shorting opportunities. Coupled with its H4 confluence, this area is considered a high-probability reversal zone, targeting the current H4 trend line as the initial take-profit area.
Dow Jones Industrial Average:
US equities navigated higher ground for a second successive session Thursday, as markets shifted focus to trade progress amid an easing of concerns about war in the Middle East. The Dow Jones Industrial Average added 211.81 points, or 0.74%; the S&P 500 added 21.65 points, or 0.67% and the tech-heavy Nasdaq 100 rose 77.26 points, or 0.87%.
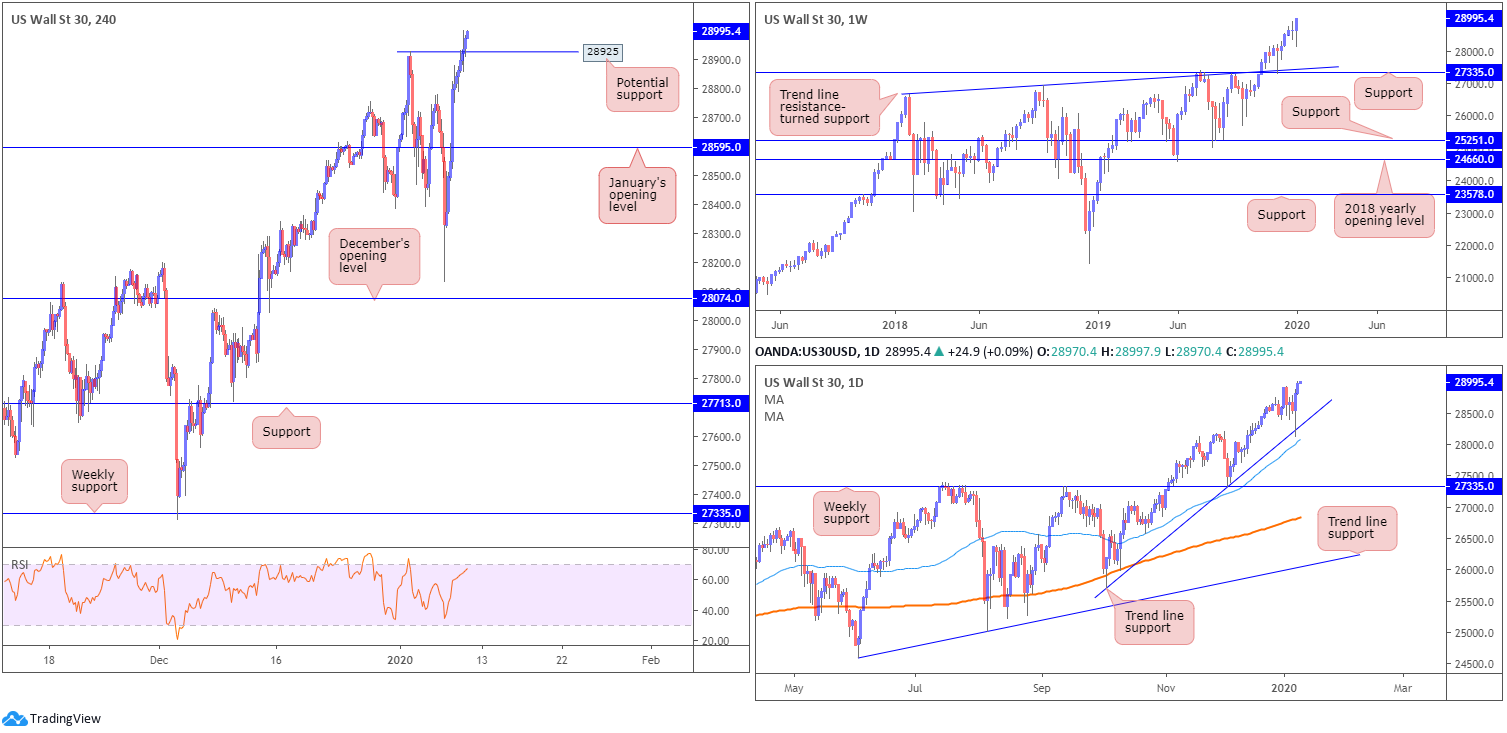
The DJIA had price clock fresh all-time highs at 28996 yesterday, with the technical setting on the H4 timeframe displaying possible support off 28925, the previous all-time high. A break below here could lead to a pullback in the direction of January’s opening level at 28595.
Weekly price is pretty much unchanged. In terms of structure, price continues to remain buoyant above support drawn from 27335, along with trend line support etched from the high 26670. Meanwhile, on the daily timeframe, trend line support, extended from the low 25710, entered the fray in recent movement, bolstered by additional support nearby from the 50-day SMA (blue – 28077).
Areas of consideration:
With the uptrend remaining strong, and daily price recently shaking hands with trend line support, H4 support at 28925 could serve as support for potential buying opportunities today – a retest at 28925, preferably by way of a H4, or H1, bullish candlestick signal. This helps recognise intent to take things higher, and provides structured entry and risk levels to work with.
XAU/USD (GOLD):
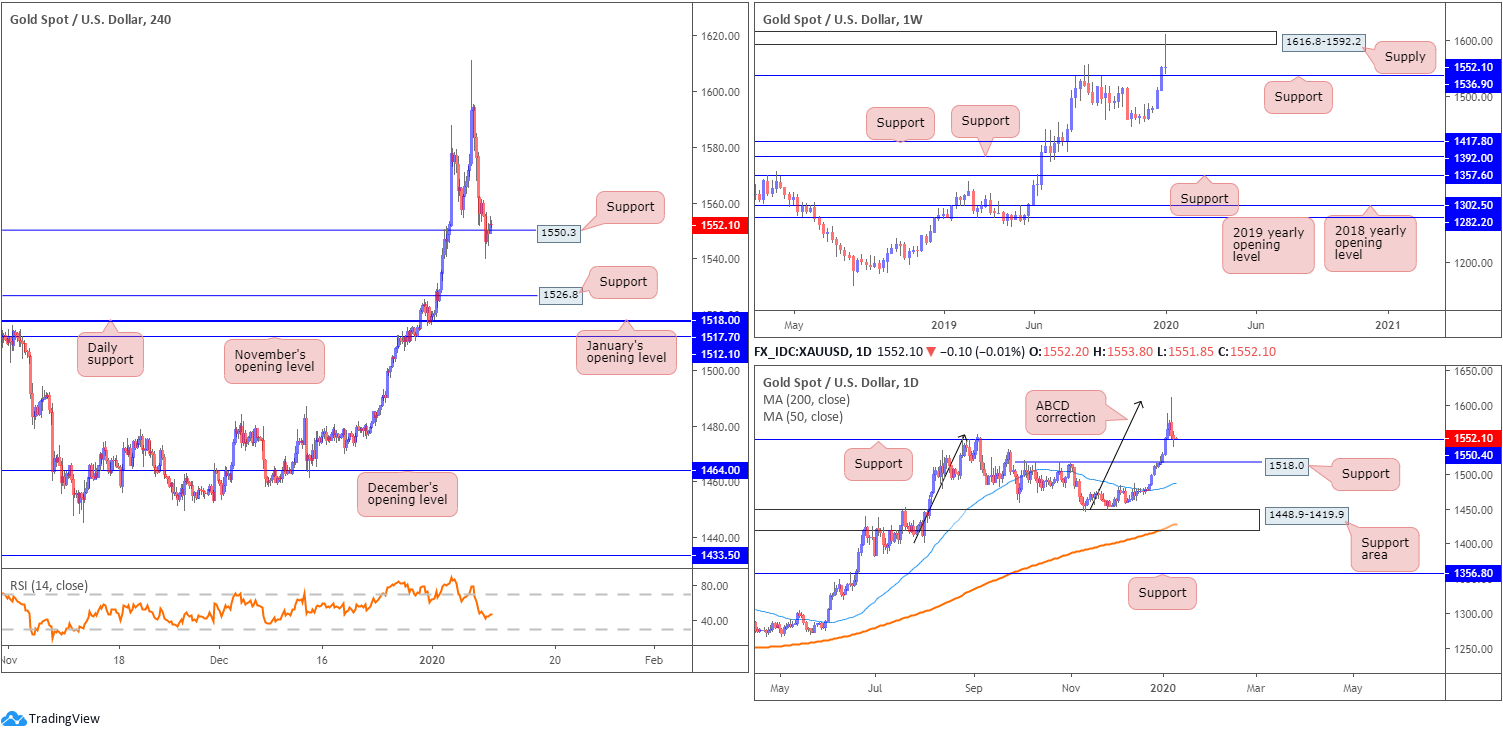
In recent sessions, XAU/USD spot printed a fresh weekly low at 1540.0, consequently engulfing H4 support at 1550.3, a previous Quasimodo resistance.
Weekly supply at 1616.8-1592.2, as you can see, entered the mix recently, adding to the selling pressure. Support on the weekly timeframe is seen reasonably close by at 1536.9. In similar fashion to the weekly timeframe, the daily chart has support in motion at 1550.4, with a break exposing another layer of support pencilled in nearby at 1518.0. What’s also interesting on the daily timeframe is the recently formed ABCD bearish correction (black arrows) at 1608.0. It might also be worth noting the 200/50-day SMAs point north (orange – 1428.6/blue – 1487.6), with the 50-SMA drifting north of the 200-SMA.
Lower down on the curve, the H4 candles managed to reclaim some of its recently lost ground and close back above support at 1550.3. Note this level converges with daily support at 1550.4, and is positioned slightly above weekly support at 1536.9. Also likely appealing from a buyer’s perspective is the sell stops triggered from beneath the 1554.8 January 7 low, which provides liquidity to buy into.
Areas of consideration:
A H4 bullish candlestick signal produced off H4 support at 1550.3 today will likely attract buyers into this market seeking a ‘buy-the-dip scenario’. A H4 bullish candlestick pattern such as a hammer formation or an engulfing pattern helps identify buyer intent, and provides the option of using the pattern’s structure to determine entry and risk levels. Conservative traders, though, will likely site protective stop-loss orders beneath weekly support at 1536.9.
The accuracy, completeness and timeliness of the information contained on this site cannot be guaranteed. IC Markets does not warranty, guarantee or make any representations, or assume any liability regarding financial results based on the use of the information in the site.
News, views, opinions, recommendations and other information obtained from sources outside of www.icmarkets.com.au, used in this site are believed to be reliable, but we cannot guarantee their accuracy or completeness. All such information is subject to change at any time without notice. IC Markets assumes no responsibility for the content of any linked site.
The fact that such links may exist does not indicate approval or endorsement of any material contained on any linked site. IC Markets is not liable for any harm caused by the transmission, through accessing the services or information on this site, of a computer virus, or other computer code or programming device that might be used to access, delete, damage, disable, disrupt or otherwise impede in any manner, the operation of the site or of any user’s software, hardware, data or property.


