
DXY:
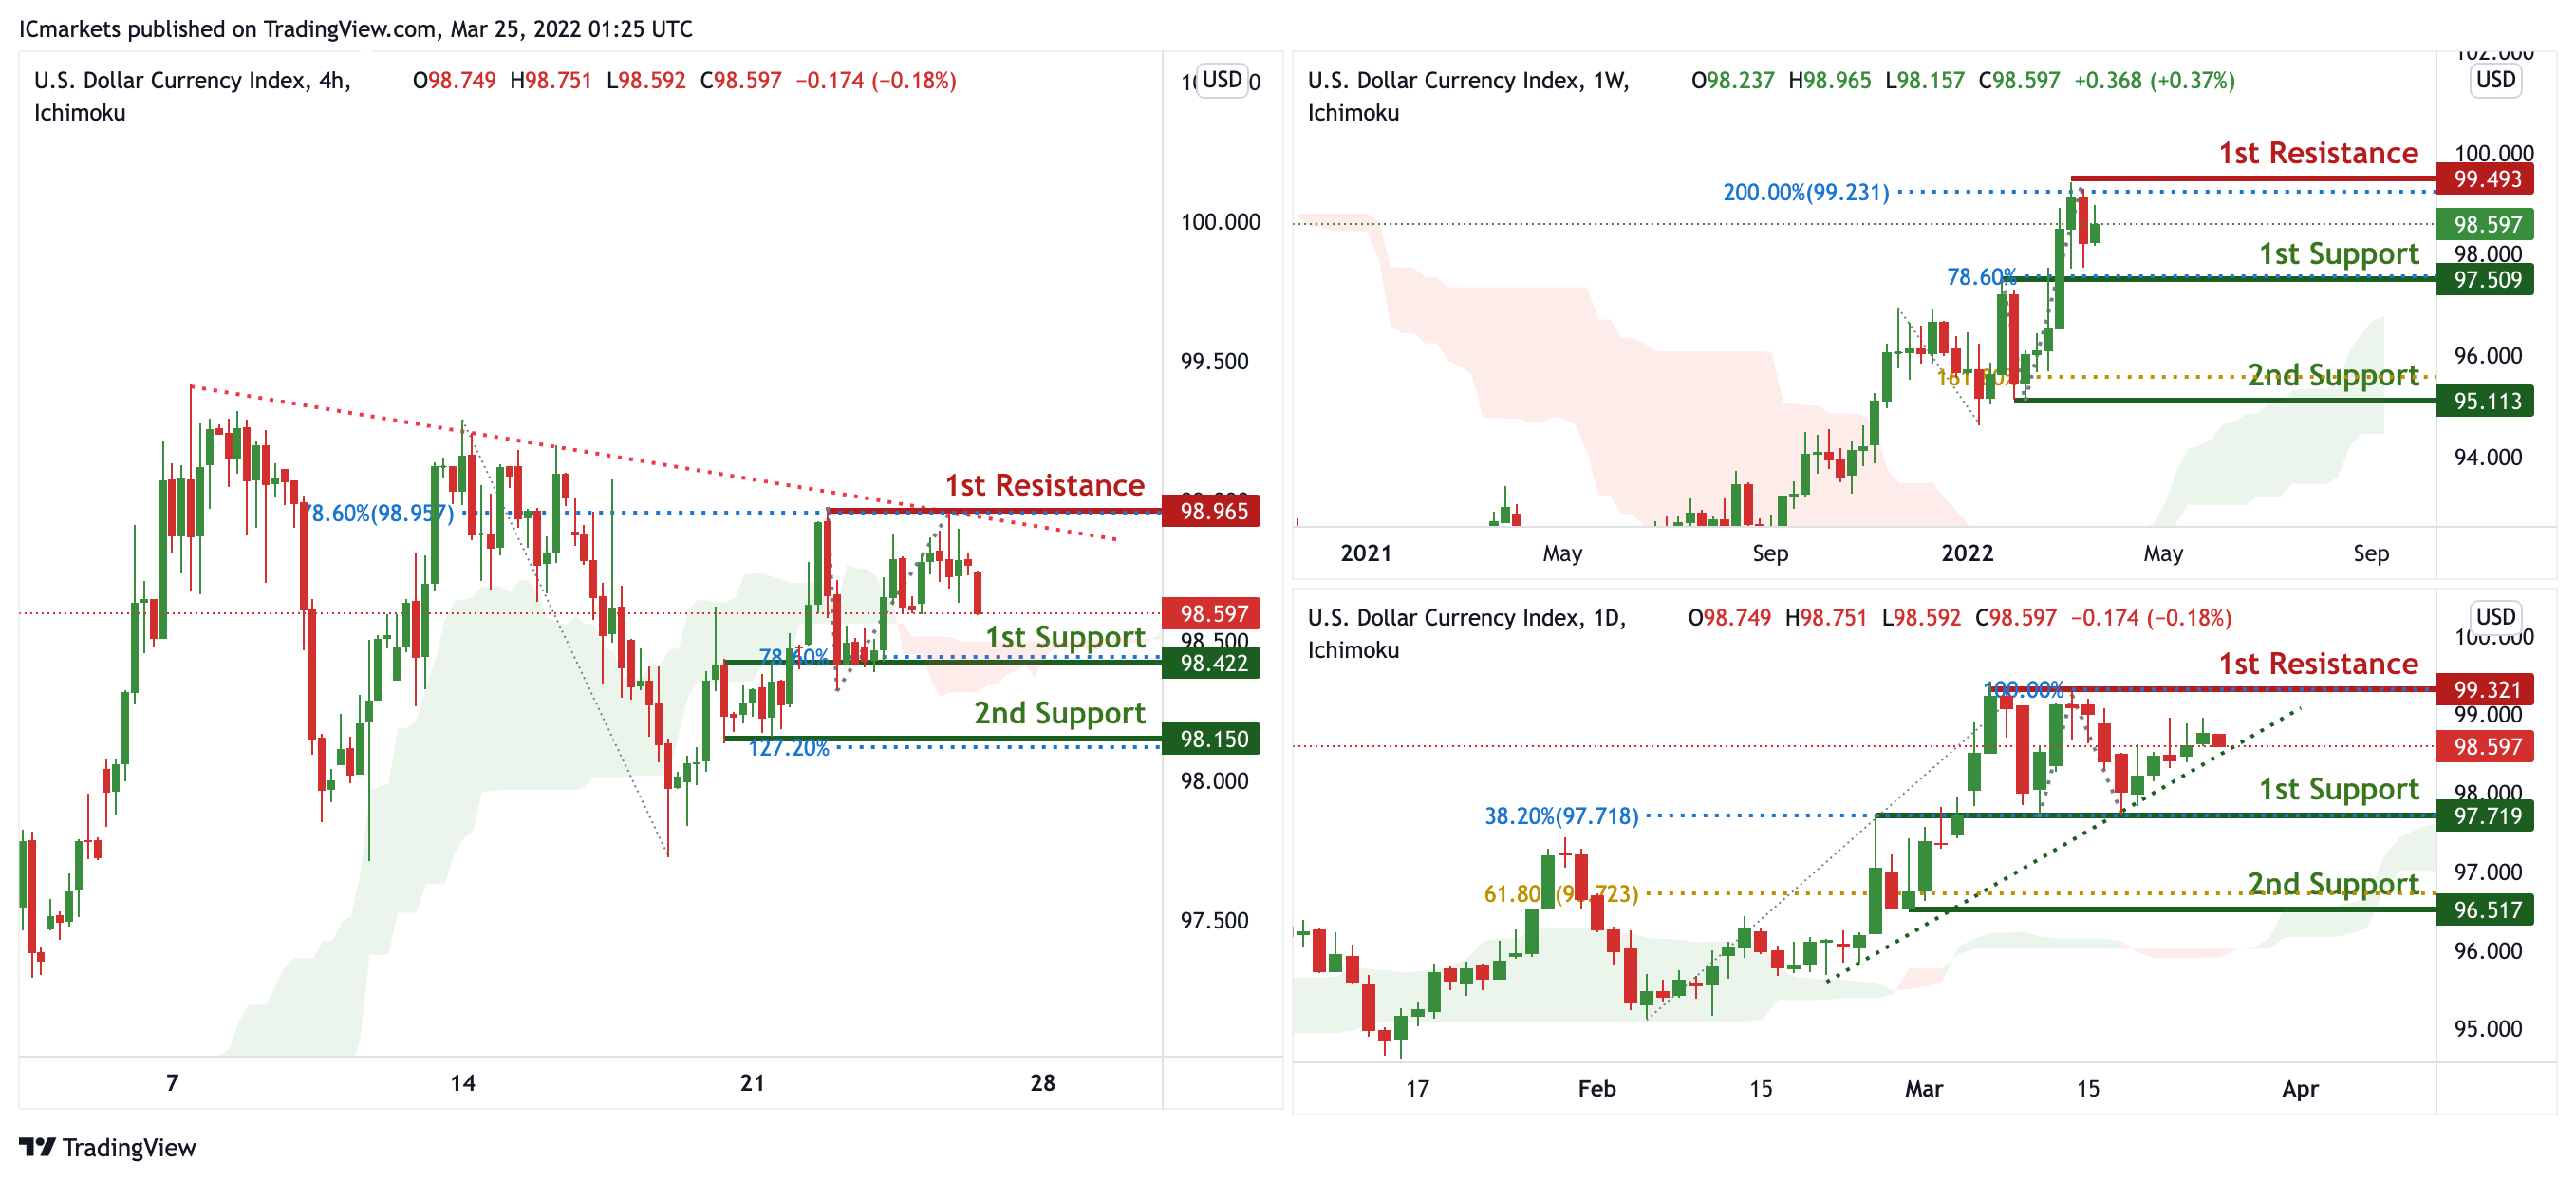
On the weekly, prices are on bullish momentum. We see the potential for further bullish continuation from our 1st support at 97.509 in line with 78.6% Fibonacci retracement towards our 1st resistance at 99.493 in line with 200% Fibonacci Projection. Prices are trading above our ichimoku cloud support, further supporting our bullish bias.
On the daily, prices are on bullish momentum and abiding by our ascending trendline support. We see the potential for bullish continuation from our 1st support at 97.719 in line with 38.2% Fibonacci retracement towards our 1st resistance at 99.321 in line with 100% Fibonacci Projection. Prices are trading above our ichimoku cloud support, further supporting our bullish bias.
On the H4 timeframe, prices are abiding by a descending trendline resistance. We see the potential for a dip from our 1st resistance at 98.665 in line with 78.6% Fibonacci retracement towards our 1st support at 98.422 in line with 78.6% Fibonacci projection. Prices are trading below our ichimoku cloud resistance, further supporting our bearish bias.
Areas of consideration:
- H4 time frame, 1st resistance at 98.422
- H4 time frame, 1st support at 98.623
XAU/USD (GOLD):
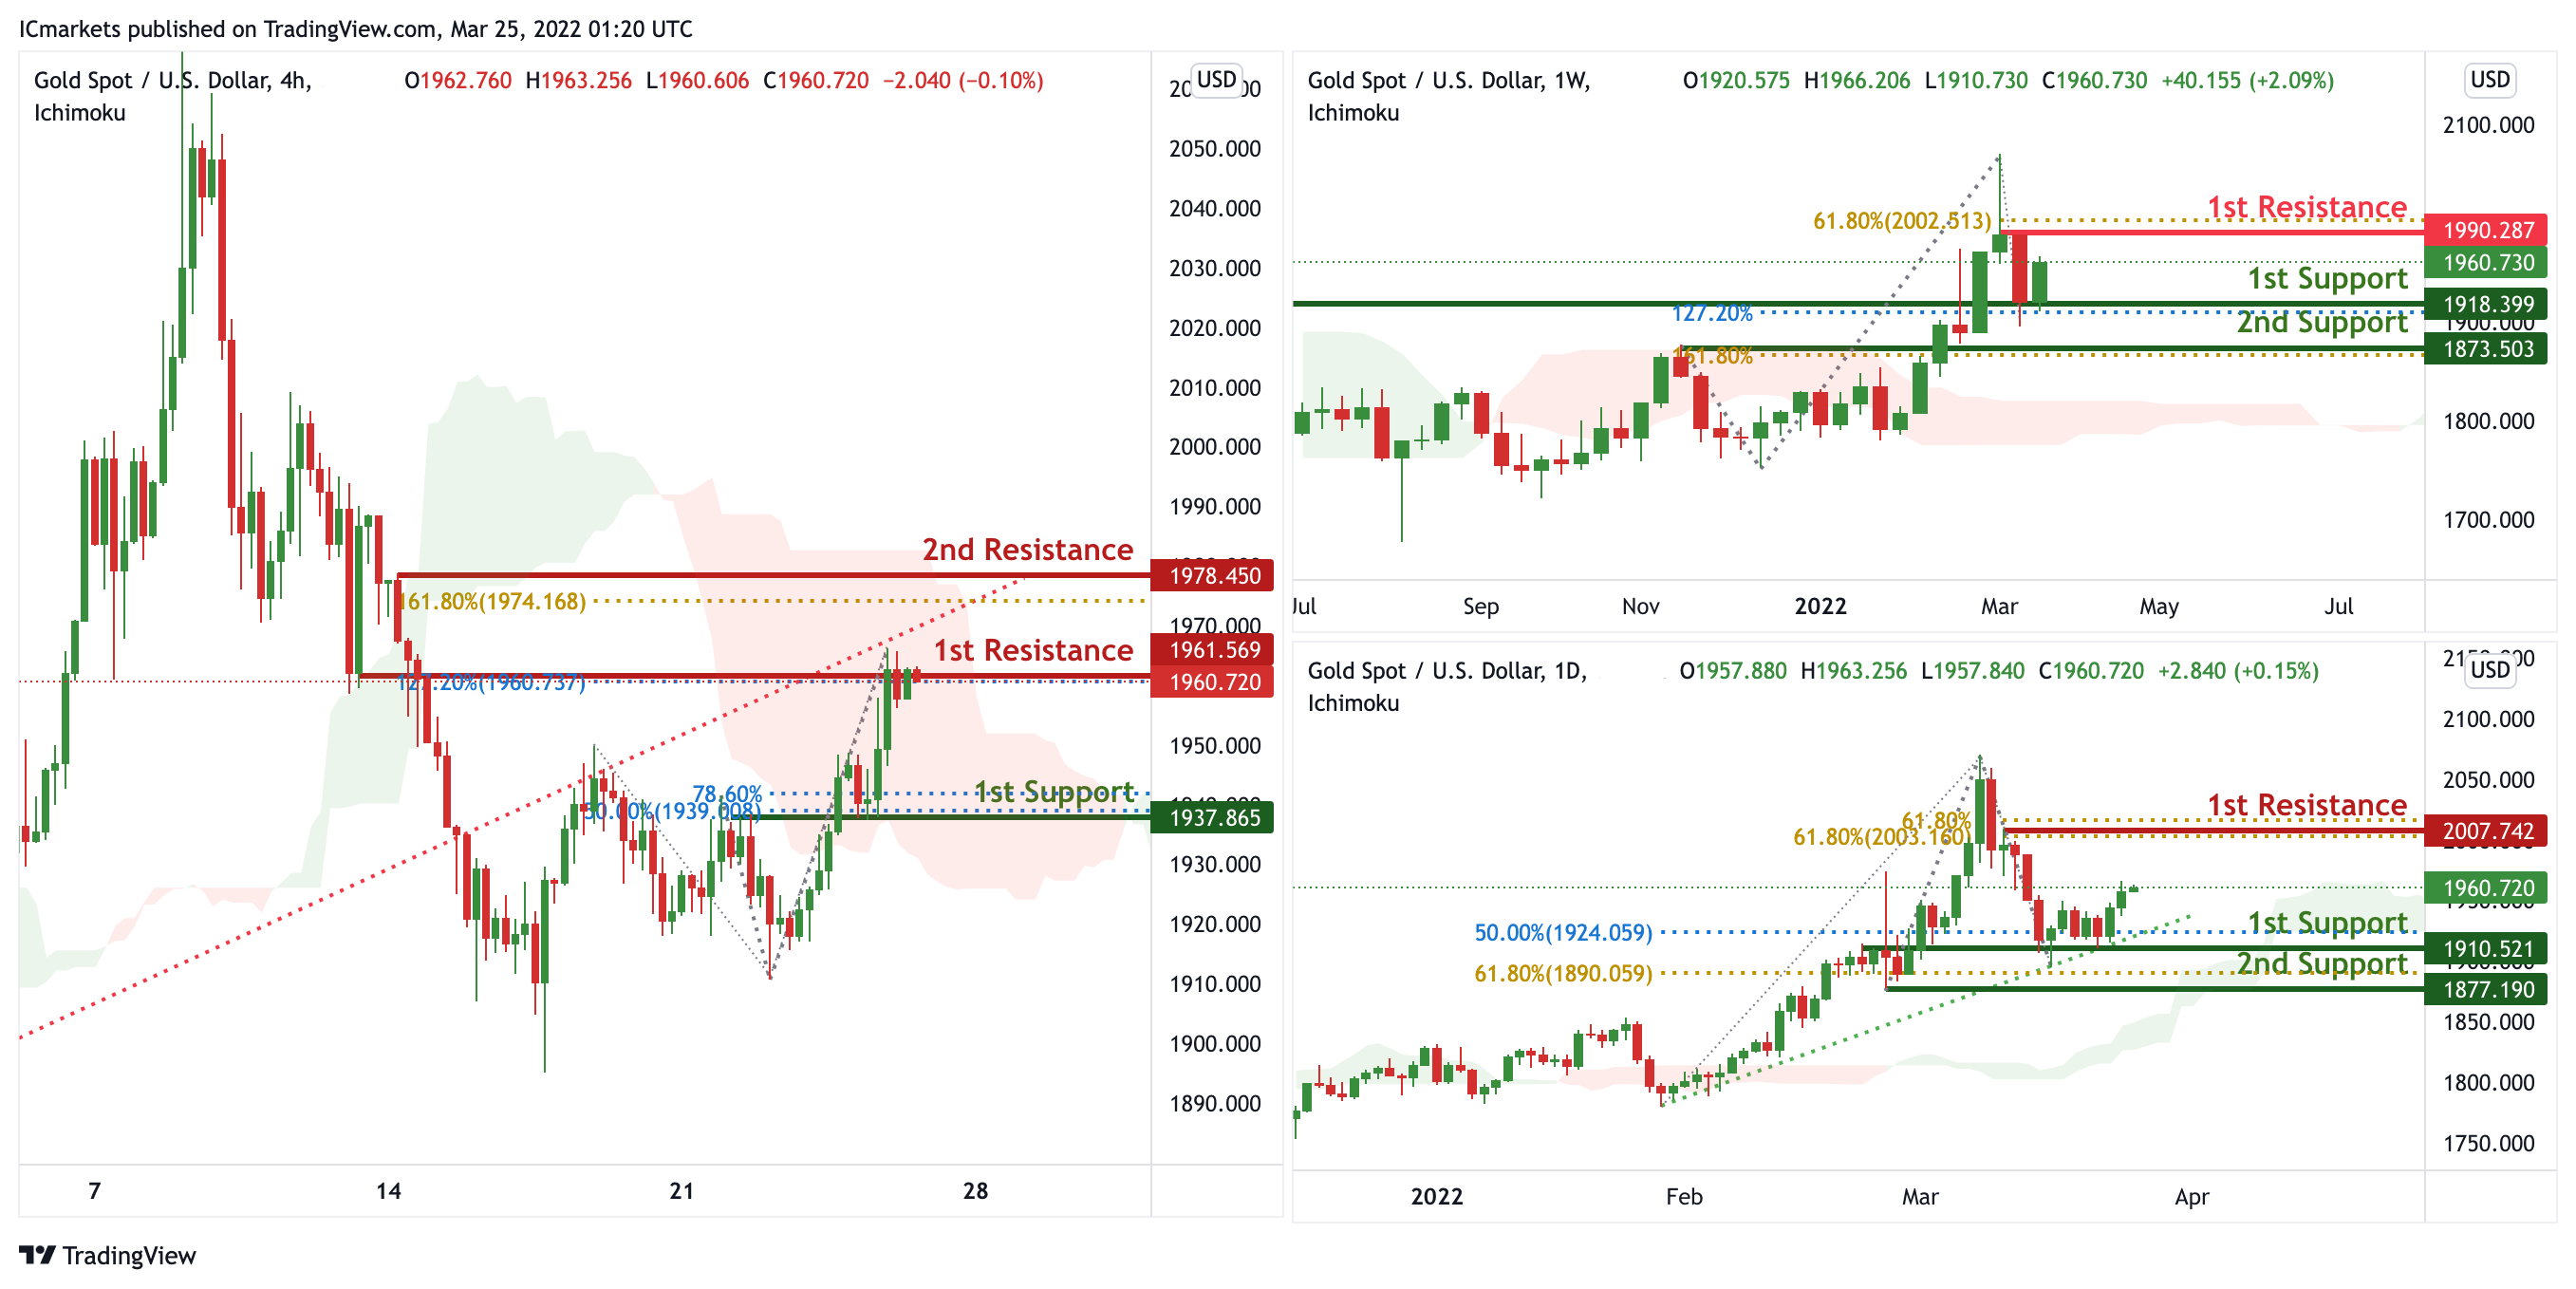
On the weekly, prices are on bullish momentum. We see the potential for a bounce from our 1st support at 1918.399 in line with 127.2% FIbonacci extension towards our 1st resistance at 1990.287 in line with 61.8% FIbonacci retracement. Prices are trading above our ichimoku clouds, further supporting our bullish bias.
On the daily, prices are on bullish momentum and abiding by our ascending trendline support. We see the potential for bullish continuation from our 1st support at 1910.521 in line with 50% Fibonacci retracement towards our 1st resistance at 2007.742 in line with 61.8% Fibonacci retracement and 61.8% Fibonacci Projection. Prices are trading above our ichimoku cloud support, further supporting our bullish bias.
On the H4, prices are on bearish momentum and approaching a key pivot. We see the potential for a dip from our 1st resistance at 1949.865 which is an area of Fibonacci confluences towards our 1st support at 1940.587 in line with 23.6% Fibonacci Retracementand also graphical overlap. Prices are trading below our ichimoku clouds, further supporting our bearish bias.
Areas of consideration:
- 4h 1st support at 1940.587
- 4h 1st resistance at 1949.865
GBP/USD:
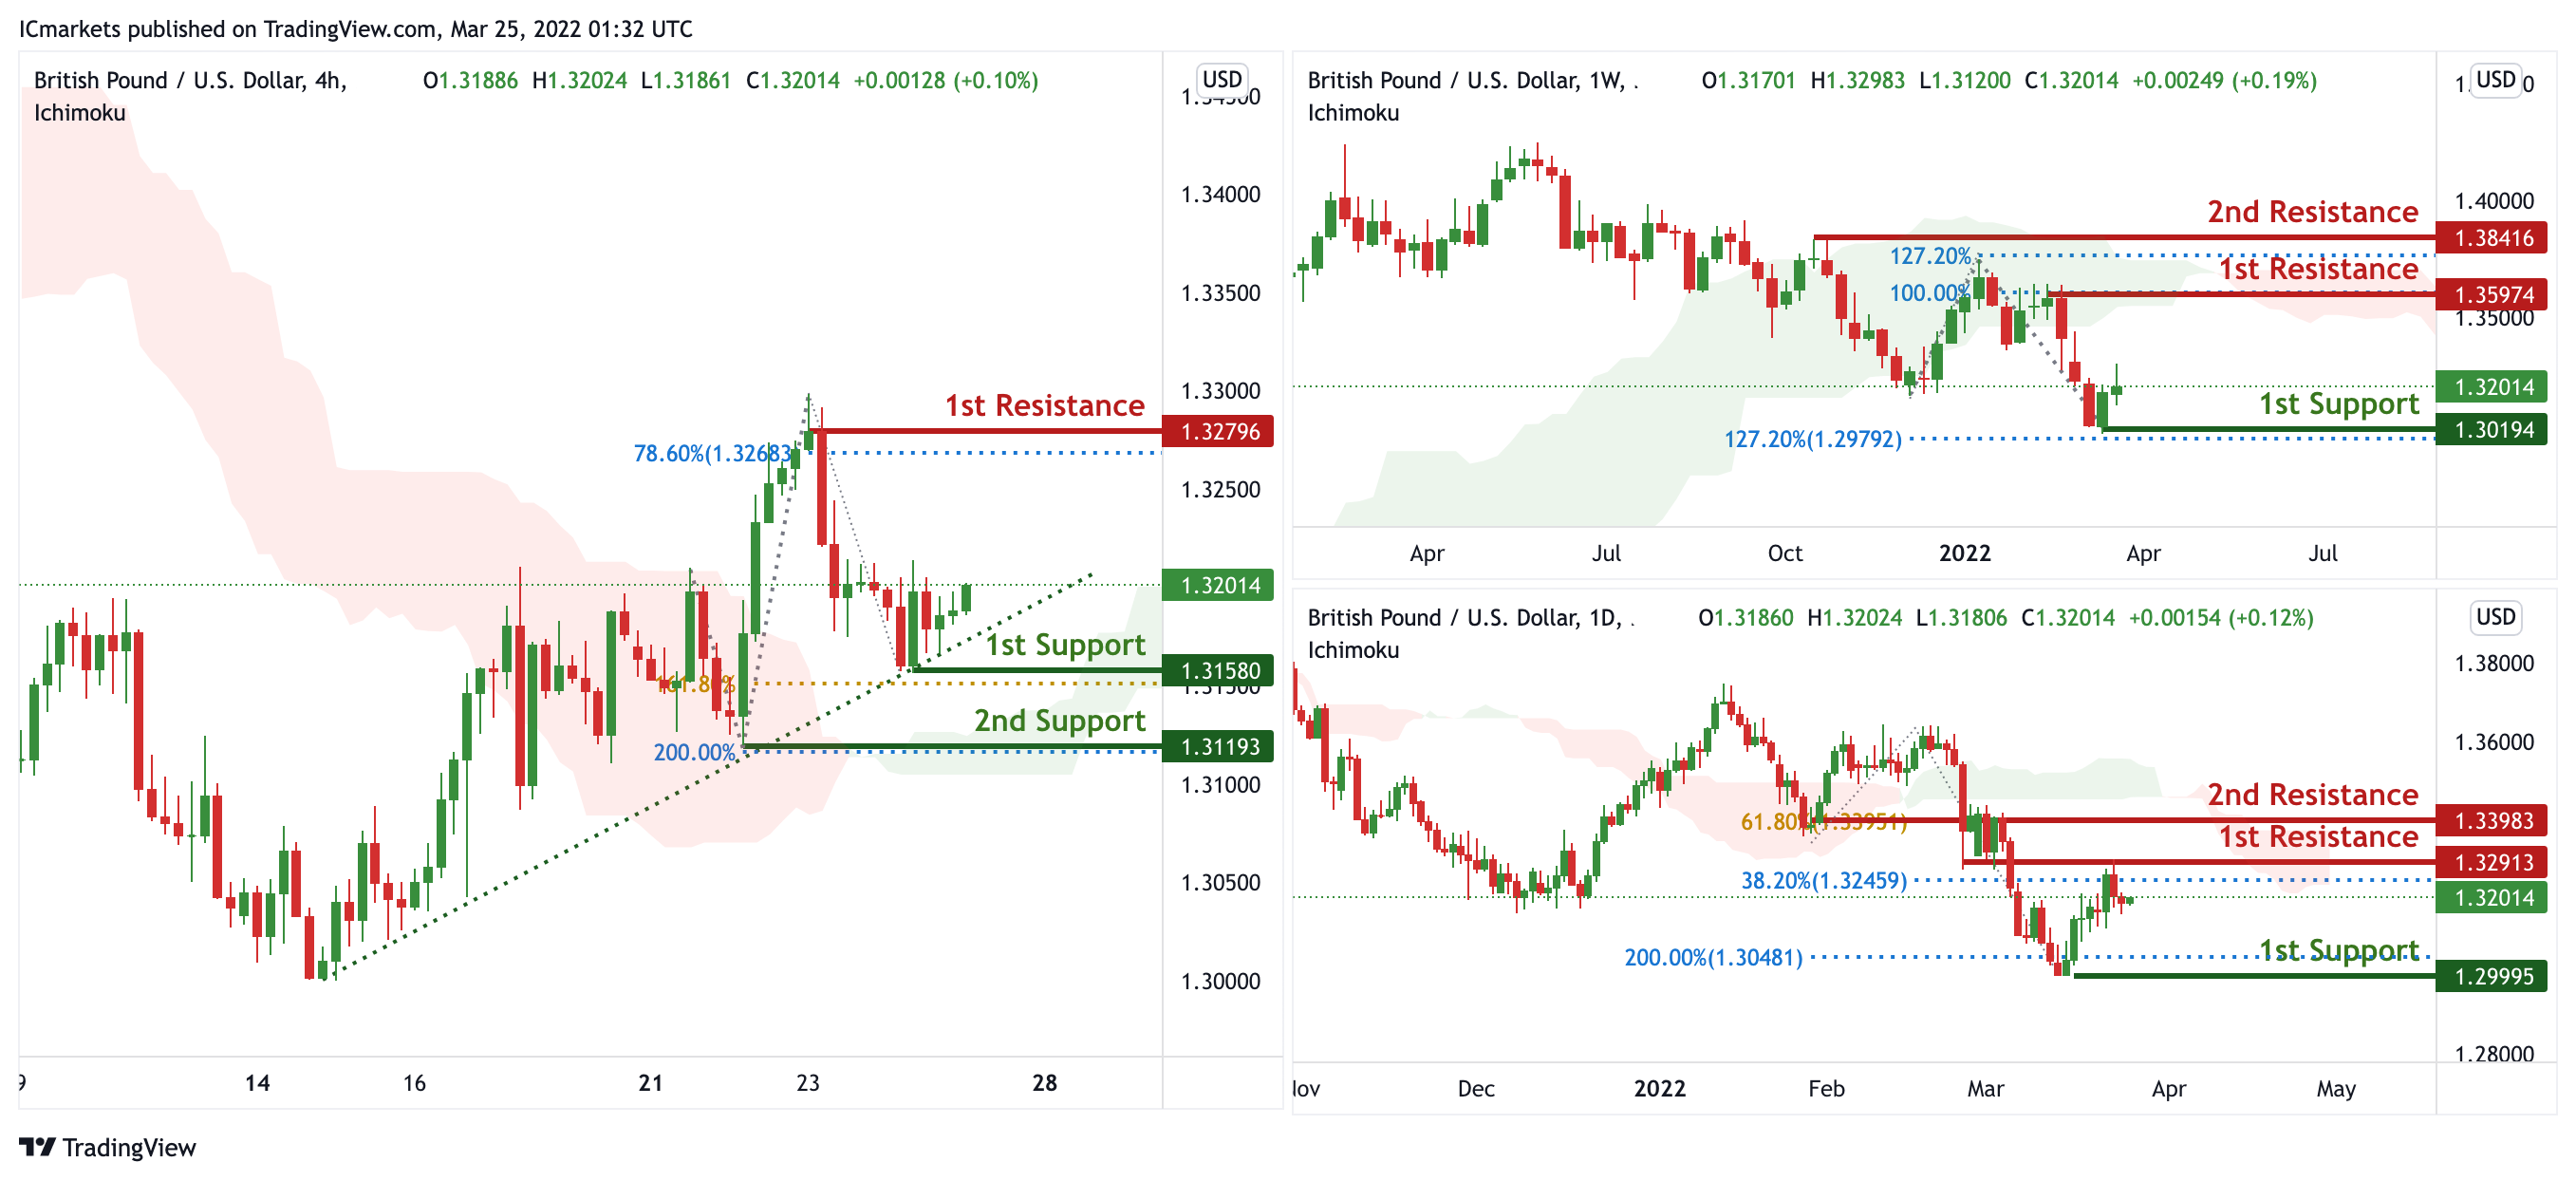
On the weekly, prices are at a swing low. We see the potential for a short bounce from our 1st support at 1.30194 in line with 127.2% Fibonacci extension towards our 1st resistance at 1.35974 in line with 100% Fibonacci Projection.
On the daily, prices are on bearish momentum. We see the potential for a short from our 1st resistance at 1.32913 in line with 38.2% Fibonacci retracement towards our 1st support at 1.29995 in line with 200% Fibonacci Projection. Prices are trading below our ichimoku cloud resistance, further supporting our bearish bias.
On the H4, prices are on bullish momentum and abiding by our ascending trendline support. We see the potential for a bounce from our 1st support at 1.31580 which is a graphical swing low and in line with 161.8% Fibonacci Projection towards our 1st resistance at 1.32796 which is a graphical swing high and in line with 78.6% Fibonacci Projection. Prices are trading above our ichimoku clouds, further supporting our bullish bias. Alternatively, breaking the 1st support will call for a bearish dip towards our 2nd support at 1.31193 which was a graphical swing low and in line with 200% Fibonacci Projection.
Areas of consideration:
- H4 1st resistance at 1.32796
- H4 1st support at 1.31580
USD/CHF:
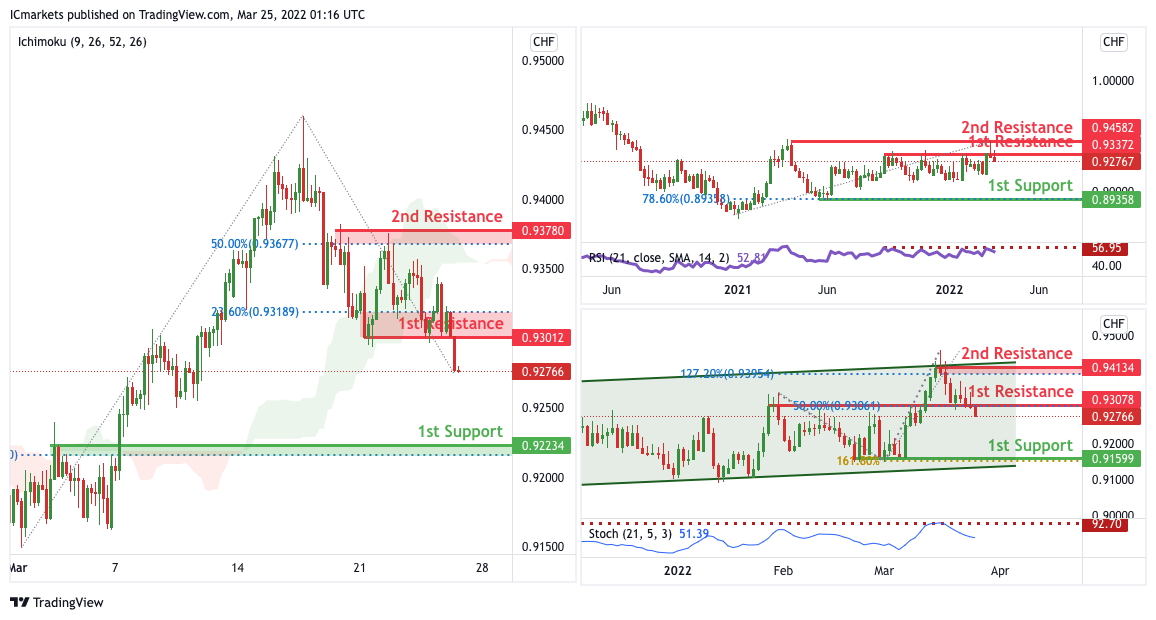
On the Weekly, with price expected to reverse off our RSI indicator, we have a bias that price will drop from 1st resistance to our 1st support .Alternatively, price may break 1st resistance and head for 2nd resistance.
On the Daily, with price expected to reverse off our stochastics indicator, we have a bias that price will drop from 1st resistance to our 1st support .Alternatively, price may break 1st resistance and head for 2nd resistance.
On the H4, with price moving below our ichimoku cloud, we have a bias that price will drop from 1st resistance at 0.93012 in line with the horizontal pullback resistance and 23.6% Fibonacci retracement to 1st support at 0.92234 in line with the pullback support and 78.6% Fibonacci retracement .Alternatively, price may break 1st resistance and head for 2nd resistance at 0.93780 in line with the 50% Fibonacci retracement.
Areas of consideration
- 1st support level 0.92234
- 1st resistance 0.93012
EUR/USD :
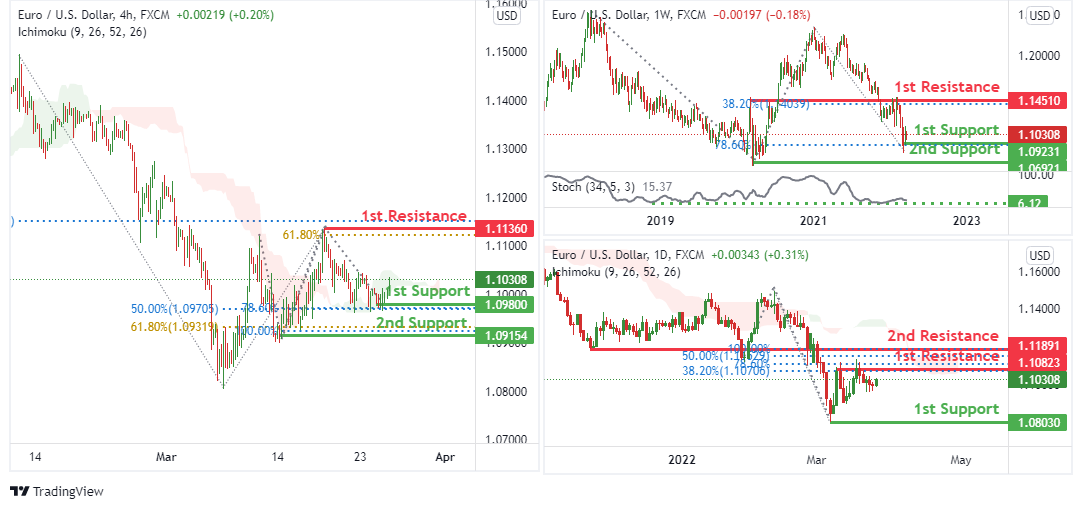
On the weekly, we see the potential for a bullish bounce from our 1st support at 1.09231 in line with 78.6% Fibonacci projection towards our 1st resistance at 1.14510 in line with 38.2% Fibonacci retracement. Our bullish bias is supported by the stochastic indicator where it is at support level.
On the daily, we see the potential for a bearish dip from our 1st resistance at 1.10823 in line with 78.6% Fibonacci projection and 38.2% Fibonacci retracement towards our 1st support at 1.08030 in line with a graphical swing low support. Our bearish bias is supported by price trading below the ichimoku cloud indicator.
On the H4 timeframe, we see the potential for a bullish bounce from our 1st support at 1.09800 in line with 78.6% Fibonacci projection and 50% Fibonacci retracement towards our 1st resistance at 1.11360 in line with 61.8% Fibonacci projection. Our bearish bias is supported by price trading below the ichimoku cloud indicator.
Areas of consideration :
- H4 1st resistance at 1.11360
- H4 1st support at 1.09800
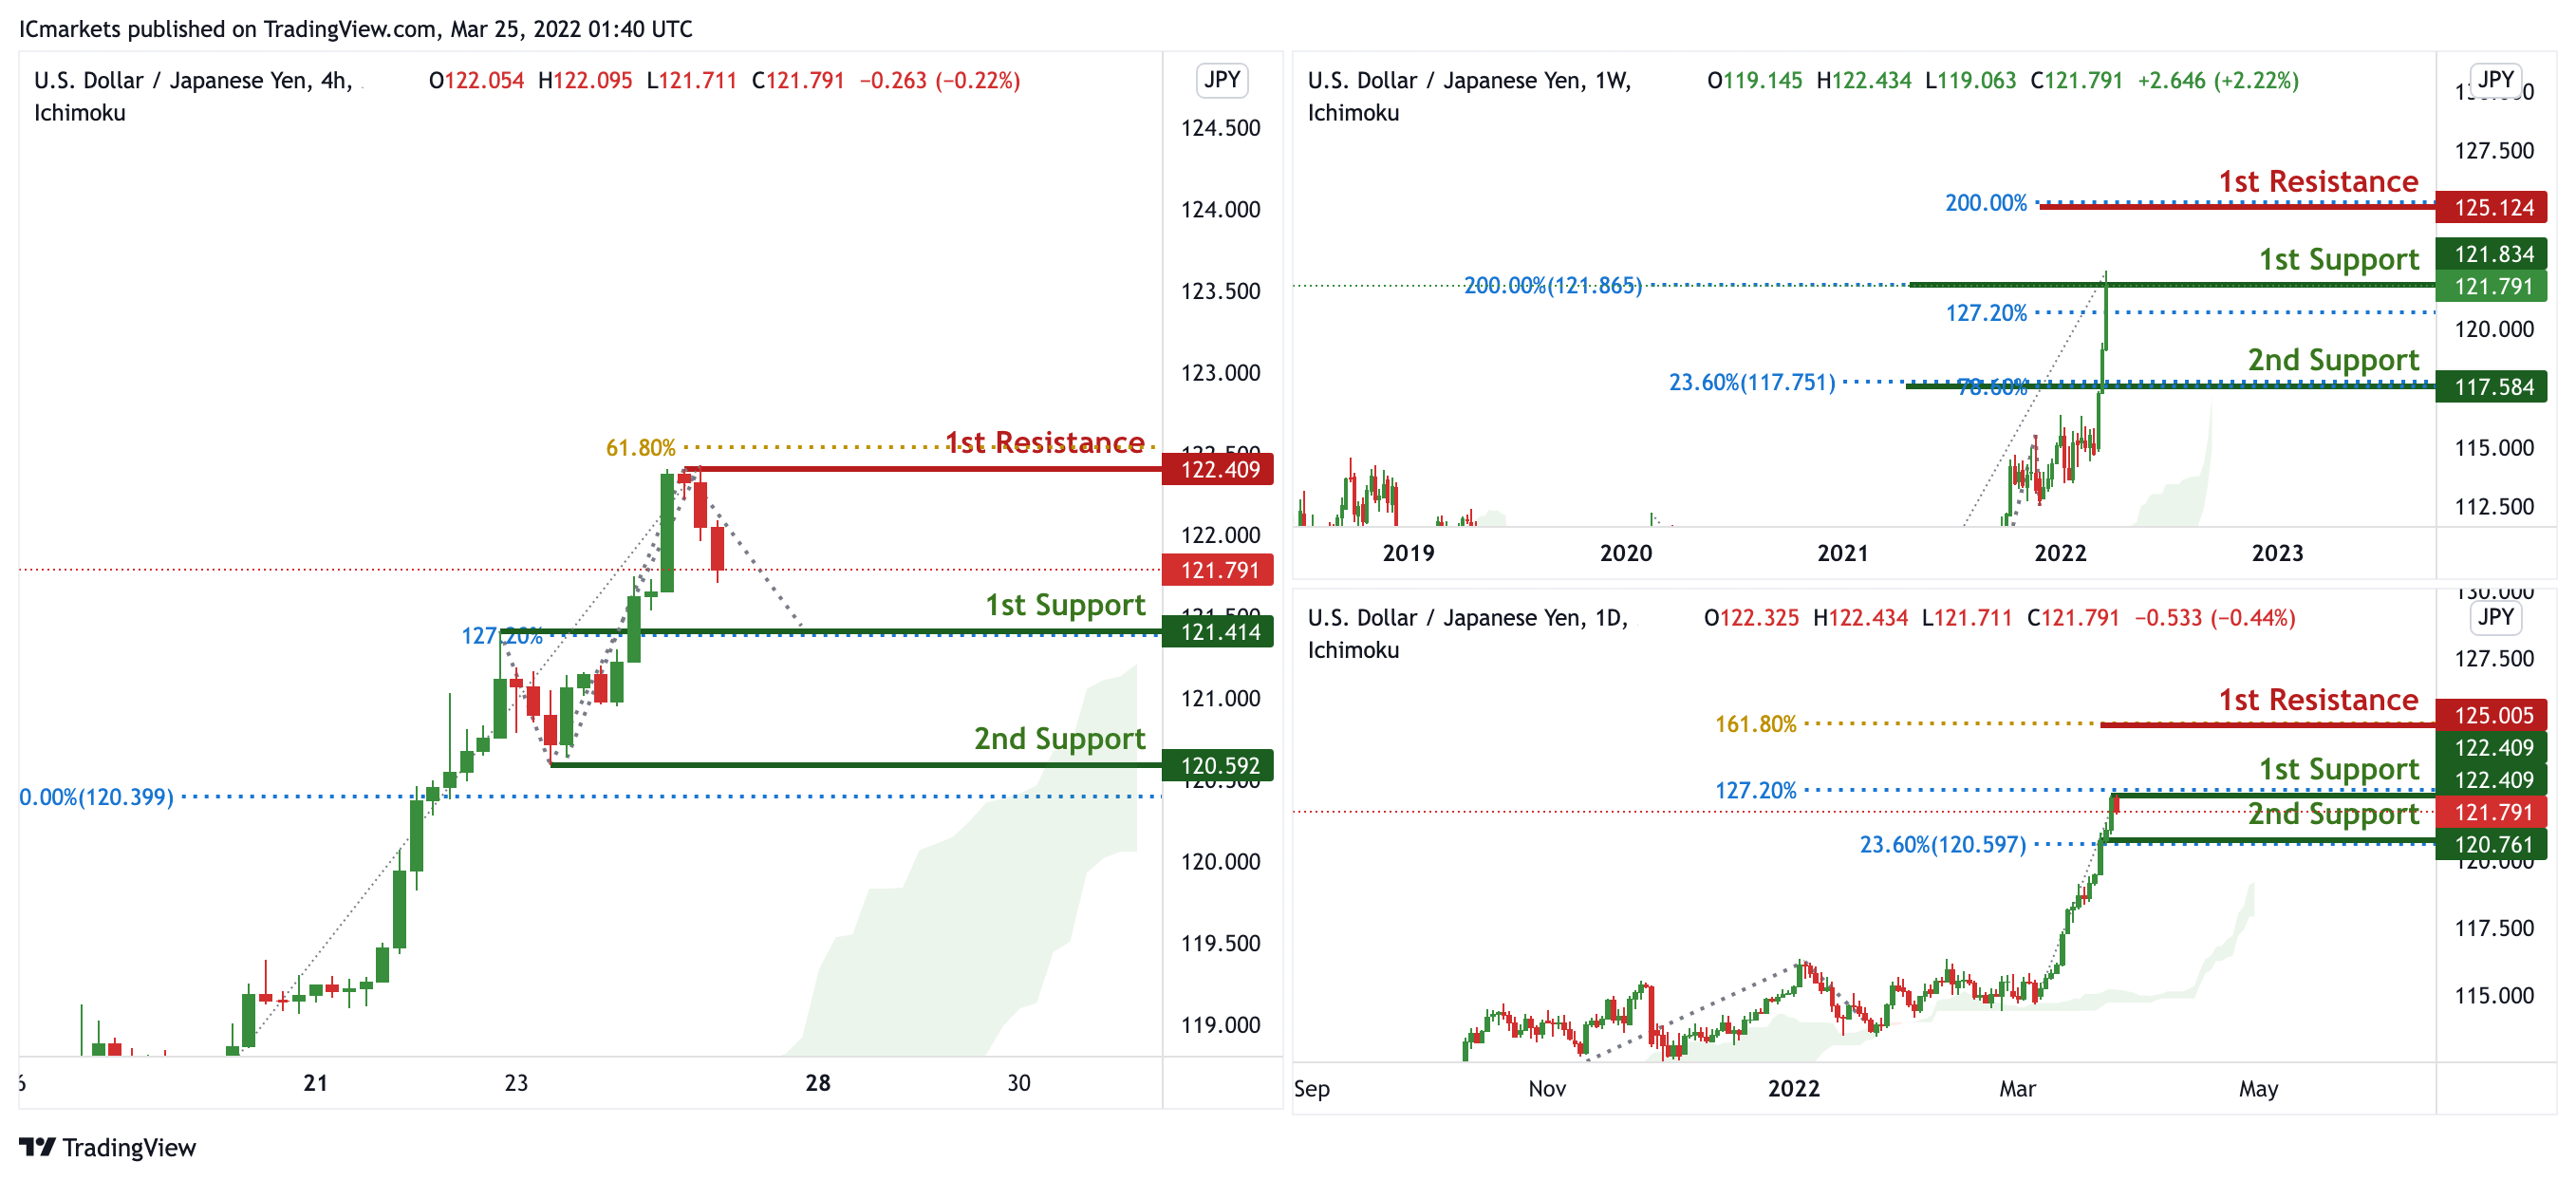
USD/JPY:
On the H4 timeframe, prices have approached pivot and swing high. We see the potential for further bullish continuation from our 1st support at 121.834 in line with 127.2% Fibonacci extension and 200% Fibonacci projection towards our 1st resistance at 125.125 in line with 200% Fibonacci Projection. Prices are trading above our ichimoku cloud support, further supporting our bullish bias.
On the H4 timeframe, prices have approached pivot and swing high. We see the potential for a short pullback from our 1st support at 122.409 in line with 127.2% Fibonacci extension towards our 1st support at 120.761 in line with 23.6% Fibonacci retracement.
On the H4 timeframe, prices have approached pivot and swing high. We see the potential for a short pullback from our 1st resistance at 122.409 in line with 61.8% Fibonacci Projection towards our 1st support at 121.414 in line with 127.2% Fibonacci Retracement. Divergence is spotted on RSI, further supporting our bearish bias.
Areas of consideration:
- H4 time frame, 1st resistance at 122.409
- H4 time frame, 1st support at 121.414
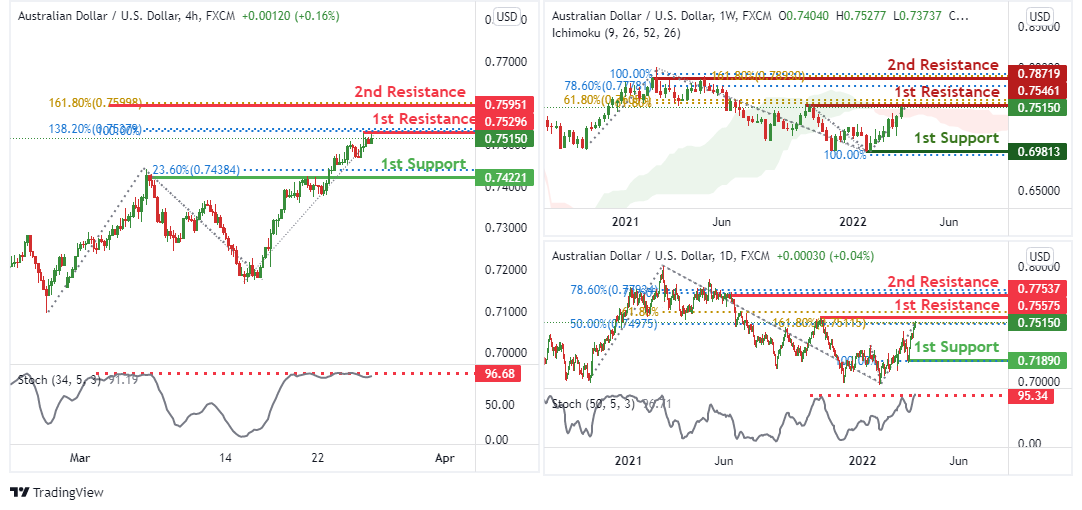
AUD/USD:
On the weekly, we see the potential for a bearish reversal from our 1st resistance at 0.75461 in line with 61.8% Fibonacci retracement and 61.8% Fibonacci projection towards our 1st support at 0.69813 in line with 100% Fibonacci projection. Price is trading below the ichimoku cloud indicator, further supporting our bearish bias.
On the daily, we see the potential for a bearish reversal from our 1st resistance at 0.75575 in line with 61.8% Fibonacci projection, 161.8% Fibonacci extension and 50% Fibonacci retracement towards our 1st support at 0.71890 in line with 100% Fibonacci projection. Our bearish bias is supported by the stochastic indicator where it is at resistance level.
On the H4 timeframe, we see the potential for a bearish reversal from our 1st resistance at 0.75296 in line with 100% Fibonacci projection and 138.2% Fibonacci extension towards our 1st support at 0.74221 in line with 23.6% Fibonacci retracement. Our bearish bias is supported by the stochastic indicator where it is at resistance level.
Areas of consideration
- H4 1st resistance at 0.75296
- H4 1st support at 0.74221
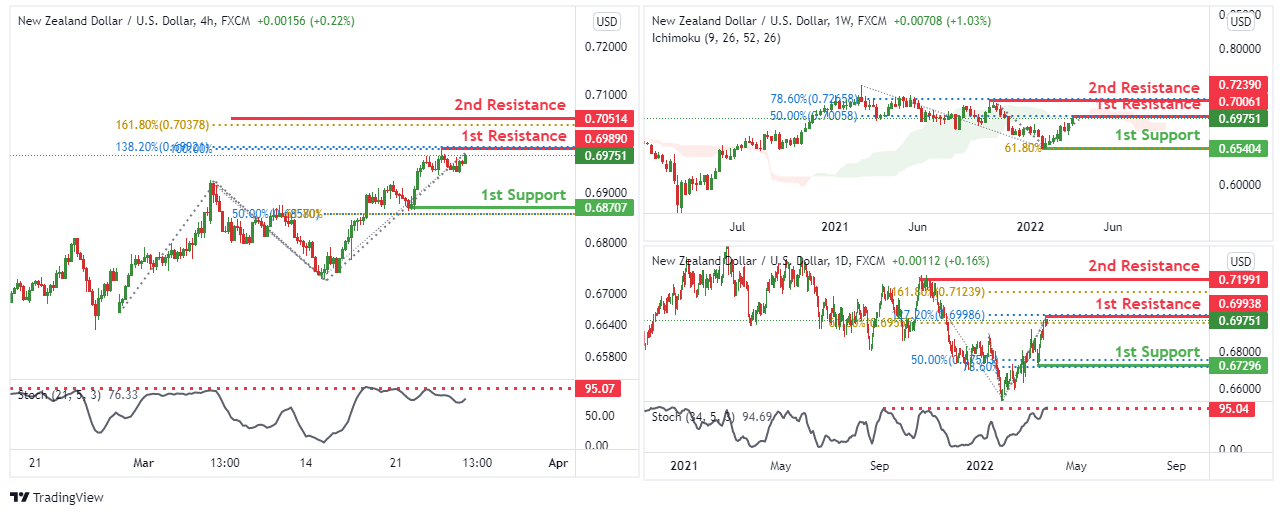
NZD/USD:
On the weekly, we see the potential for a bearish reversal from our 1st resistance at 0.70061 in line with 50% Fibonacci retracement towards our 1st support at 0.65404 in line with 61.8% Fibonacci projection. Price is trading below the ichimoku cloud indicator, further supporting our bearish bias.
On the daily, we see the potential for a bearish reversal from our 1st resistance at 0.69938 in line with 61.8% Fibonacci retracement and 127.2% Fibonacci extension towards our 1st support at 0.67296 in line with 78.6% Fibonacci projection and 50% Fibonacci retracement. Our bearish bias is supported by the stochastic indicator where it is at resistance level.
On the H4 timeframe, we see the potential for a bearish reversal from our 1st resistance at 0.69890 in line with 100% Fibonacci projection and 138.2% Fibonacci extension towards our 1st support at 0.68707 in line with 61.8% Fibonacci projection and 50% Fibonacci retracement. Our bearish bias is supported by the stochastic indicator where it is at resistance level.
Areas of consideration :
- H4 1st resistance at 0.69890
- H4 1st support at 0.68707
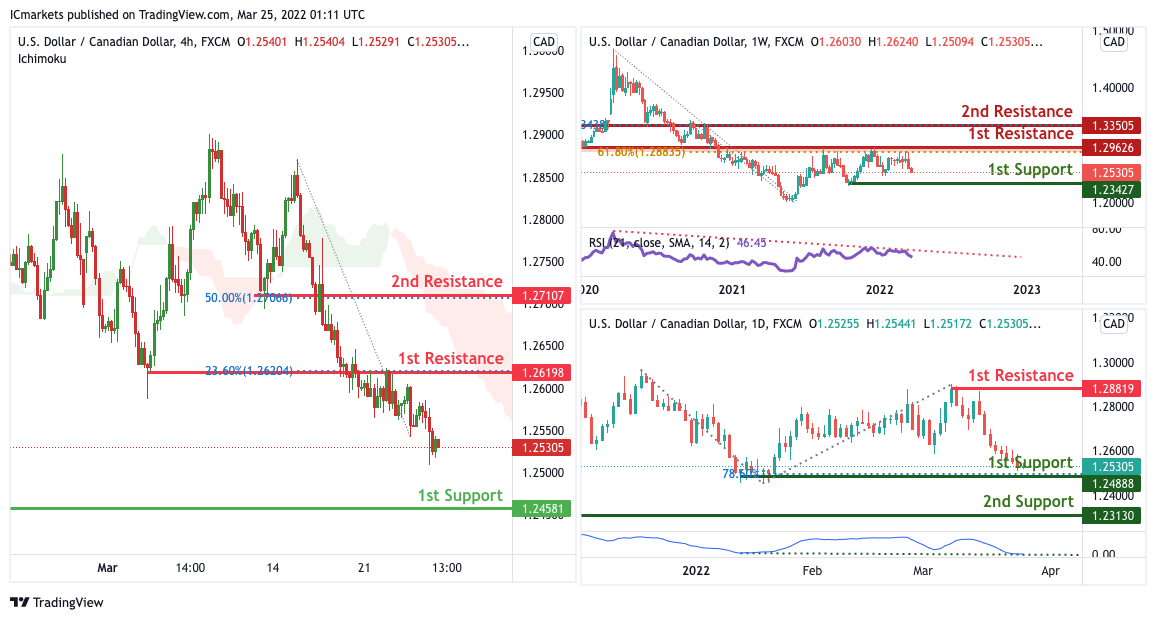
USD/CAD:
On the Weekly, with price expected to reverse off our RSI indicator, we have a bias that price will drop from 1st resistance to our 1st support .Alternatively, price may break 1st resistance and head for 2nd resistance.
On the Daily, with price moving expected to bounce off the stochastics indicator, we have a bias that price will rise to our 1st resistance from our 1st support. Alternatively, price may break 1st support structure and head for 2nd support.
On the H4, with price moving below our ichimoku cloud, we have a bias that price will drop from 1st resistance at 1.26198 in line with the horizontal pullback resistance and 23.6% Fibonacci retracement to 1st support at 1.24581 in line with the swing low support .Alternatively, price may break 1st resistance and head for 2nd resistance at 1.27107 in line with the horizontal pullback resistance and 50% Fibonacci retracement.
Areas of consideration:
- H4 time frame, 1st support at 1.24581
- H4 time frame, 1st resistance at 1.26198
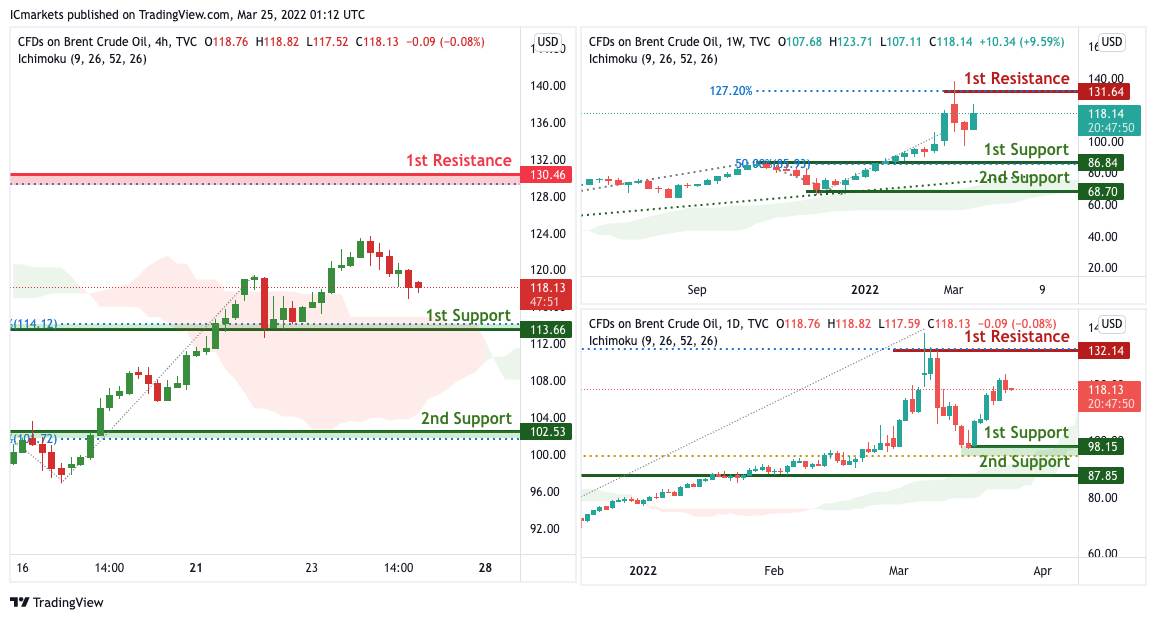
OIL:
On the weekly, with price moving above the ichimoku cloud, we have a bias that price will rise to our 1st resistance from our 1st support. Alternatively, price may break 1st support structure and head for 2nd support.
On the Daily, with price moving above the ichimoku cloud, we have a bias that price will rise to our 1st resistance from our 1st support. Alternatively, price may break 1st support structure and head for 2nd support.
On the H4, with price moving above the ichimoku cloud, we have a bias that price will rise to our 1st resistance at 130.46 in line with the 78.6% Fibonacci retracement from our 1st support at 113.66 in line with the horizontal overlap support and 23.6% Fibonacci retracement. Alternatively, price may break 1st support structure and head for 2nd support at 102.53 in line with the horizontaL overlap support and 78.6% Fibonacci retracement.
Areas of consideration:
- H4 time frame, 1st resistance of 130.46
- H4 time frame, 1st support of 113.66
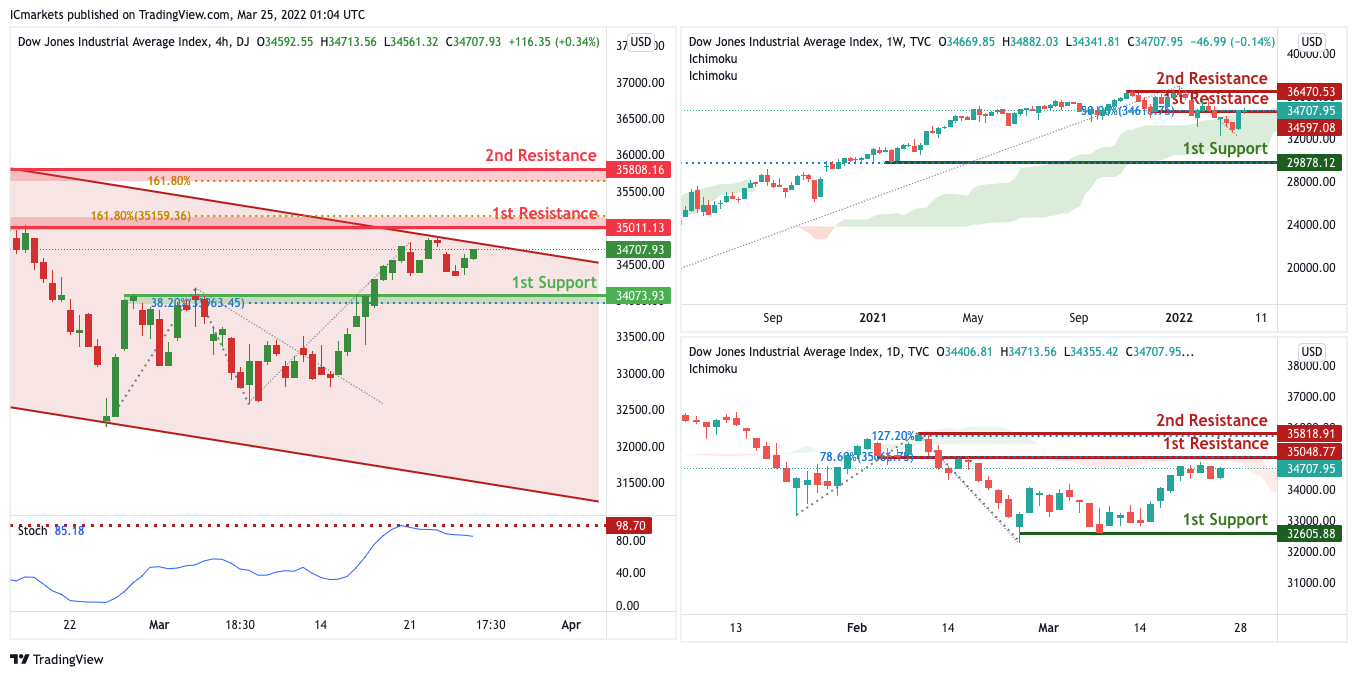
Dow Jones Industrial Average:
On the Weekly, with price expected to reverse off the resistance of the ichimoku indicator, we have a bias that price will drop from 1st resistance to our 1st support .Alternatively, price may break 1st resistance and head for 2nd resistance.
On the Daily, with price expected to reverse off the resistance of the ichimoku indicator, we have a bias that price will drop from 1st resistance to our 1st support .Alternatively, price may break 1st resistance and head for 2nd resistance.
On the H4, with price expected to reverse off the stochastics level, we have a bias that price will drop from 1st resistance at 35011 in line with the horizontal overlap resistance and 161.8% Fibonacci extension to 1st support at 34073 in line with the pullback support .Alternatively, price may break 1st resistance and head for 2nd resistance at 35808 in line with the 161.8% Fibonacci extension.
Areas of consideration :
- H4 1st support at 34073
- H4 1st resistance at 35011
The accuracy, completeness and timeliness of the information contained on this site cannot be guaranteed. IC Markets does not warranty, guarantee or make any representations, or assume any liability regarding financial results based on the use of the information in the site.
News, views, opinions, recommendations and other information obtained from sources outside of www.icmarkets.com.au, used in this site are believed to be reliable, but we cannot guarantee their accuracy or completeness. All such information is subject to change at any time without notice. IC Markets assumes no responsibility for the content of any linked site.
The fact that such links may exist does not indicate approval or endorsement of any material contained on any linked site. IC Markets is not liable for any harm caused by the transmission, through accessing the services or information on this site, of a computer virus, or other computer code or programming device that might be used to access, delete, damage, disable, disrupt or otherwise impede in any manner, the operation of the site or of any user’s software, hardware, data or property.