Key risk events today:
French Flash Services; French Flash Manufacturing PMI; German Flash Manufacturing PMI; German Flash Services PMI; MPC Member Haskel Speaks; EUR Flash Manufacturing PMI; EUR Flash Services PMI; ECB President Lagarde Speaks; UK Flash Manufacturing PMI; UK Flash Services PMI; Canada Core Retail Sales m/m; Canada Retail Sales m/m; US Flash Manufacturing PMI; US Flash Services PMI.
(Italics represents previous analysis and outside sources)
EUR/USD:
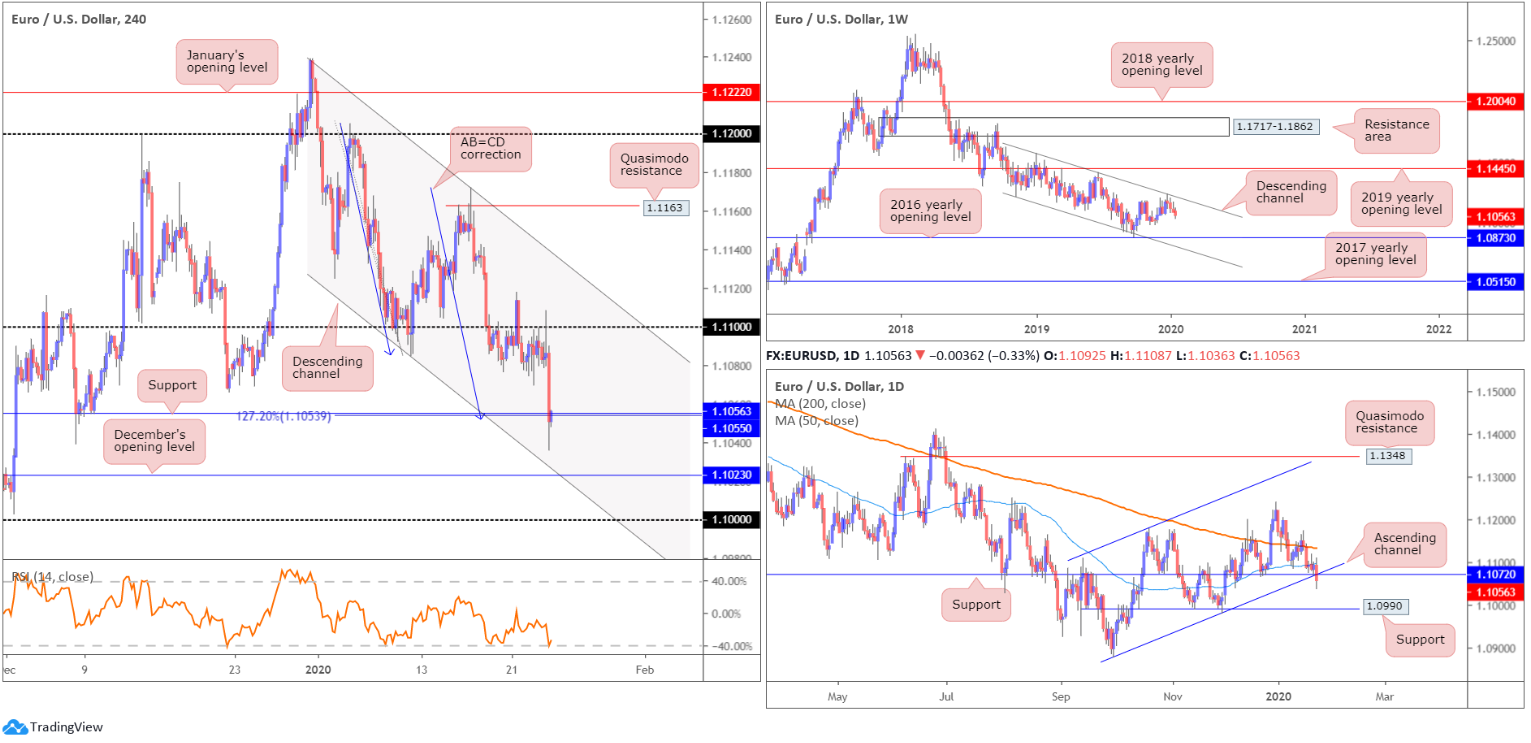
Europe’s single currency extended its decline vs. the buck Thursday, descending to fresh yearly lows of 1.1036. EUR/USD derived fleeting bullish impetus from fractionally firmer underlying inflation assertions in ECB President Lagarde’s post-meeting press conference, though turned tail after Lagarde stated the central bank will take climate change into its considerations. The crisis may trigger the usage of additional monetary stimulus.
Recent downside had the H4 candles shake hands with support at 1.1055, which happens to combine with a 127.2% AB=CD correction (blue arrows). Despite surpassing the level by 20 points, missing channel support (extended from the low 1.1085) by a handful of points, price is seen holding at the base, as we write. Beyond 1.1055, traders likely have their crosshairs fixed on December’s opening level at 1.1023. Indicator-based traders may also wish to pencil in the relative strength index (RSI) is testing oversold territory.
Against the backdrop of shorter-term flow, weekly price continues to reflect a bearish tone beneath channel resistance, drawn from the high 1.1569. The next downside objective on this timeframe falls in around the 2016 yearly opening level at 1.0873 followed by channel support, taken from the low 1.1109.
Interestingly, daily movement overthrew support priced in at 1.1072 as well as channel support, taken from the low 1.0879, in recent trade. Continued selling from this point has support at 1.0990 in sight.
Areas of consideration:
The fact price whipsawed through H4 support at 1.1055, likely tripping most sell stops, and both weekly and daily price exhibiting scope to navigate lower, entering long from the current H4 support may fall short.
As an alternative, bearish themes at the underside of 1.1055 may be on the radar for many traders this morning, targeting December’s opening level at 1.1023 as the initial take-profit zone, followed by the 1.10 handle and then daily support at 1.0990. Conservative traders wishing to add a little more confirmation to the mix may opt to wait and see if a H4 or H1 bearish candlestick signal forms, before pulling the trigger. Not only does this help recognise seller intent, it provides entry and risk levels to work with.
GBP/USD:
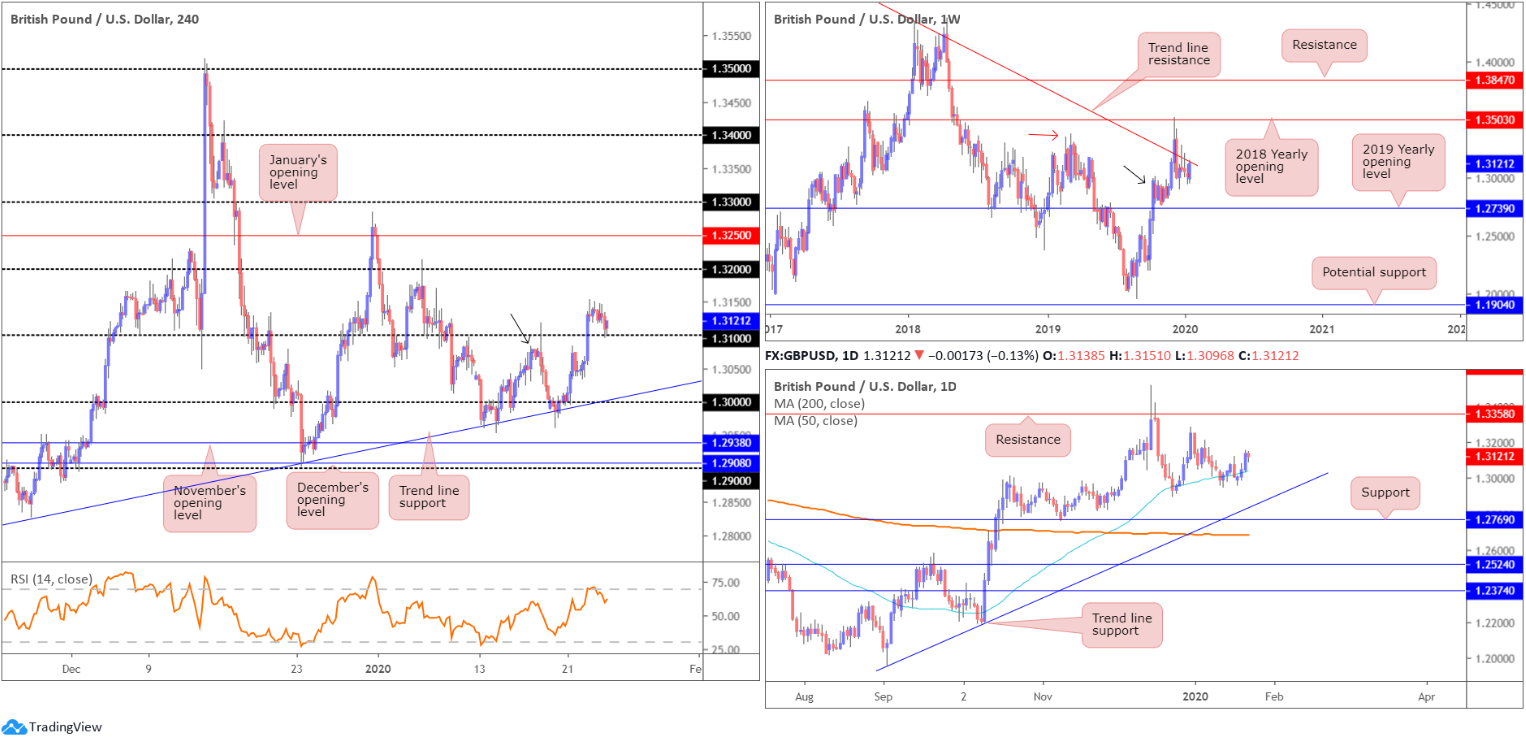
Relatively subdued, sterling mildly dipped lower Thursday and refreshed daily lows around the 1.31 mark. As the market assesses the possibility of a BoE rate cut, focus shifts to todays UK flash PMI metrics, with consensus forecasting a rise across the board.
1.31, assuming upbeat UK data, is expected to remain firm today. In terms of upside targets, Wednesday’s high 1.3153 is in sight, closely followed by the 1.32 handle and January’s opening level at 1.3250. In conjunction with H4 technical structure, daily activity is seen gaining north of the 50-day SMA (blue – 1.3040). With respect to resistance on the daily timeframe, the only levels of interest right now sit at the 1.3284 December 31st high and 1.3358, which capped upside since mid-June 2019.
The only grumble, as far as further buying goes, is weekly price. The pair trades beneath long-standing trend line resistance, pencilled in from the high 1.5930. The flipside to this, nonetheless, is price defending nearby demand around the 1.2939 region (black arrow), likely seduced by the recent break of the notable high at 1.3380 (red arrow).
Areas of consideration:
Technically, a strong bullish candlestick close off 1.31 is likely enough to entice buying, prior to the UK’s data. Protective stop-loss placement is tricky; the most logical location appears to be a few points below a local H4 Quasimodo resistance-turned support at 1.3083 (black arrow).
AUD/USD:
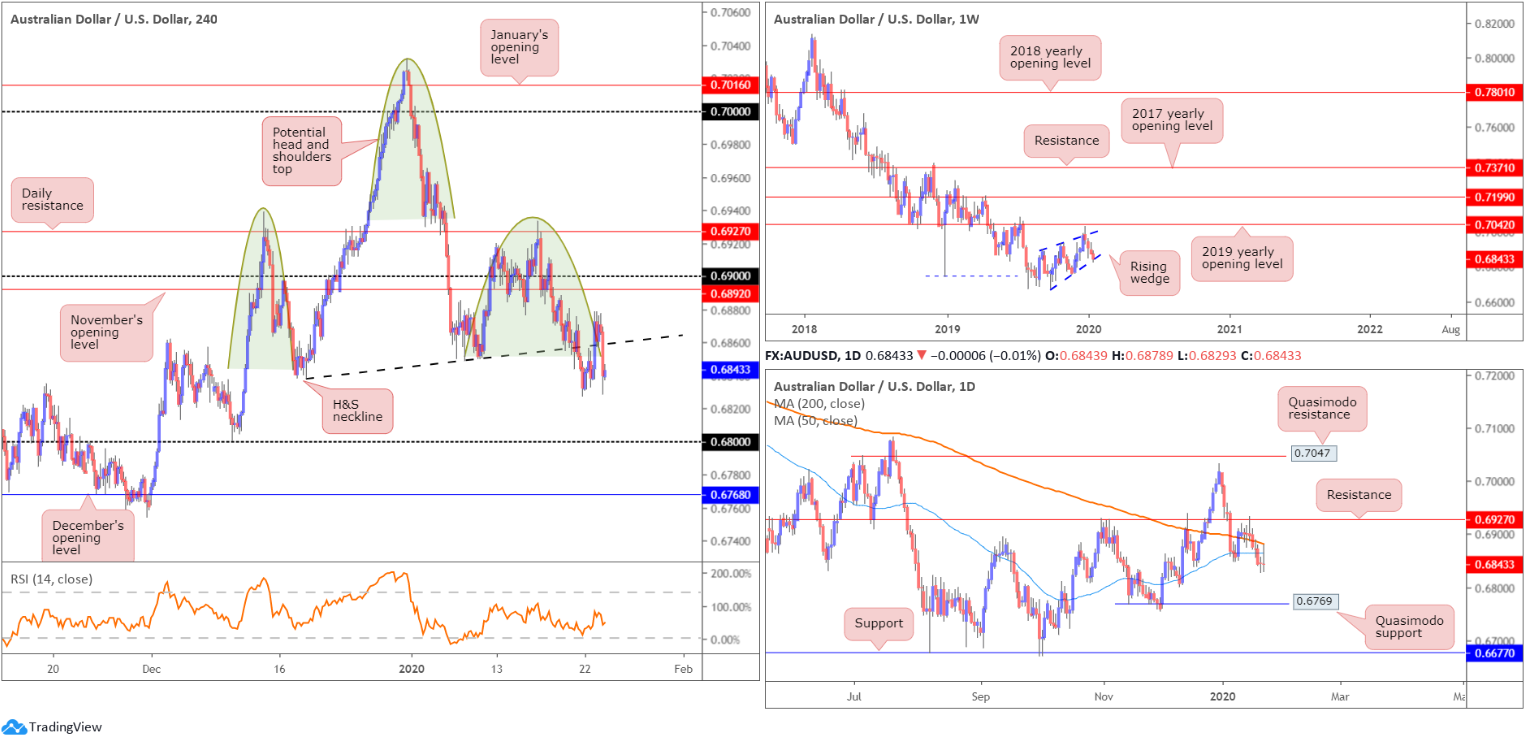
Thursday kicked off strong, lifted to session highs at 0.6878 from 0.6839 on the back of stellar Australian job’s data. According to the Australian Bureau of Statistics, employment increased by 28,900 to 12,981,600 people. Full-time employment decreased by 300 to 8,834,700 people and part-time employment increased by 29,200 to 4,146,900 people. The unemployment rate decreased by 0.1 pts to 5.1%. The participation rate remained steady at 66.0% and monthly hours worked in all jobs increased by 8.2 million hours to 1,791.1 million hours.
However, as the US dollar index found a ‘floor’ off a daily channel resistance-turned support, taken from the high 99.67, AUD/USD pared earlier gains and concluded the day unchanged.
Traders who read previous reports may recall the following piece:
H4 price has also been chalking up a potential head and shoulders top pattern since mid-December 2019 (left shoulder sports a top at 0.6938, right shoulder at 0.6933 and the head at 0.7031 – green). The neckline is drawn from the 0.6838 December 18 low and the 0.6850 January 9 low (black line). Traditionally, traders wait for a close beneath the neckline to trigger shorts; others, however, may attempt a short at the right shoulder or even at the formation of the head.
As evident from the H4 timeframe, price closed beneath the H&S neckline on Tuesday and remained south of the line Wednesday and also closed lower on Thursday. Although an initial (structure) target can be seen at 0.68, H&S traders will be looking for much lower levels (calculation from the head to neckline added to the breakout point).
On a wider perspective, weekly action, since registering a bottom in late September at 0.6670, has been carving out what appears to be a rising wedge formation, typically considered a continuation pattern. Over the past three weeks, and also so far this week, price declined back into the rising wedge, following a minor whipsaw through the top edge of the said wedge, missing the 2019 yearly opening level at 0.7042 by a mere ten points. With the primary downtrend in full force since topping at 0.8135, in early 2018, a break lower beyond the lower edge of the noted wedge formation could be seen. This would trigger weighty sell stops, both from lower-timeframe traders entering long the correction and longer-term traders’ breakout sell orders.
Price action on the daily timeframe remains marginally beneath both the 200-day SMA (orange – 0.6881) and 50-day SMA (blue – 0.6864), underscoring a potential move towards Quasimodo support at 0.6769.
Areas of consideration:
There will likely already be traders short this market on Tuesday’s H4 close south of the H&S neckline. Stop-loss placement potentially falls in above the right shoulder 0.6933, above the round number 0.69 or November’s opening level at 0.6892.
For conservative traders, entry may form on the back of a successful H4 retest at the H&S neckline, in the shape of a notable bearish candlestick pattern (entry and risk can be determined according to the candlestick’s structure).
USD/JPY:
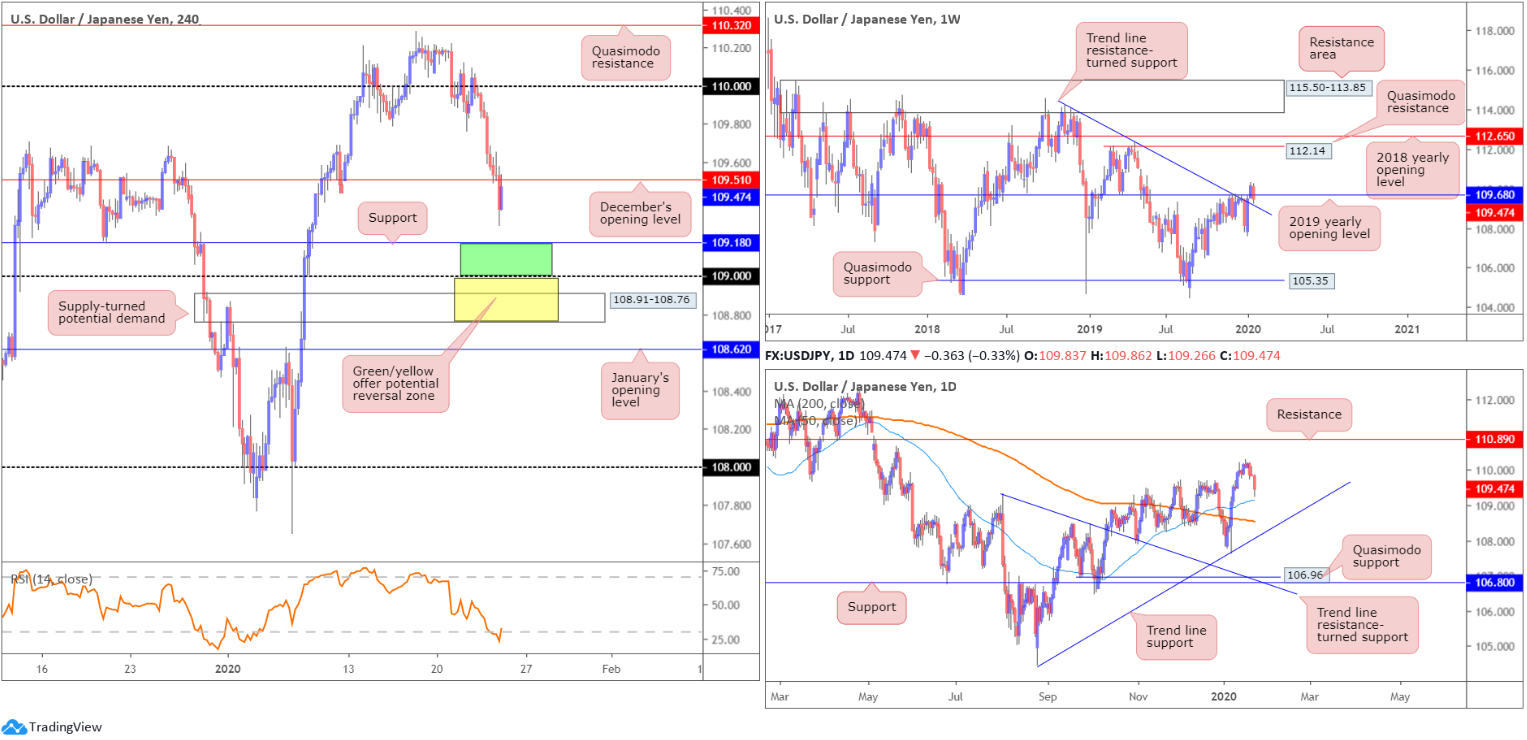
The US dollar carved out its third consecutive daily loss against the Japanese yen Thursday, erasing more than 35 points. Demand for the safe-haven Japanese yen increased amid coronavirus concerns, with USD/JPY gliding through December’s opening level at 109.51 on the H4 timeframe and missing support at 109.18 by a few points. Another layer of possible support on the H4 timeframe resides close by at the 109 handle, closely shadowed by a supply-turned potential demand zone at 108.91-108.76. A move back above 109.51 may lead to 110 re-entering view. Also of note is the relative strength index (RSI) testing oversold waters.
Higher-timeframe action, on the other hand, shows price action testing the 2019 yearly opening level at 109.68, along with trend line resistance-turned support, taken from the high 114.23. In tandem with weekly structure, daily price is poised to approach the 50-day SMA (blue – 109.15), parked a few points south of current price.
Areas of consideration:
H4 support mentioned above at 109.18 is in focus today. Not only does the base align with the 50-day SMA value, the weekly trend line support highlighted above also converges with the support level.
Traders are likely watching the area between 109 and 109.18 (green – H4) as a possible reversal zone. However, given round numbers are prone to whipsaws, the H4 demand area at 108.91-108.76 could also enter the fight before buyers make an appearance (yellow).
Therefore, an overall support zone exists between 108.76 and 109.18. With the area sporting a 40-point plus range, some traders may wait for a H4 bullish candlestick pattern to form and enter based on this structure; others could enter at the extreme of the zone, the H4 demand 108.91-108.76. Protective stop-loss orders can then be positioned a few points beneath the said demand.
USD/CAD:
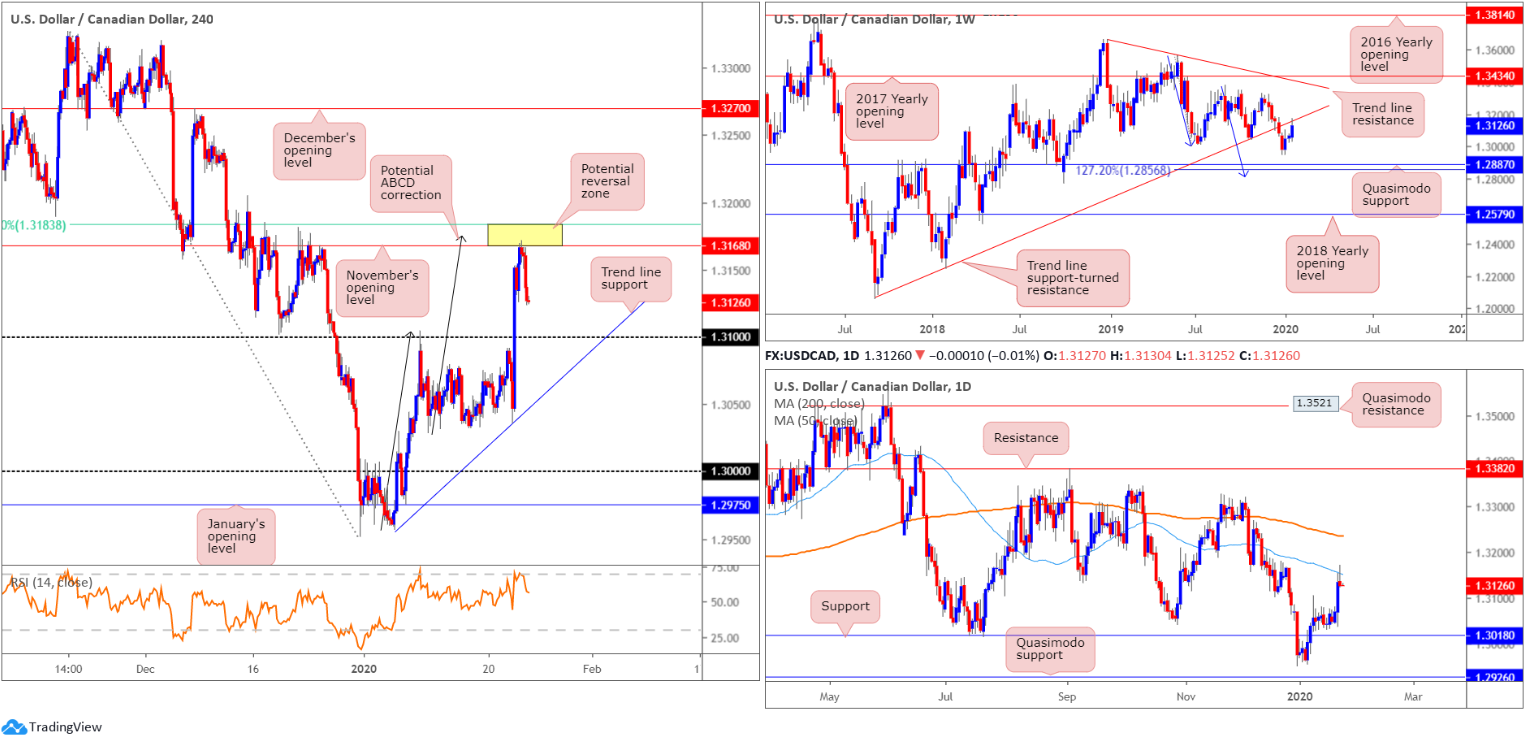
USD/CAD traded to highs of 1.3152 Wednesday, lifted on dovish BoC and soft oil prices. Although the pair extended its advance Thursday, reaching highs of 1.3171, higher levels were short-lived as the unit retreated to lows of 1.3124.
For those who read Thursday’s technical briefing you may recall the following:
H4 structure has November’s opening level in view as possible resistance at 1.3168, which aligns closely with a potential ABCD (black arrows) correction at 1.3175 and a 61.8% Fibonacci retracement ratio at 1.3183.
Higher-timeframe structure also has daily price crossing swords with the 50-day SMA (blue – 1.3153), and weekly movement testing trend line support-turned resistance, extended from the low 1.2061. Note daily price closed Thursday in the shape of a shooting star candlestick pattern (considered a bearish signal).
With weekly price testing trend line resistance, daily price testing its 50-day SMA and H4 price hovering just south of a reasonably attractive resistance zone between 1.3183/1.3168, a sell from this area, should we test the zone, could be something to consider today, targeting 1.31 as the initial take-profit zone.
As evident from the H4 chart this morning, price action tested 1.3183/1.3168 and rotated lower.
Areas of consideration:
Traders short from 1.3183/1.3168 have the option of reducing risk to breakeven at this point, with the 1.31 handle in view as the initial target area. A break of the psychological threshold highlights H4 trend line support as the next port of call.
Well done to any readers who managed to take advantage of the said reversal zone.
USD/CHF:
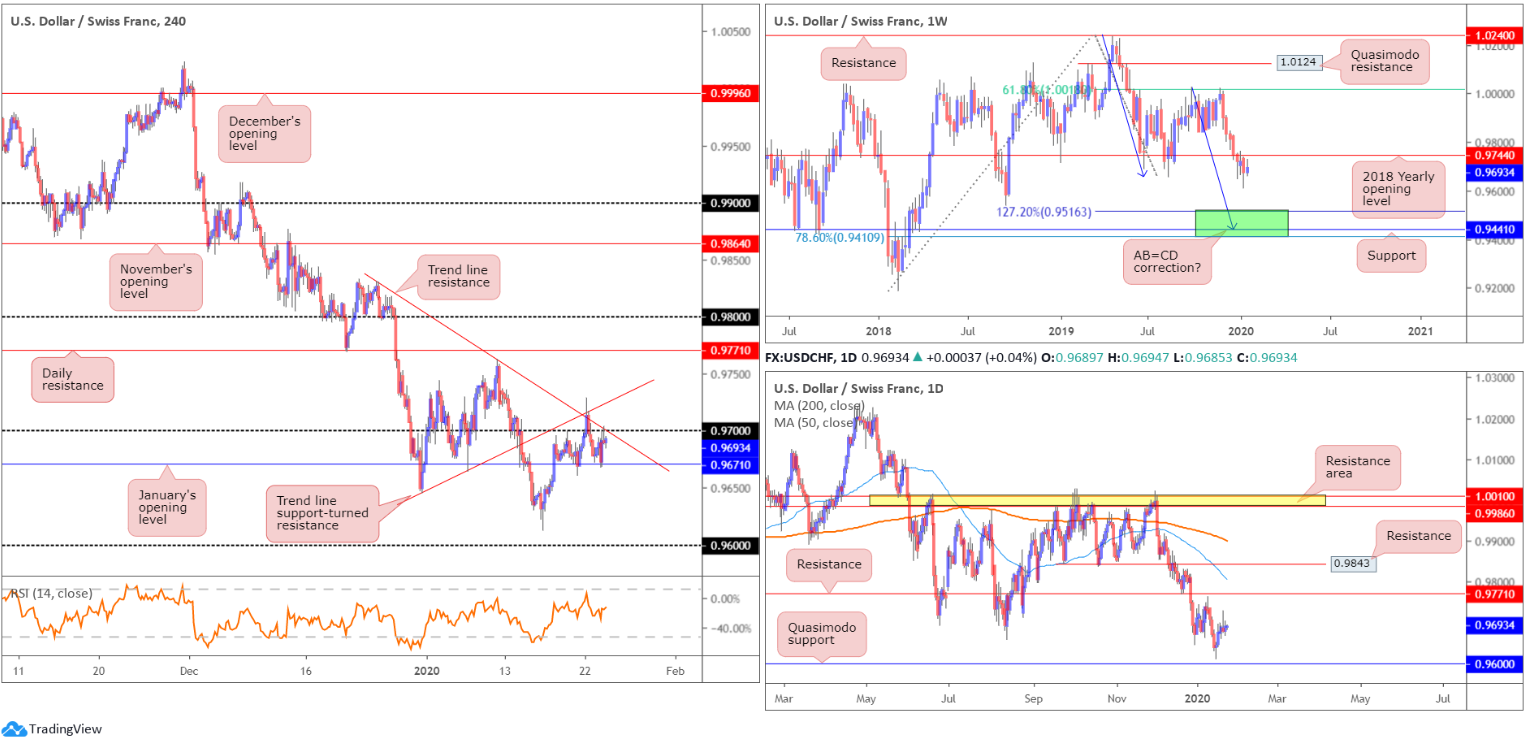
USD/CHF prices concluded unmoved Thursday, confined between 0.97 (which happens to merge with trend line resistance, taken from the high 0.9831) and January’s opening level at 0.9671. Beyond this monthly level, we do not see much stopping the pair from reaching the 0.96 handle, whereas above 0.97 trend line support-turned resistance (0.9646) is in view.
The situation on the weekly timeframe has price trading within the prior week’s range of 0.9736/0.9613, holding south of the 2018 yearly opening level at 0.9744. The next downside target sits in the range of 0.9410/0.9516 (comprised of a 78.6% Fibonacci retracement at 0.9410, support at 0.9441 and a 127.2% AB=CD bullish correction [black arrows] at 0.9516 – green]). The story on the daily timeframe has resistance positioned at 0.9771 and support, shaped in the form of a Quasimodo formation, at 0.9600.
Areas of consideration:
Having seen 0.9671 hold as support recently, interested sellers in this market are likely looking for a H4 close to form beneath this level before committing. A H4 close south of 0.9671, preferably followed up with a retest by way of a H4 bearish candle formation, is likely enough to draw further selling towards the 0.9613 January 16 low, closely shadowed by the 0.96 handle (also represents daily Quasimodo support).
Longs above 0.97 are also an option, though a strong upside limit rests around weekly resistance (the 2018 yearly opening level mentioned above at 0.9744).
Dow Jones Industrial Average:
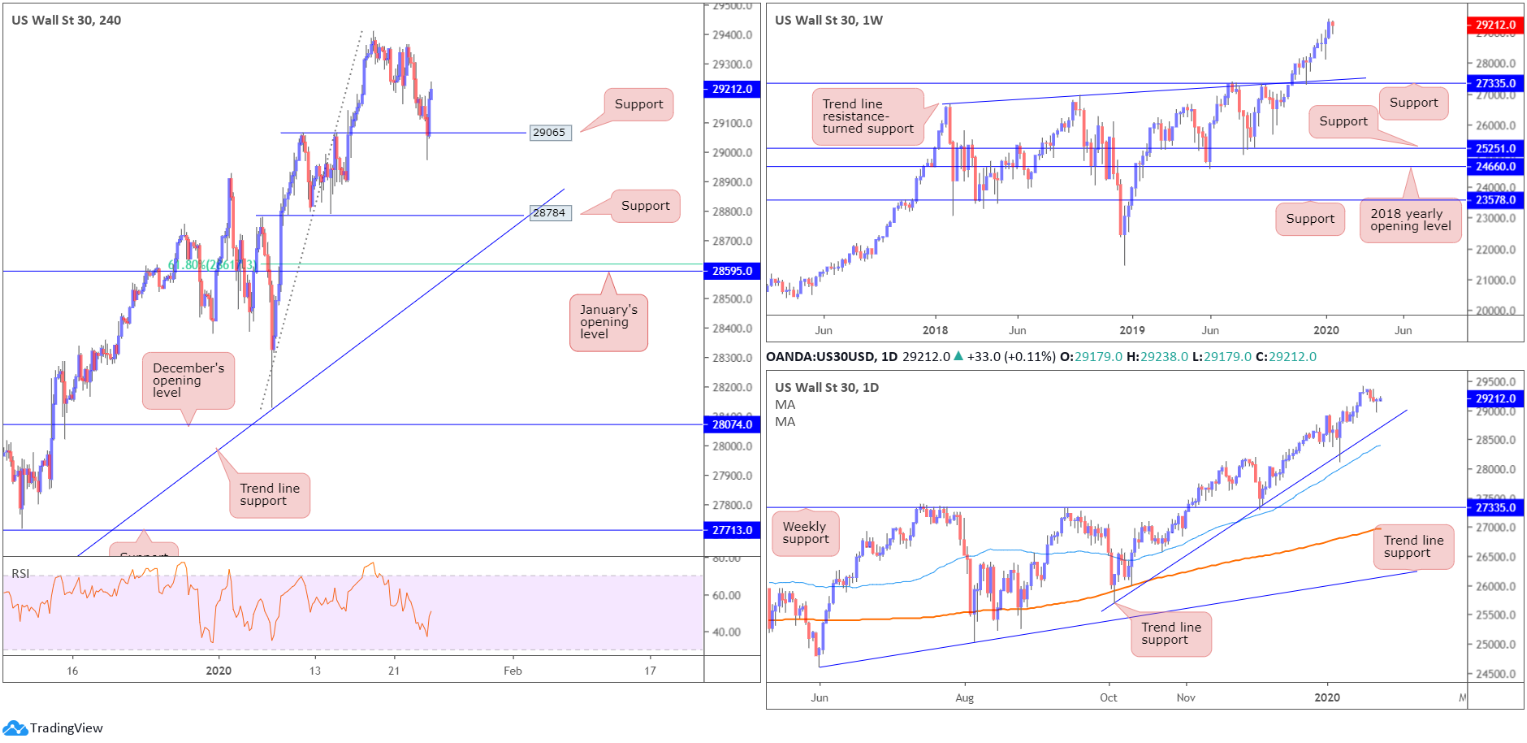
Major US equity benchmarks wrapped up mixed Thursday, recovering earlier losses as the market digested earnings and took stock of the World Health Organisation’s decision to refrain from declaring China’s coronavirus outbreak a Public Health Emergency of International Concern (PHEIC), suggesting it is too early to consider such. The Dow Jones Industrial Average lost 26.18 points, or 0.09%; the S&P 500 added 3.79 points, or 0.11% and the tech-heavy Nasdaq 100 ended higher by 28.41 points, or 0.31%.
Technically, recent action had the H4 candles retest support priced in at 29065. As you can see, price held firm off the level and formed a hammer candlestick signal on the daily timeframe by the close, considered a bullish signal at troughs. Further buying from this point could see all-time highs at 29409.
A look at the higher timeframes and we see little has changed on the weekly timeframe. Since forming a hammer candlestick pattern (considered a buy signal at troughs) at the retest of weekly support drawn from 27335, along with trend line support etched from the high 26670, the index has continued to advance higher since, recently testing fresh record peaks of 29409.
Daily action, aside from yesterday’s hammer candlestick formation, also remains unchanged: trend line support, extended from the low 25710, remains in motion, bolstered by additional support from the 50-day SMA (blue – 28409).
Areas of consideration:
With the primary uptrend remaining strong, daily price trading north of trend line support and recently forming a bullish hammer candlestick pattern, traders on the H4 timeframe will likely enter long at current price, based on the strong H4 bullish candle off support at 29065. As for protective stop-loss orders, beneath yesterday’s low at 28977 is an option, targeting the all-time high 29409 as the initial take-profit zone.
XAU/USD (GOLD):
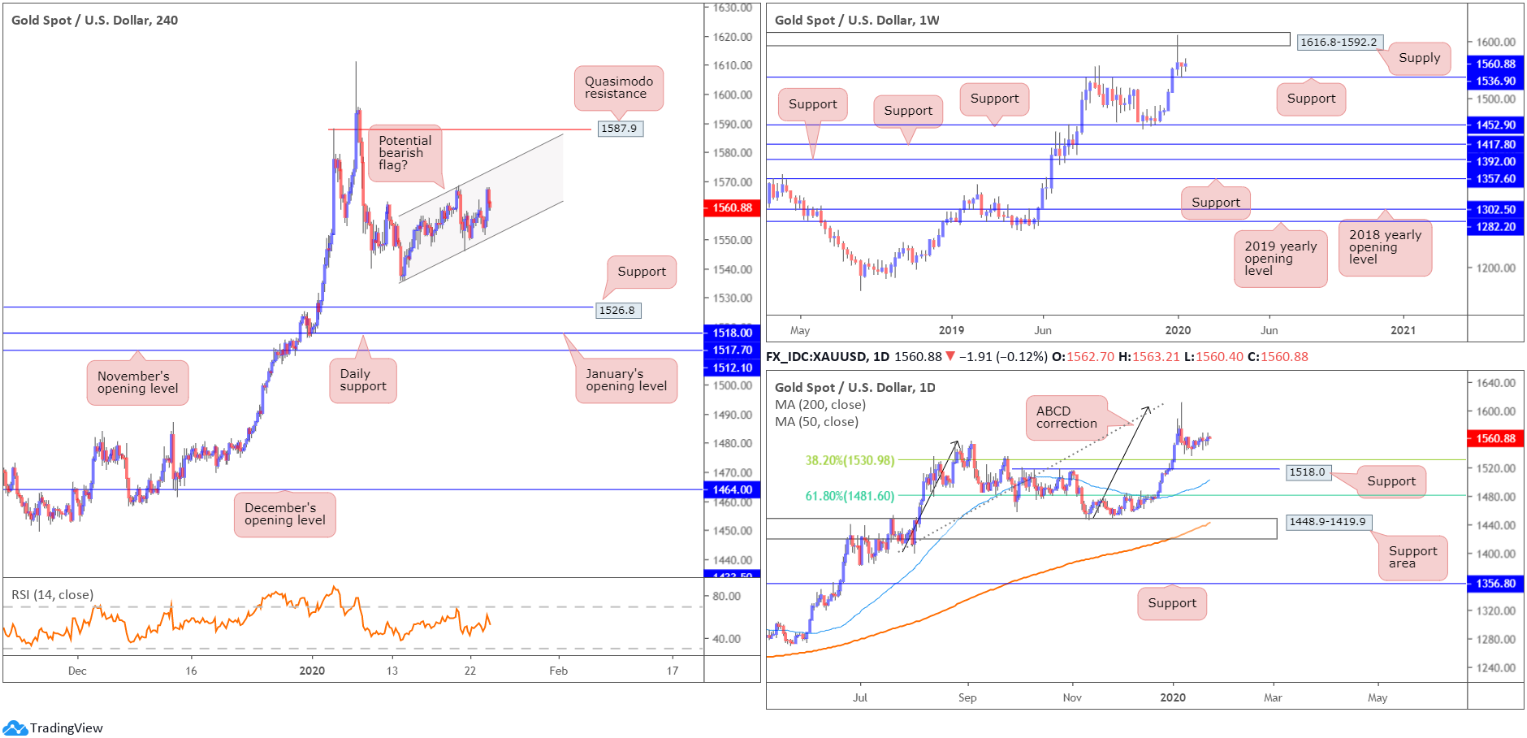
Since bottoming at 1535.7, the H4 candles have been compressing within what appears to be a potential bearish flag, formed following a decline from the 1611.3 January 7 high. A breakout south from here exposes support coming in at 1526.8, sited only a handful of points north of daily support at 1518.0 and January’s opening level at 1517.7. Continued upside, however, has Quasimodo resistance in sight at 1587.9, closely shadowed by the lower edge of weekly supply at 1616.8-1592.2.
Weekly price is seen recovering from support at 1536.9, following a dominant rejection out of the said supply at 1616.8-1592.2. A violation of the said support could prompt selling towards additional layers of support at 1452.9, 1417.8, 1392.0 and 1357.6.
Although we seem to be entering into a bottoming phase on the daily timeframe, it’s still worth bearing in mind the 38.2% Fibonacci retracement at 1530.9 representing support, closely followed by 1518.0. The former offers an initial take-profit target for traders short the ABCD bearish correction (black arrows) at 1608.0.
Areas of consideration:
As of current price, neither a long nor short seems attractive.
An eventual breakout beneath the lower edge of the current H4 flag, while a tempting sell towards H4 support at 1526.8, positioned just south of the 38.2% daily Fibonacci retracement at 1530.9, must contend with possible opposition off the weekly support underlined above at 1536.9. Therefore, waiting for a H4 close beneath the H4 flag as well as a retest, preferably by way of a bearish candlestick signal, may be the better path to take before selling. Waiting for additional candlestick confirmation helps identify seller intent and offers entry and risk levels.
The accuracy, completeness and timeliness of the information contained on this site cannot be guaranteed. IC Markets does not warranty, guarantee or make any representations, or assume any liability regarding financial results based on the use of the information in the site.
News, views, opinions, recommendations and other information obtained from sources outside of www.icmarkets.com.au, used in this site are believed to be reliable, but we cannot guarantee their accuracy or completeness. All such information is subject to change at any time without notice. IC Markets assumes no responsibility for the content of any linked site.
The fact that such links may exist does not indicate approval or endorsement of any material contained on any linked site. IC Markets is not liable for any harm caused by the transmission, through accessing the services or information on this site, of a computer virus, or other computer code or programming device that might be used to access, delete, damage, disable, disrupt or otherwise impede in any manner, the operation of the site or of any user’s software, hardware, data or property.