EUR/USD:
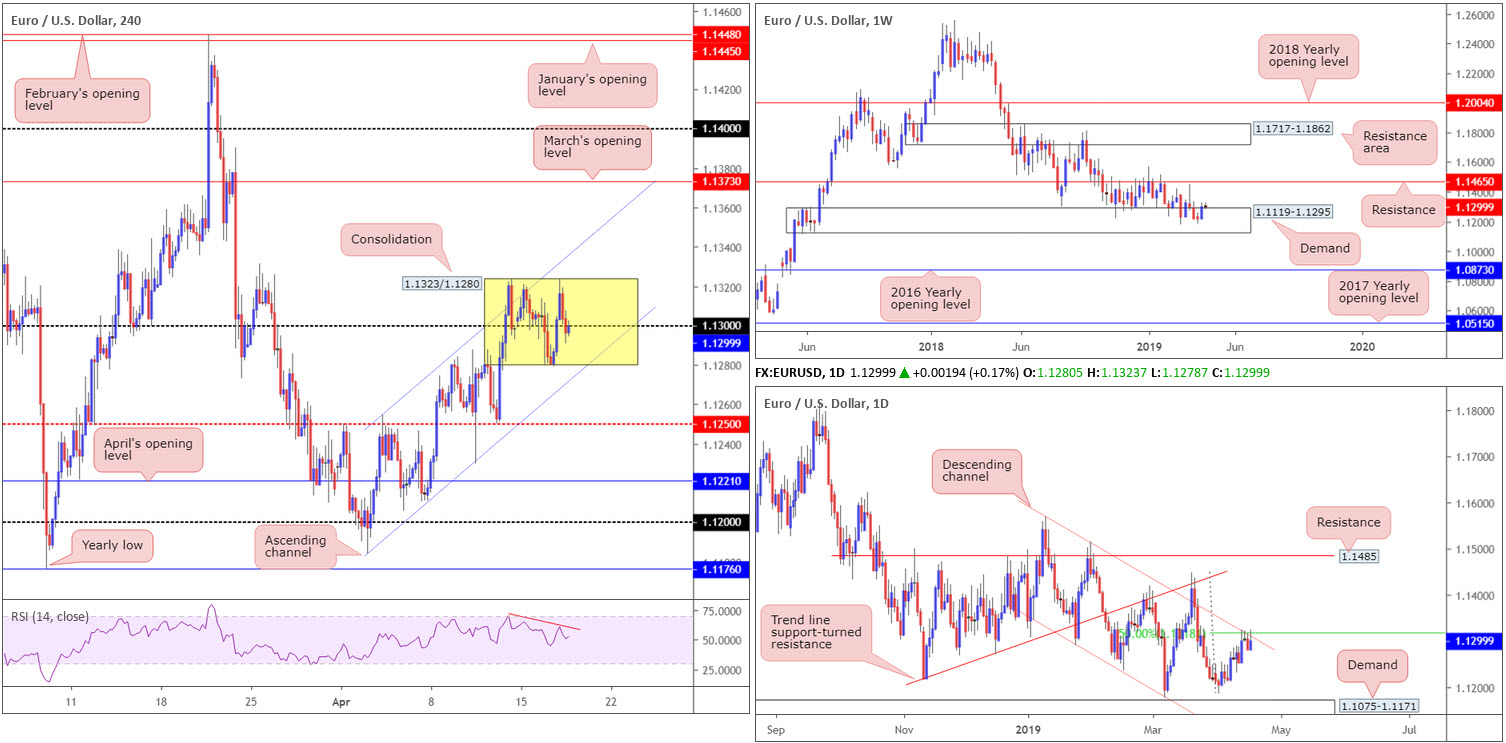
Trading volume remained thin Wednesday as markets begin edging their way into the Easter holiday. As demonstrated on the H4 timeframe, price continues to range, limited by 1.1323/1.1280 (yellow). It might also be worth pencilling in the 1.13 handle housed within the consolidation and the surrounding channel (ascending) formation (1.1183/1.1254). In addition to this, the research team notes the RSI indicator is currently displaying a divergence signal (red line). In terms of the US dollar index, the market concluded Wednesday unchanged, marginally above its 97.00 mark. Traders are reminded the dollar index and the EUR/USD are inversely correlated.
On more of a broader perspective, daily flow on the EUR/USD is challenging channel resistance (taken from the high 1.1569) and a merging 50.0% resistance value at 1.1318. From this point, the 1.1183 Apr 2 low, shadowed closely by demand at 1.1075-1.1171, are in sight as workable supports. Contrary to this, however, weekly price is still seen attempting to recover out of demand at 1.1119-1.1295. Further buying out of this region may eventually call for a test of resistance priced in at 1.1465.
Areas of consideration:
For folks considering a short from the current daily channel resistance could be potentially selling into weekly buyers out of demand. To help overcome this, a H4 close below channel support (1.1183) might be worth waiting for as an act of bearish confirmation.
Longs off the H4 channel support may also be something to consider, given the weekly timeframe’s position. The 1.1250 barrier, sited beneath the channel, is also an option for a buy, in light of its service as support and resistance over the past couple of weeks. Irrespective of the support selected, traders are urged to wait for additional confirmation before pulling the trigger as this is likely to add weight to the trade moving favourably, and will also provide entry/risk levels to work with.
Today’s data points: French Flash Services PMI; French Flash Manufacturing PMI; German Flash Manufacturing PMI; German Flash Services PMI; EUR Flash Manufacturing PMI; EUR Flash Services PMI; US Core Retail Sales m/m; US Retail Sales m/m; Philly Fed Manufacturing Index.
GBP/USD:
Outlook unchanged due to lacklustre movement.
Sterling drifted within a tight range between 1.3067/1.3028 Wednesday amid a lack of Brexit news, which has been the primary driver behind the currency’s movement. Annual CPI out of the UK came in as expected (1.9%) in March and was largely ignored on the charts. In light of this somewhat lacklustre performance, much of the following piece will echo thoughts put forward in yesterday’s briefing.
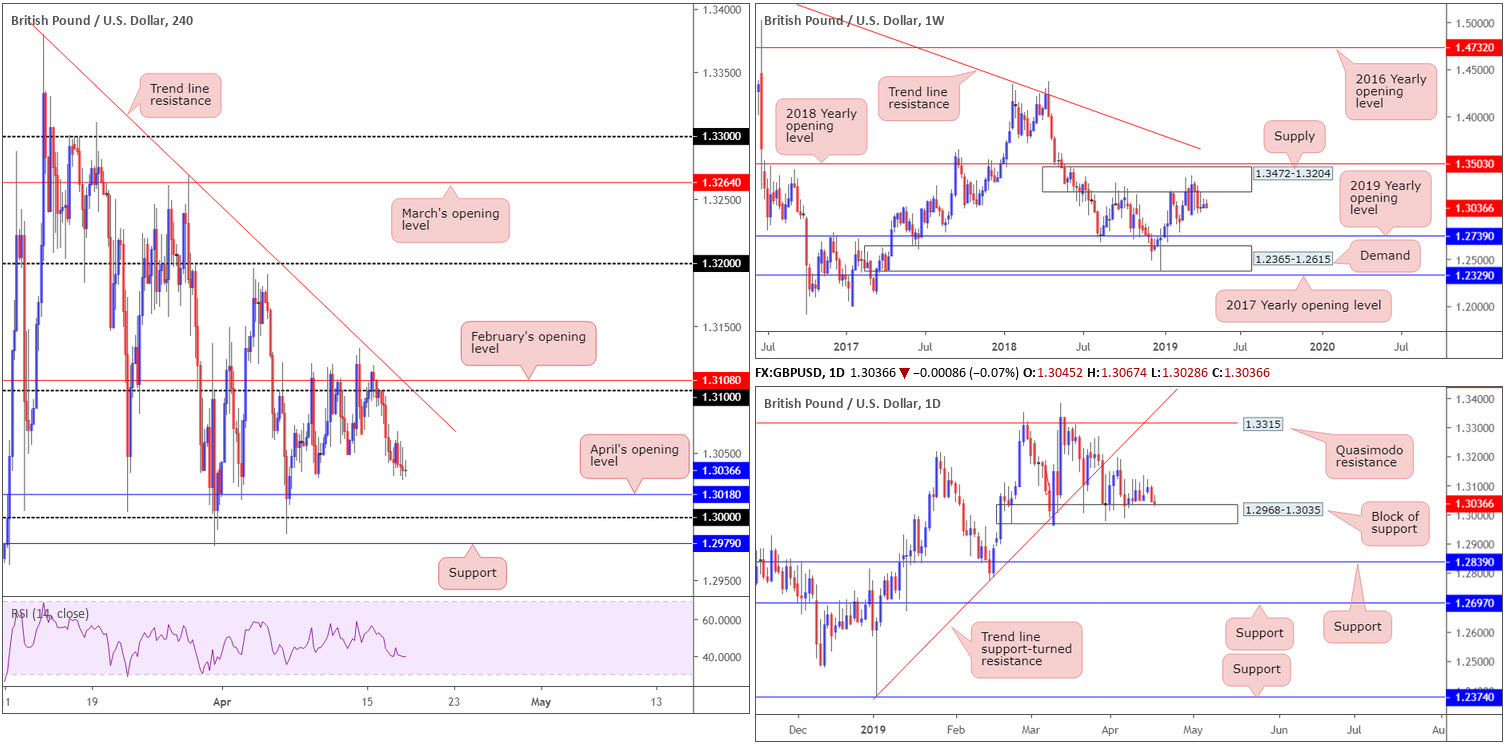
Kicking things off from the top, weekly movement continues to consolidate around the underside of supply at 1.3472-1.3204, situated a few points south of the 2018 yearly opening level at 1.3503. Since the end of February this supply area has been home to many traders. With the next obvious downside target not realised on this timeframe until the 2019 yearly opening level at 1.2739, followed by demand coming in at 1.2365-1.2615, sellers still have plenty of room to manoeuvre if they press lower.
Against the backdrop of weekly flow, daily activity remains teasing a block of support at 1.2968-1.3035. Buying from here is likely to find resistance at a Quasimodo formation drawn from 1.3315 on the daily timeframe, closely followed by a trend line support-turned resistance (extended from the low 1.2373). In the event the current support fails, as weekly structure suggests, support coming in at 1.2839 is in sight, alongside another layer of support at 1.2697 (at this point we’ll be trading below the 2019 yearly opening level on the weekly timeframe).
A closer reading of price action on the H4 timeframe has the unit exploring ground beneath 1.31, targeting April’s opening level at 1.3018, key figure 1.30 and support priced in at 1.2979.
Areas of consideration:
In similar fashion to previous reports, higher-timeframe structure offers an indecisive picture at present, leaving traders with only H4 levels to work with at the moment.
Traders interested in entering long from the 1.30 region bring with them a clear block of daily support mentioned above at 1.2968-1.3035, along with nearby H4 supports highlighted in bold. Although this region is likely to encourage buyers, the main concern is on the weekly timeframe: supply at 1.3472-1.3204. As a result, it may also be worth considering waiting for H4 confirmation to form here before pulling the trigger.
Today’s data points: UK Retail Sales m/m; BoE Credit Conditions Survey; US Core Retail Sales m/m; US Retail Sales m/m; Philly Fed Manufacturing Index.
AUD/USD:
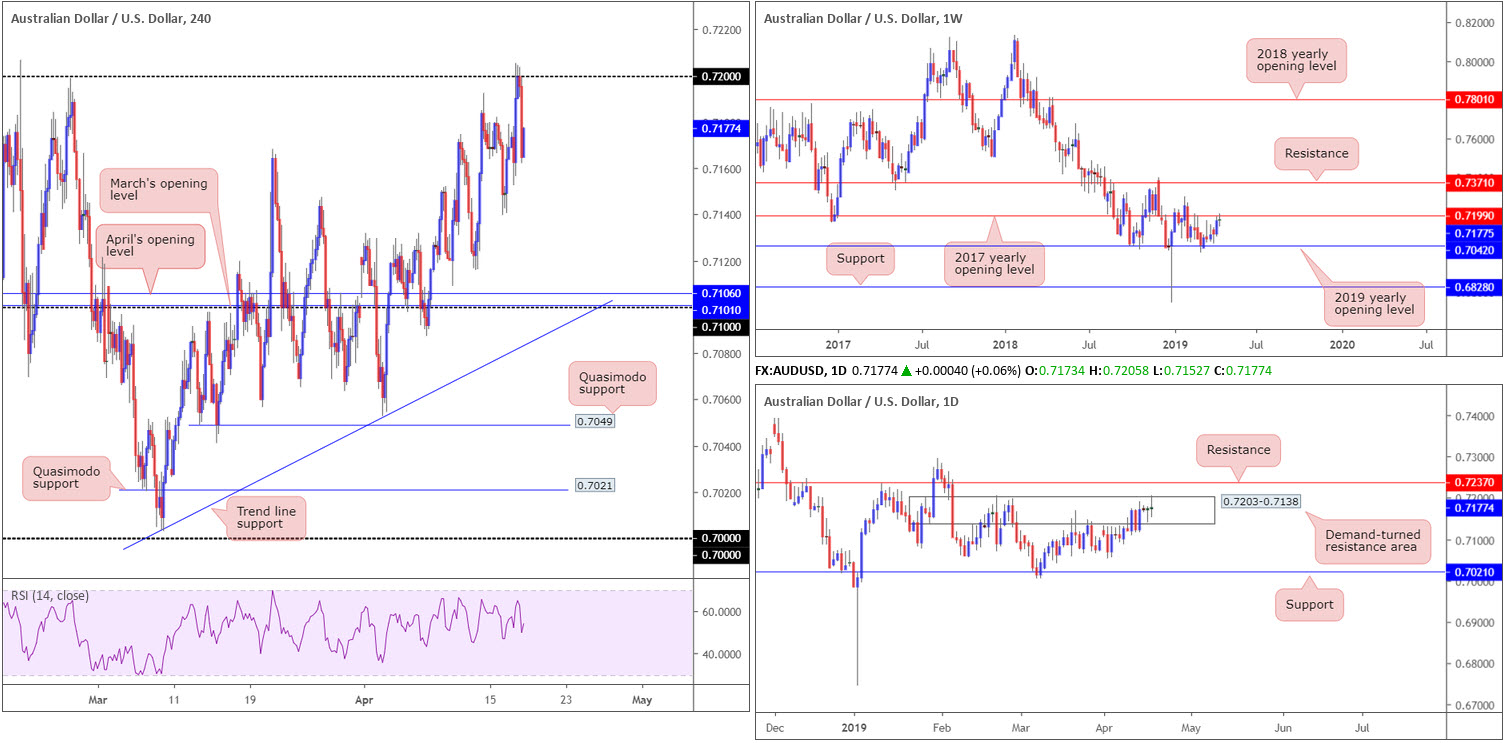
Stoking risk appetite, better-than-expected China trade data provided fresh impetus to the AUD/USD market in the early hours of Asia Wednesday, clocking highs of 0.7205, levels not seen since February. Despite a number of attempts to overthrow 0.72 to the upside, the bulls surrendered going into US trade, dropping to a session low of 0.7162.
For folks who read Wednesday’s report you may recall the piece highlighted 0.72 as a potential sell zone. The research team favoured this psychological number due to its connection with the 2017 yearly opening level parked on the weekly timeframe at 0.7199, and also owing to the level being sited within the upper limit of a daily demand-turned resistance area at 0.7203-0.7138. Well done to any of our readers who caught this move. The ultimate downside target from 0.72 falls in around 0.71 (note April and March’s opening levels here at 0.7106/0.7101), but do bear in mind the unit could, in theory, reach as far south as 0.7042: the 2019 yearly opening level on the weekly timeframe (the next downside target on this scale).
Areas of consideration:
As long as 0.72 holds ground, traders are urged to consider shorts until the unit reaches at least 0.71ish. A sell could be found on the lower timeframes using local structure, such as a support-turned resistance level. An alternative to this is to wait and see if the H4 candles retest 0.72 and form a bearish candlestick configuration (entry/risk levels can be determined according to this structure).
Today’s data points: Australian Employment Change; Australian Unemployment Rate; US Core Retail Sales m/m; US Retail Sales m/m; Philly Fed Manufacturing Index.
USD/JPY:
Outlook unchanged due to lacklustre movement.
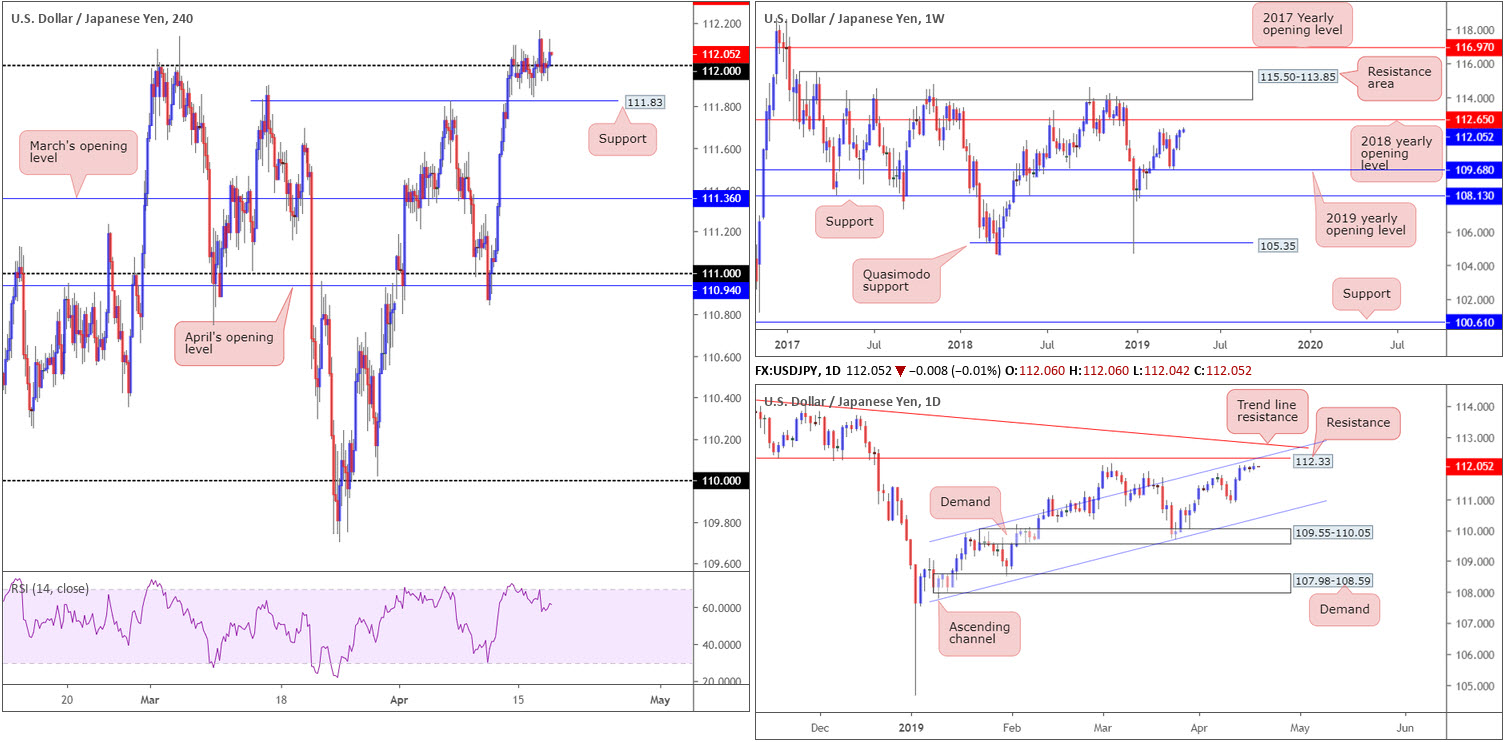
Since the beginning of the week, the USD/JPY has struggled to find bearing, narrowly flipping between gains/losses around 112 on the H4 timeframe. As highlighted in previous reports, support remains situated nearby at 111.83: a Quasimodo resistance-turned support, whereas to the upside, traders’ crosshairs are likely fixed on daily resistance coming in at 112.33 (not visible on the H4 timeframe).
Crossing over to daily structure, the research team notes the 112.33 resistance level also fuses with a channel resistance (drawn from the high 109.88), and is closely positioned nearby a trend line resistance (etched from the high 114.54). Structure on the weekly timeframe has the candles facing the March 4 high at 112.13, shadowed closely by the 2018 yearly opening level priced in at 112.65.
Areas of consideration:
Daily resistance at 112.33 appears a prime location for shorts in this market, according to our technical reading, with stop-loss orders plotted beyond the daily trend line resistance highlighted above. The only caveat to this, aside from a reasonably strong trending market at the moment, is weekly price threatening to press as far north as 112.65. For that reason, before pulling the trigger to sell from 112.33, traders are recommended to wait for additional confirmation. This could be anything from a moving average crossover, a H4 bearish candlestick signal or even drilling down to the lower timeframes and trading local structure.
Today’s data points: US Core Retail Sales m/m; US Retail Sales m/m; Philly Fed Manufacturing Index.
USD/CAD:
Outlook unchanged due to lacklustre movement.
Statistics Canada announced the consumer price index (CPI) rose 1.9% on a year-over-year basis in March, up from a 1.5% increase in February. In addition to this, Canada’s imports declined 1.6% in February, led by lower imports of gold. Exports were down 1.3% on lower exports of non-energy products. As a result, Canada’s merchandise trade deficit with the world narrowed slightly, from $3.1 billion in January to $2.9 billion in February.
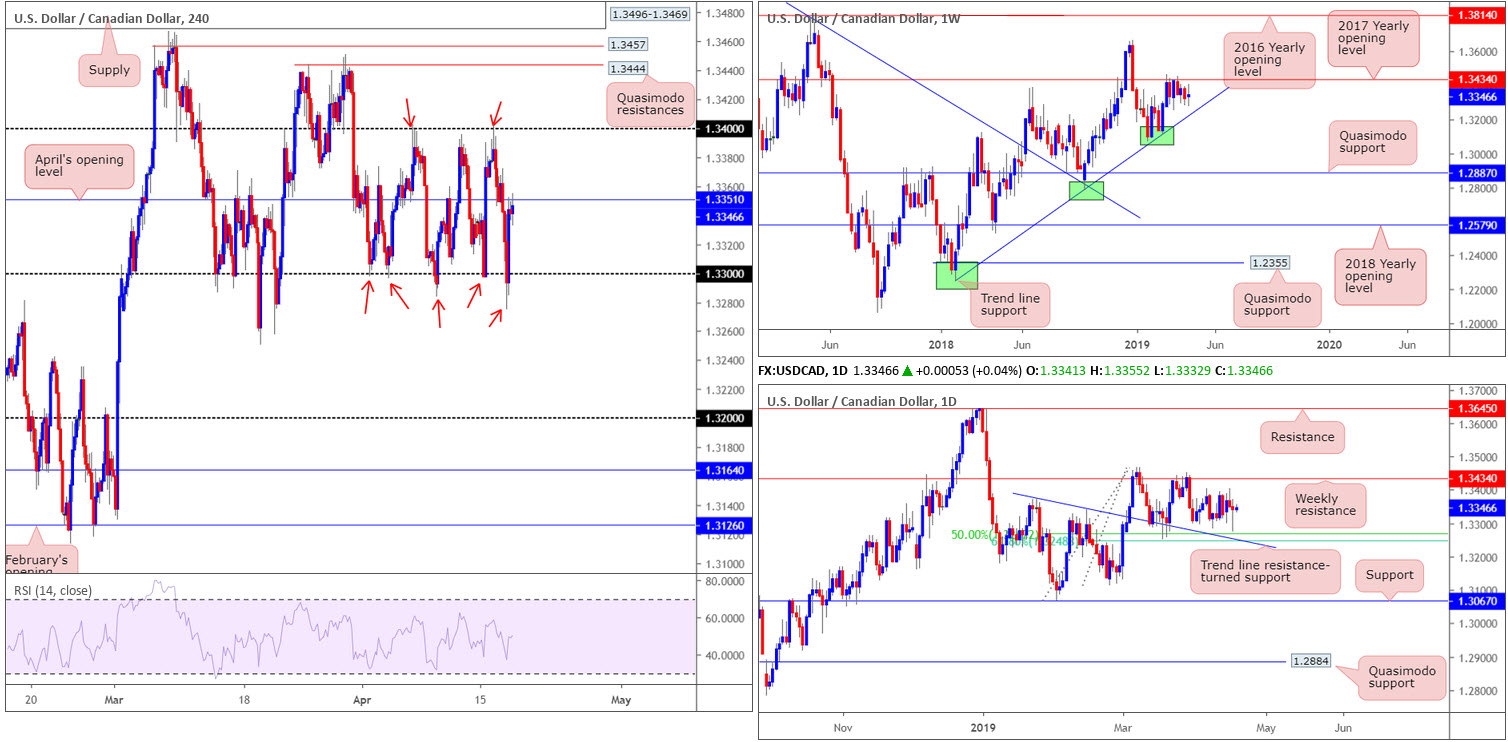
The aftermath of the said reports sent the USD/CAD lower Wednesday, consequently tripping stops beneath 1.33. The move, though, was a short-lived one as traders swiftly pulled the H4 candles back above 1.33 and reconnected with the underside of April’s opening level at 1.3351. In spite of this movement, it’s painfully obvious to any technician the H4 timeframe remains entrenched within a consolidation between 1.34 and 1.33 at the moment (red arrows).
Against the backdrop of medium-term flows, daily action’s focus has shifted to weekly resistance at 1.3434: the 2017 yearly opening level. In the event we turn lower from current price, nonetheless, a 50.0% support is seen at 1.3267. Note this barrier also happens to merge closely with a 61.8% Fibonacci support at 1.3248 and a trend line resistance-turned support (extended from the high 1.3375). It might also be worth noting a weekly trend line support (etched from the low 1.2247) merges with the aforementioned daily supports.
Areas of consideration:
Trading the outer limits of the H4 range and targeting the opposing edge remains an option going forward. The problem, though, is the threat of price action printing a fakeout beyond these range extremes to either weekly resistance at 1.3434 or 1.3267: the daily 50.0% support. Therefore, it might be worth waiting and seeing if H4 action chalks up a notable candlestick signal before pulling the trigger. Not only will this help avoid being taken out on a fakeout, it’d provide strict entry and risk levels.
Today’s data points: US Core Retail Sales m/m; US Retail Sales m/m; Philly Fed Manufacturing Index; Canadian Core Retail Sales m/m; Canadian Retail Sales m/m.
USD/CHF:
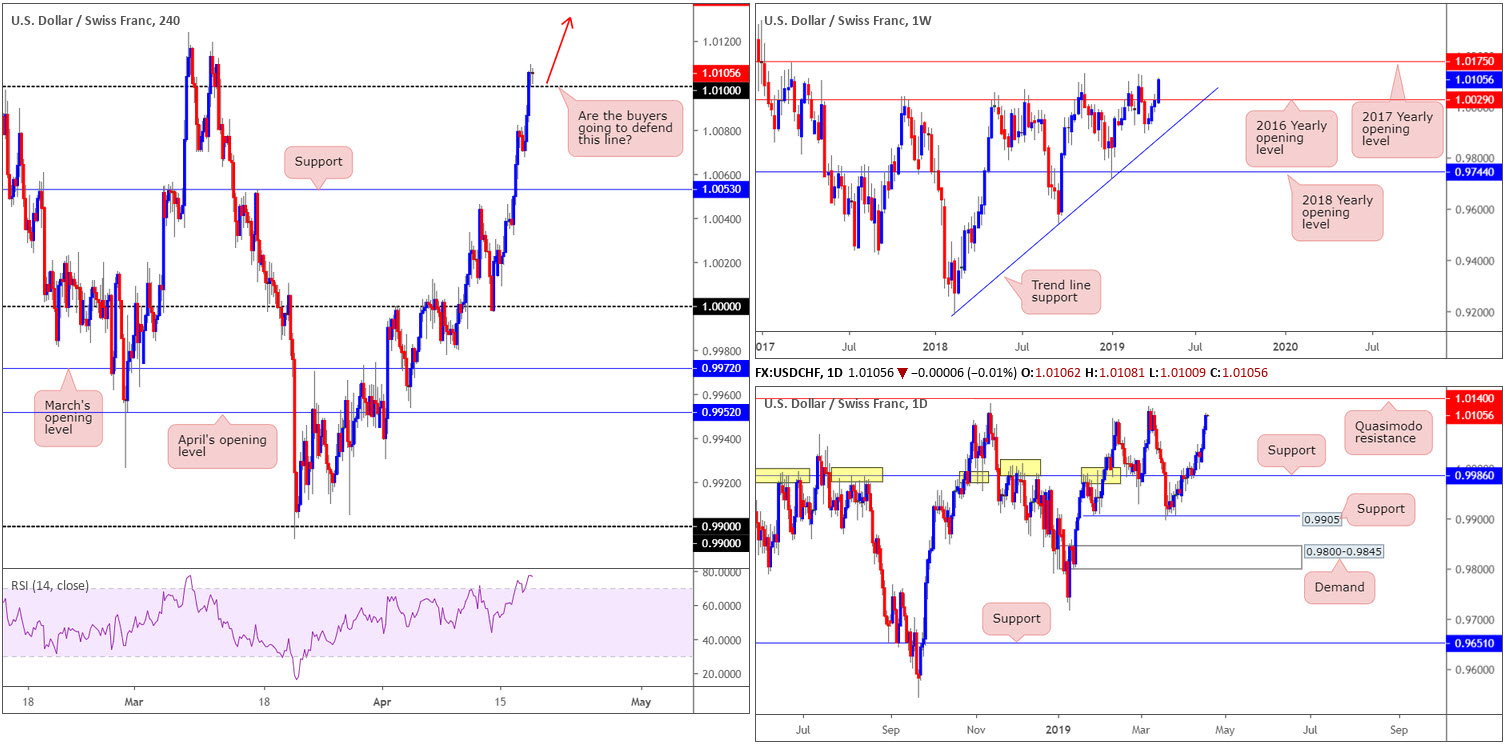
Starved of resistance, the USD/CHF toppled 1.01 to the upside Wednesday, subsequently cataloguing its third consecutive daily gain. With 1.01 reflecting possible support on the H4 timeframe, the next port of call in terms of resistance, aside from the 1.0124 March 7 high, can be found at a daily Quasimodo resistance drawn from 1.0140 (not visible on the H4 screen). It might also interest some traders to note the H4 RSI indicator is exhibiting a robust overbought reading.
The market’s setting on the weekly timeframe has the unit trading beyond its 2016 yearly opening level at 1.0029, with the prospect of further extension towards the 2017 yearly opening level at 1.0175. Although this may come across as bullish, the pair has already crossed above 1.0029 on two separate occasions in the past and each time finished lower.
Areas of consideration:
On account of the above, the 1.01 level is likely to offer the market support today should it be retested. A retest in the shape of a H1 or H4 bullish candlestick signal – think Hammer/Pin-bar formation or Engulfing pattern – is, according to the overall picture, likely enough to encourage buyers into the market, targeting 1.0124, followed by 1.0140.
Today’s data points: US Core Retail Sales m/m; US Retail Sales m/m; Philly Fed Manufacturing Index.
Dow Jones Industrial Average:
Outlook unchanged due to lacklustre movement.
US equities concluded a choppy session marginally lower Wednesday, as traders digested stronger-than-expected economic data out of China and the latest batch of earnings results. By and large, the technical landscape remains unaffected on the Dow Jones Industrial Average.
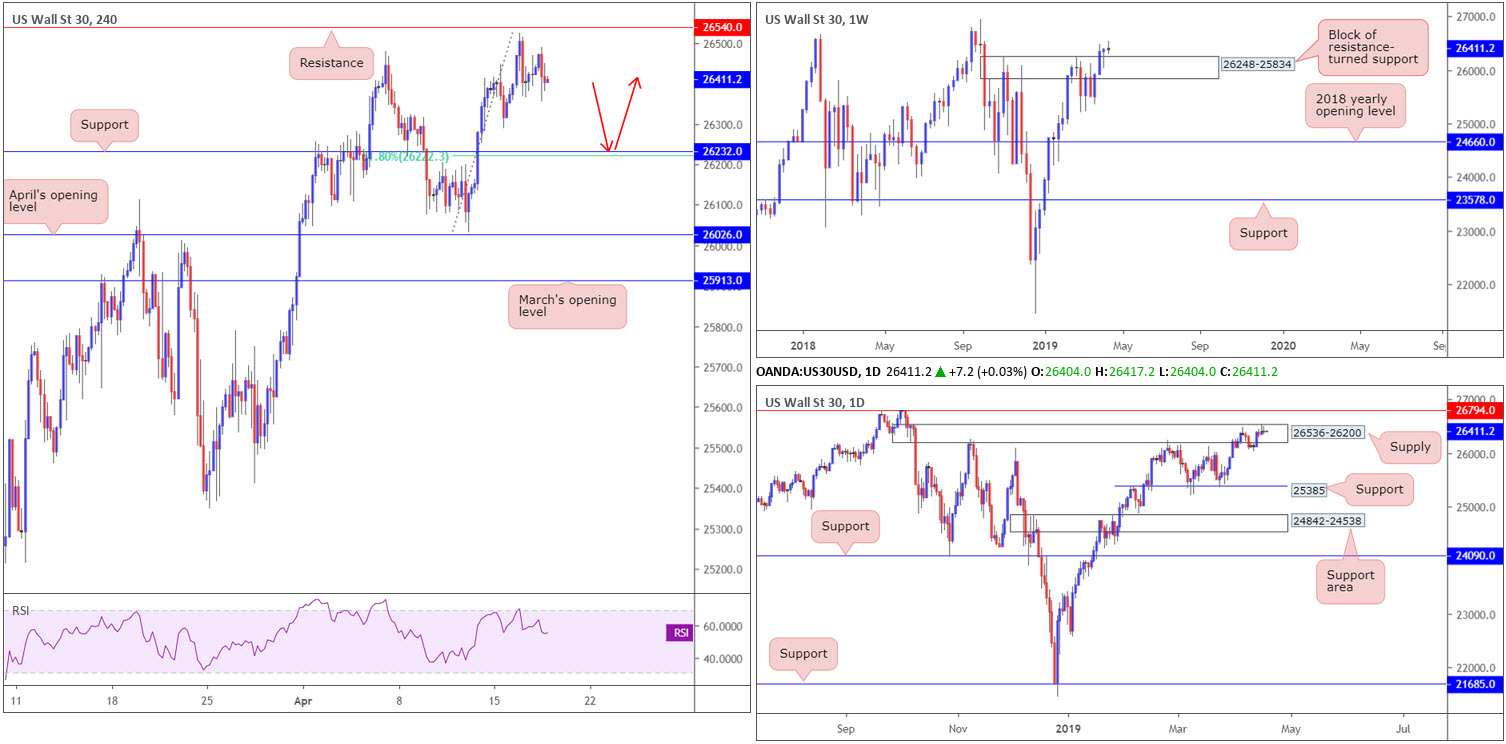
As highlighted in Tuesday’s report, the market failed to challenge H4 resistance at 26540 in recent trading, and spent Wednesday’s segment flipping between gains and losses within a reasonably tight range. With a fresh higher peak formed (breaking the 26478 April 19 high) at 26525 and the said resistance unopposed, H4 support plotted at 26232 and merging H4 61.8% Fibonacci support at 26222 provides a solid floor to consider buying from in the event we pullback this far today.
A retest of 26232 is further supported on the weekly timeframe, which, as you can see, recently produced a firm bullish pin-bar formation out of a resistance-turned support area at 26248-25834. Daily flow, on the other hand, positions the unit within the walls of supply drawn from 26536-26200 that’s sited just south of a Quasimodo resistance at 26794.
Areas of consideration:
Should H4 action drop lower to challenge support at 26232 (and the closely positioned 61.8% Fibonacci support at 26222) in the shape of a bullish candlestick signal (either H1 or H4 – entry and risk levels can be determined according to the candlestick’s structure), a long could be a consideration. In terms of take-profit targets, it’s a little too early to decide as the approach to the buy zone has yet to be completed.
Today’s data points: US Core Retail Sales m/m; US Retail Sales m/m; Philly Fed Manufacturing Index.
XAU/USD (GOLD):
Outlook unchanged due to lacklustre movement.
Having observed healthy data surface out of China Wednesday, risk appetite increased and therefore limited demand for traditional safe-haven markets, such as gold.
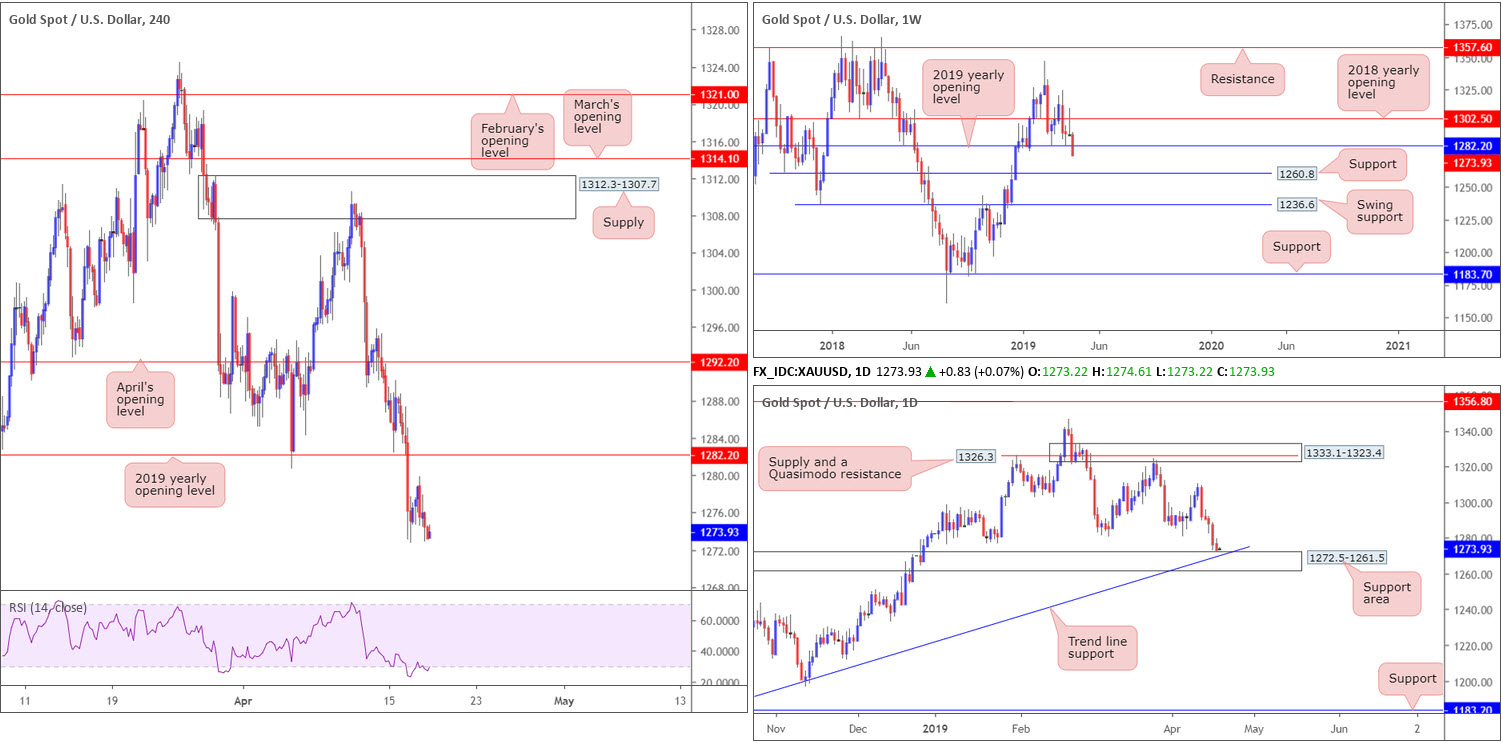
Spot gold, in $ terms, remains nursing losses around the 2019 lows at 1273.0. From a technical standpoint, H4 action suggests further downside could be in store, with the next support target not recognised until reaching 1260.8: a Quasimodo resistance-turned support (not seen on the screen).
While weekly flow supports further selling – the current weekly candle is testing waters beneath its 2019 yearly opening level at 1282.2 – daily structure shows a support area in sight at 1272.5-1261.5, which happens to merge with a trend line support (etched from the low 1160.3). Given its confluence, this base is likely to hold active buyers within.
Areas of consideration:
Ultimately, buying this market, particularly after viewing weekly price conquering 1282.2, is precarious at current prices. A better route, according to the charts, would likely be for daily price to test its support area at 1272.5-1261.5 and produce a H4 bullish candlestick formation (entry and risk levels can be drawn from this structure).
The accuracy, completeness and timeliness of the information contained on this site cannot be guaranteed. IC Markets does not warranty, guarantee or make any representations, or assume any liability with regard to financial results based on the use of the information in the site.
News, views, opinions, recommendations and other information obtained from sources outside of www.icmarkets.com.au, used in this site are believed to be reliable, but we cannot guarantee their accuracy or completeness. All such information is subject to change at any time without notice. IC Markets assumes no responsibility for the content of any linked site. The fact that such links may exist does not indicate approval or endorsement of any material contained on any linked site.
IC Markets is not liable for any harm caused by the transmission, through accessing the services or information on this site, of a computer virus, or other computer code or programming device that might be used to access, delete, damage, disable, disrupt or otherwise impede in any manner, the operation of the site or of any user’s software, hardware, data or property.