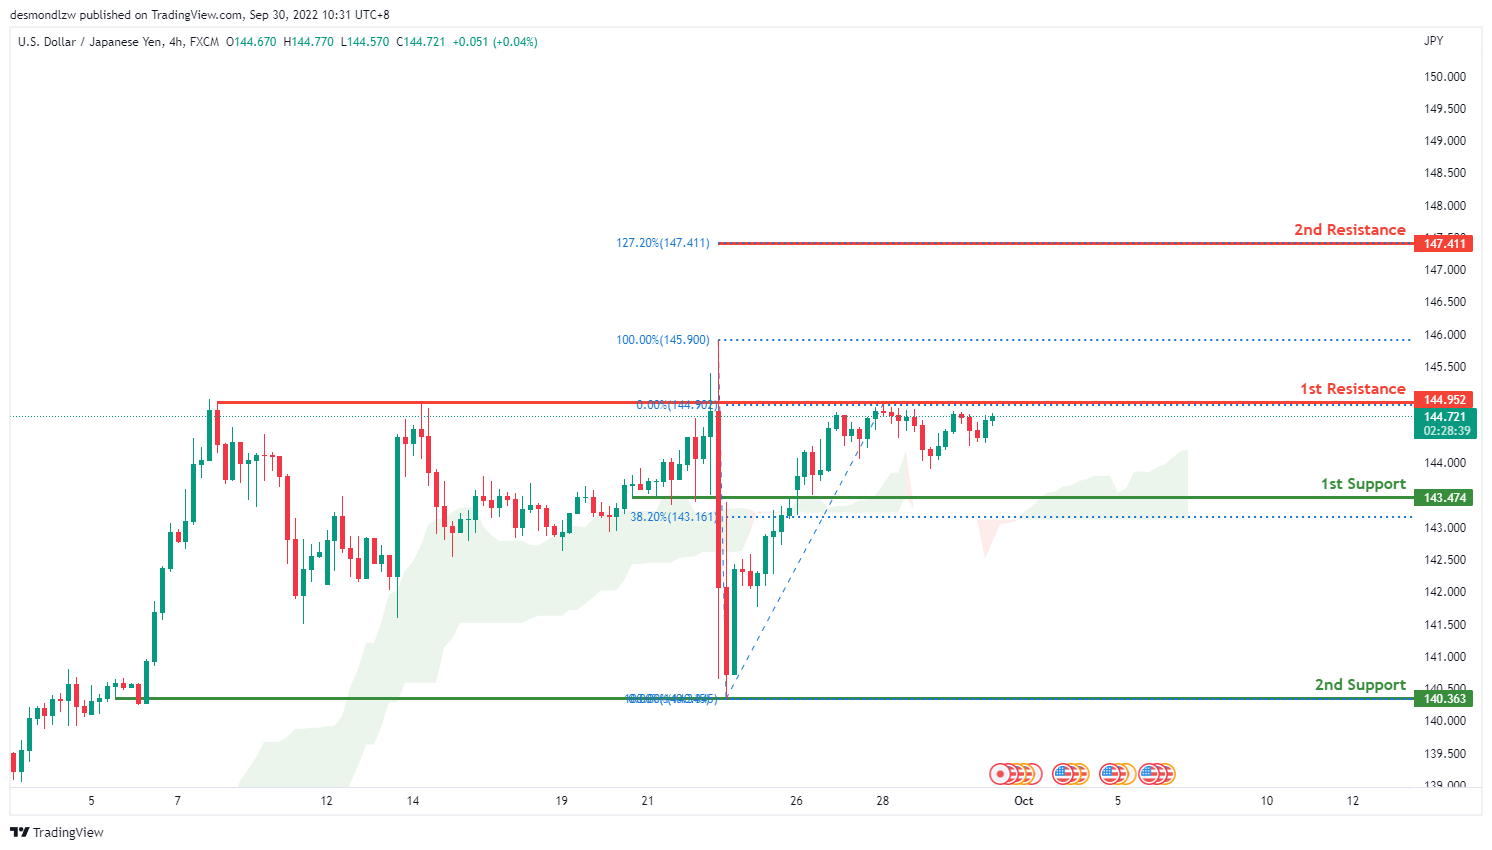
USD/JPY:
On the H4 chart, price has broken through the first support level at 143.474, where the 38.2% Fibonacci line is located. Price is currently consolidating near 144.952, the 0% Fibonacci line. Expect price to reflect back down from the first resistance level and towards the first support level. Price could also break through the first resistance and head towards the second resistance at 147.411 where the 127.2% Fibonacci expansion extension line is.
Areas of consideration:
- H4 time frame, 1st resistance at 144.952
- H4 time frame, 1st support at 143.474
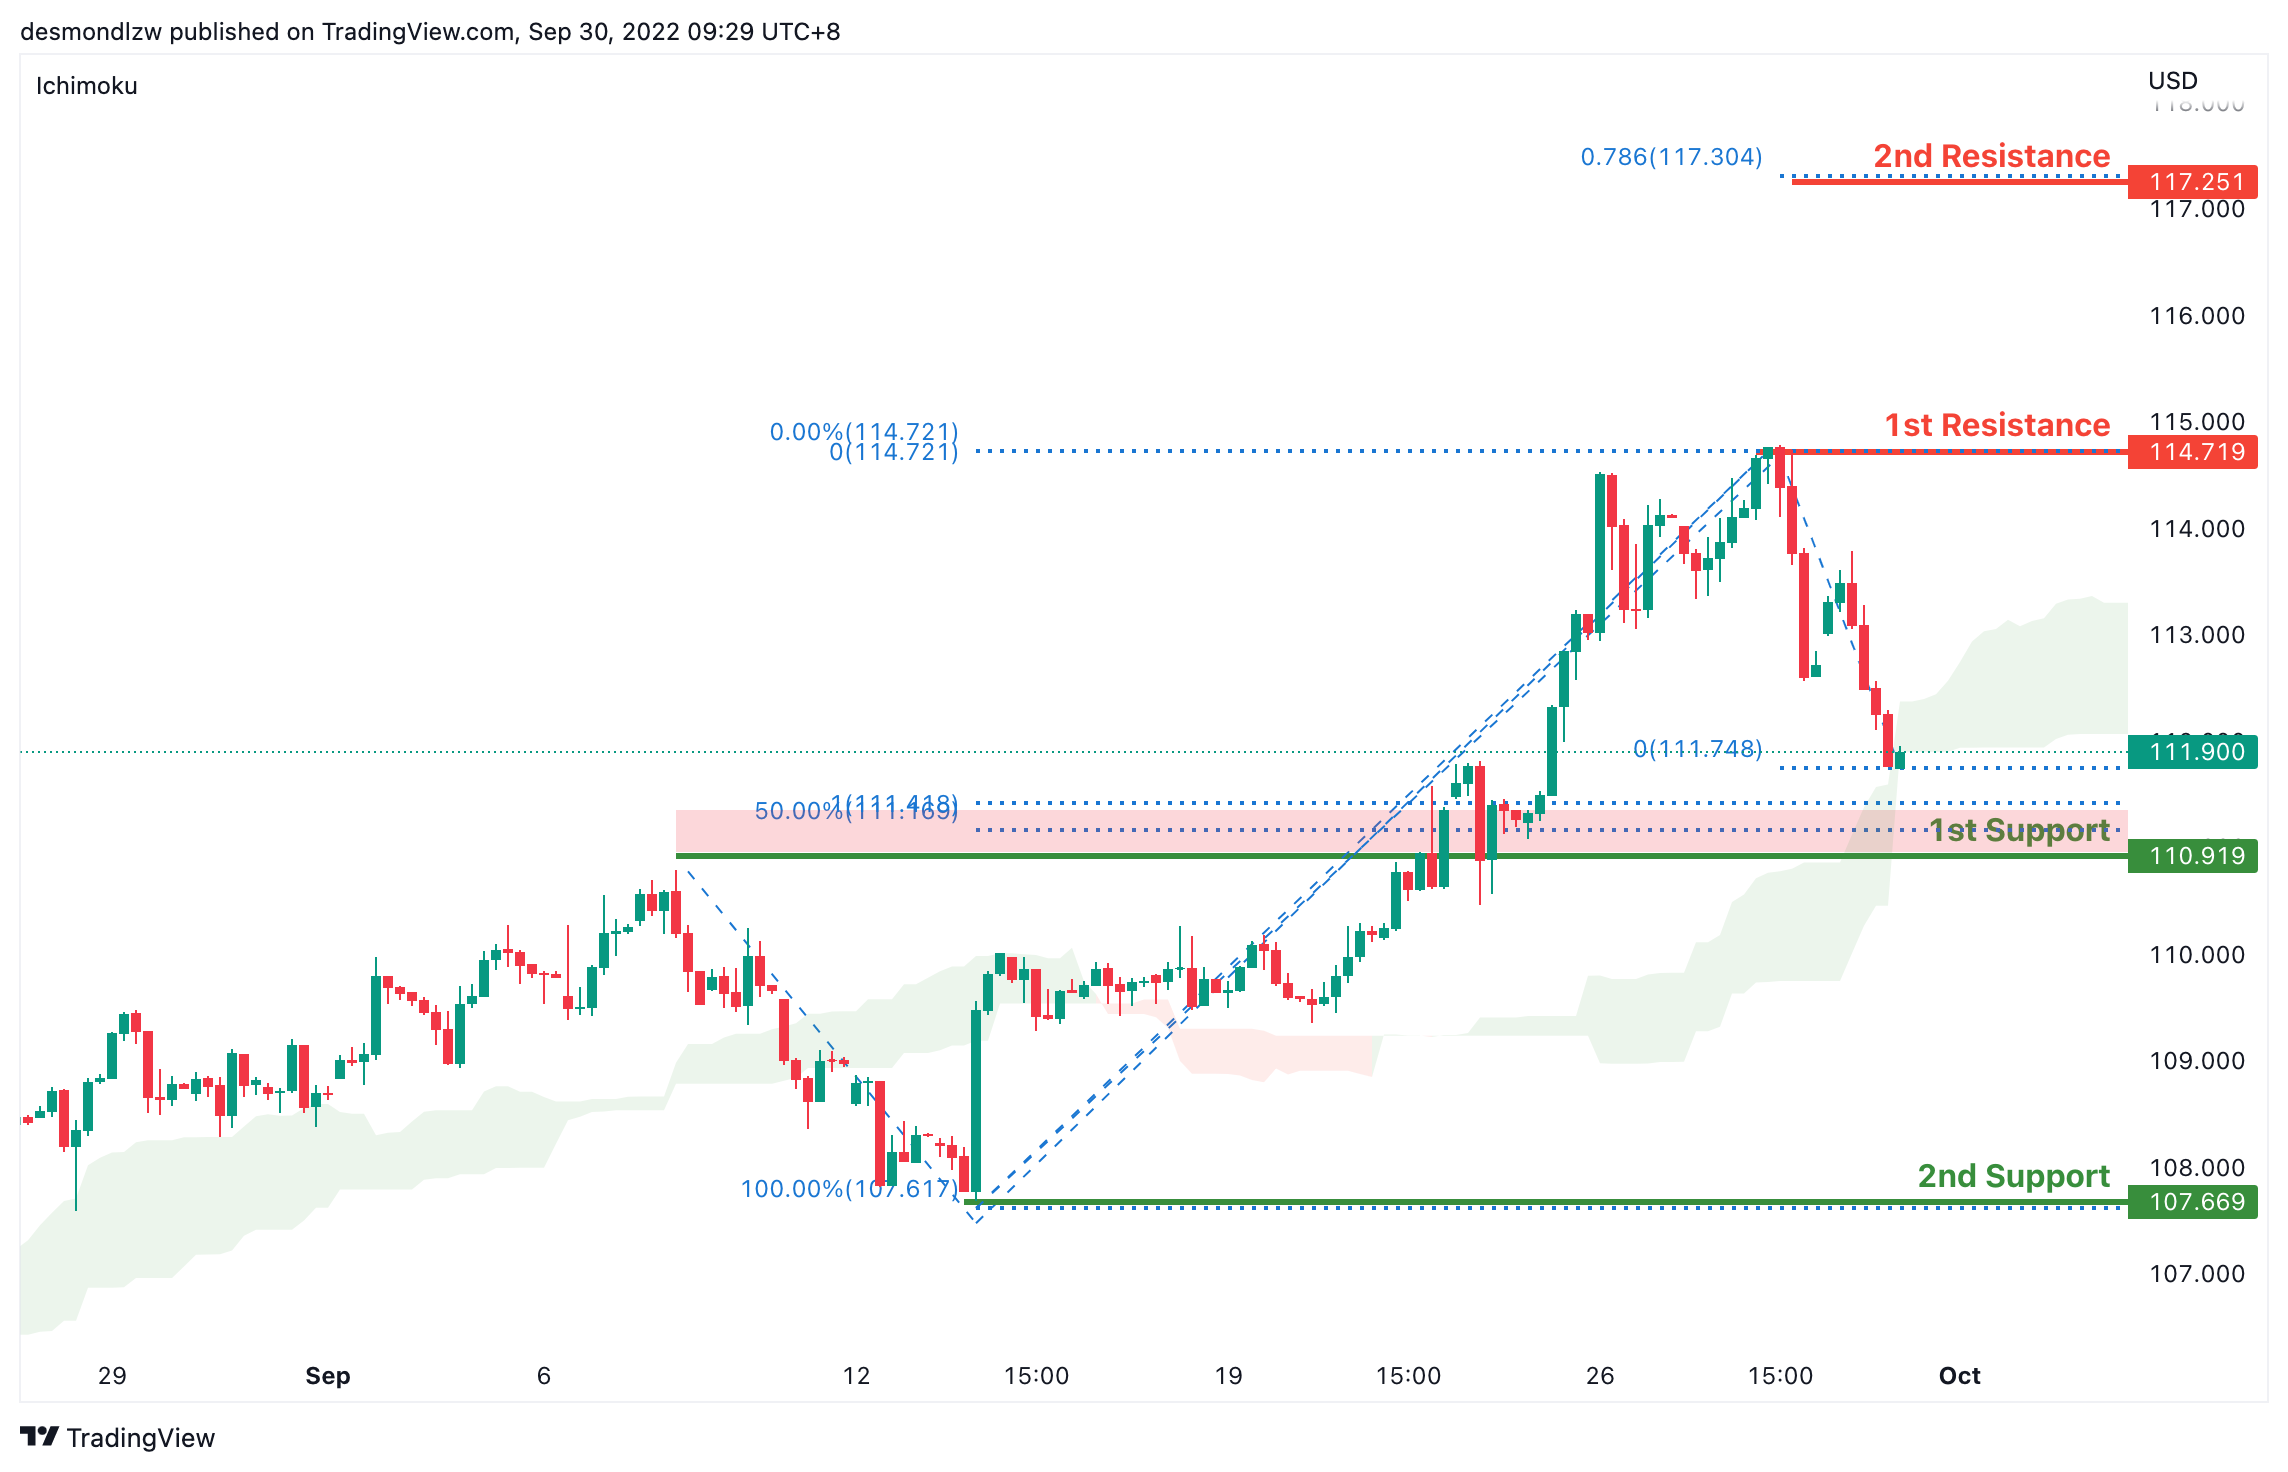
DXY:
On the H4, price has broken the ichimoku and has pulled back slightly forming a double top- we are bearish bias. Price has rejected the first resistance and pulled back to test the first support at 110.919 where the 50% retracement and 100% projection sits. If price breaks this support it should test the second support at 107.669 where the previous swing low sits. Alternatively price could test the first resistance again at 114.719 levels where the previous swing high sits and if it breaks this level, price might test the second resistance at 116.507 where the 78.6% projection sits.
Areas of consideration:
- H4 time frame, 1st resistance at 114.719
- H4 time frame, 1st support at 110.919
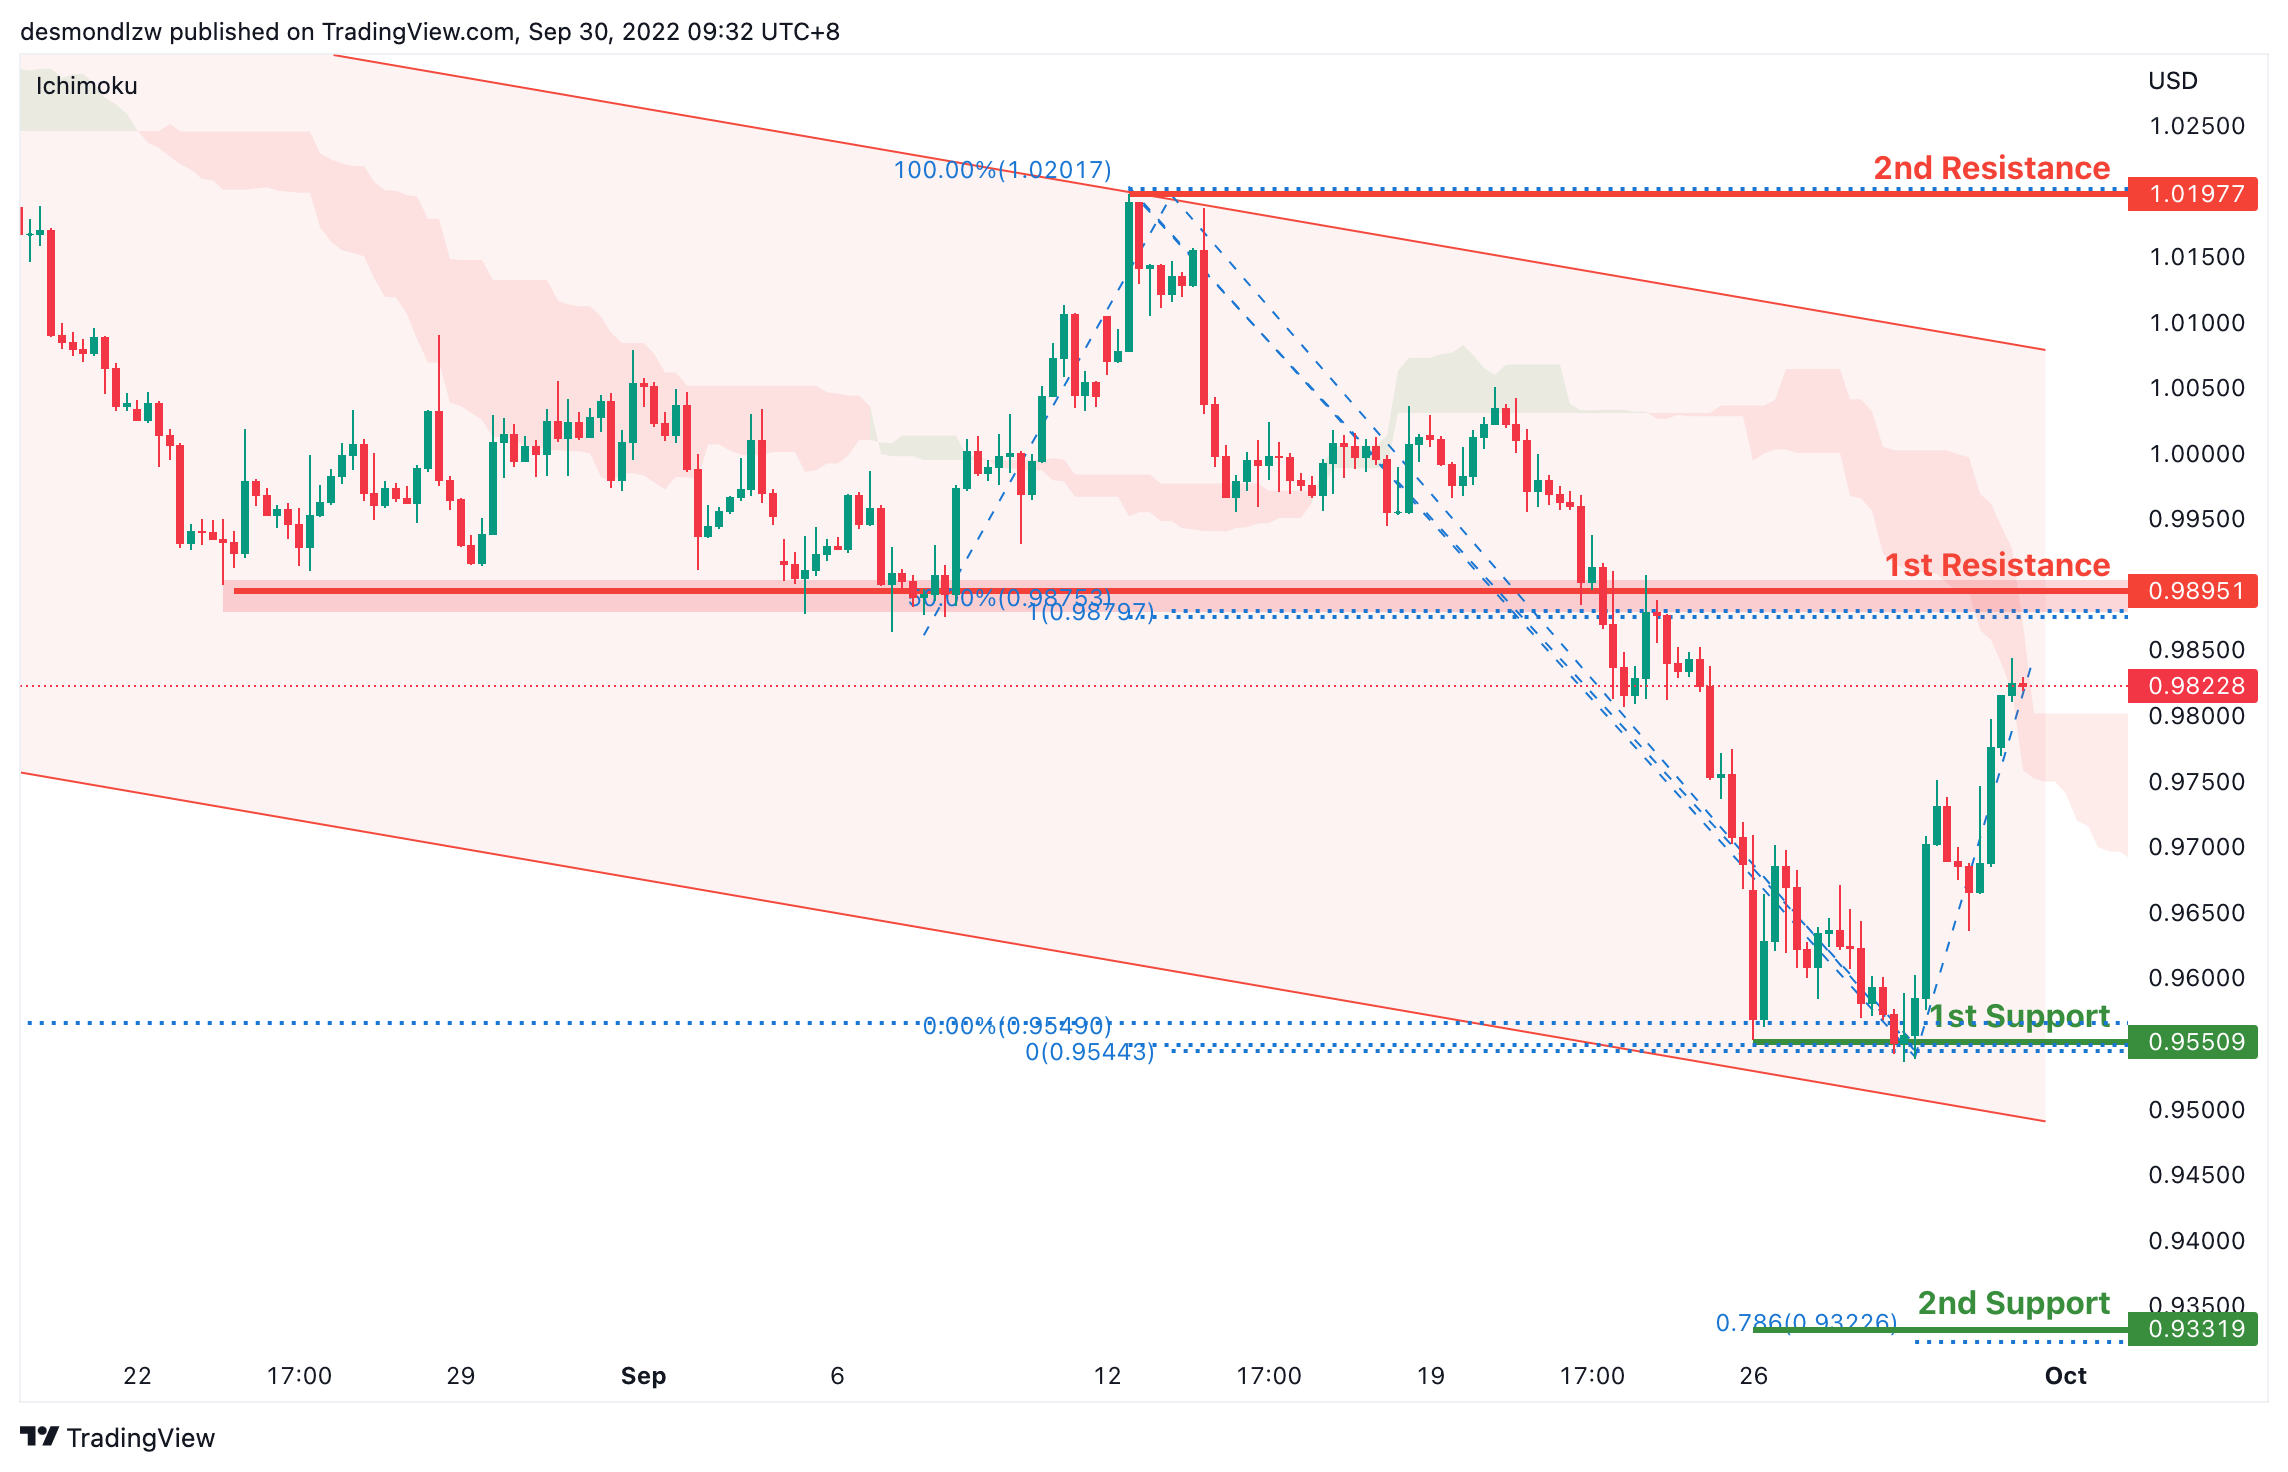
EUR/USD:
On the H4, price is moving within the channel but in an ascending manner- we are slightly bullish biased. Price has bounced off the first support and is moving toward the first resistance at 0.9895 where the 100% projection and 50% retracement sits. If price breaks this level, it will test the second resistance at 1.0197 where the previous swing high sits. Alternatively, the overall bearish momentum should bring price back to test the first support at 0.9550 where the previous swing low and 161.8% extension sits. If it breaks this level, we have a strong bearish confirmation to bring price down to 0.9331 where the 78.6% projection sits
Areas of consideration :
- H4 1st resistance at 0.9895
- H4 1st support at 0.9550
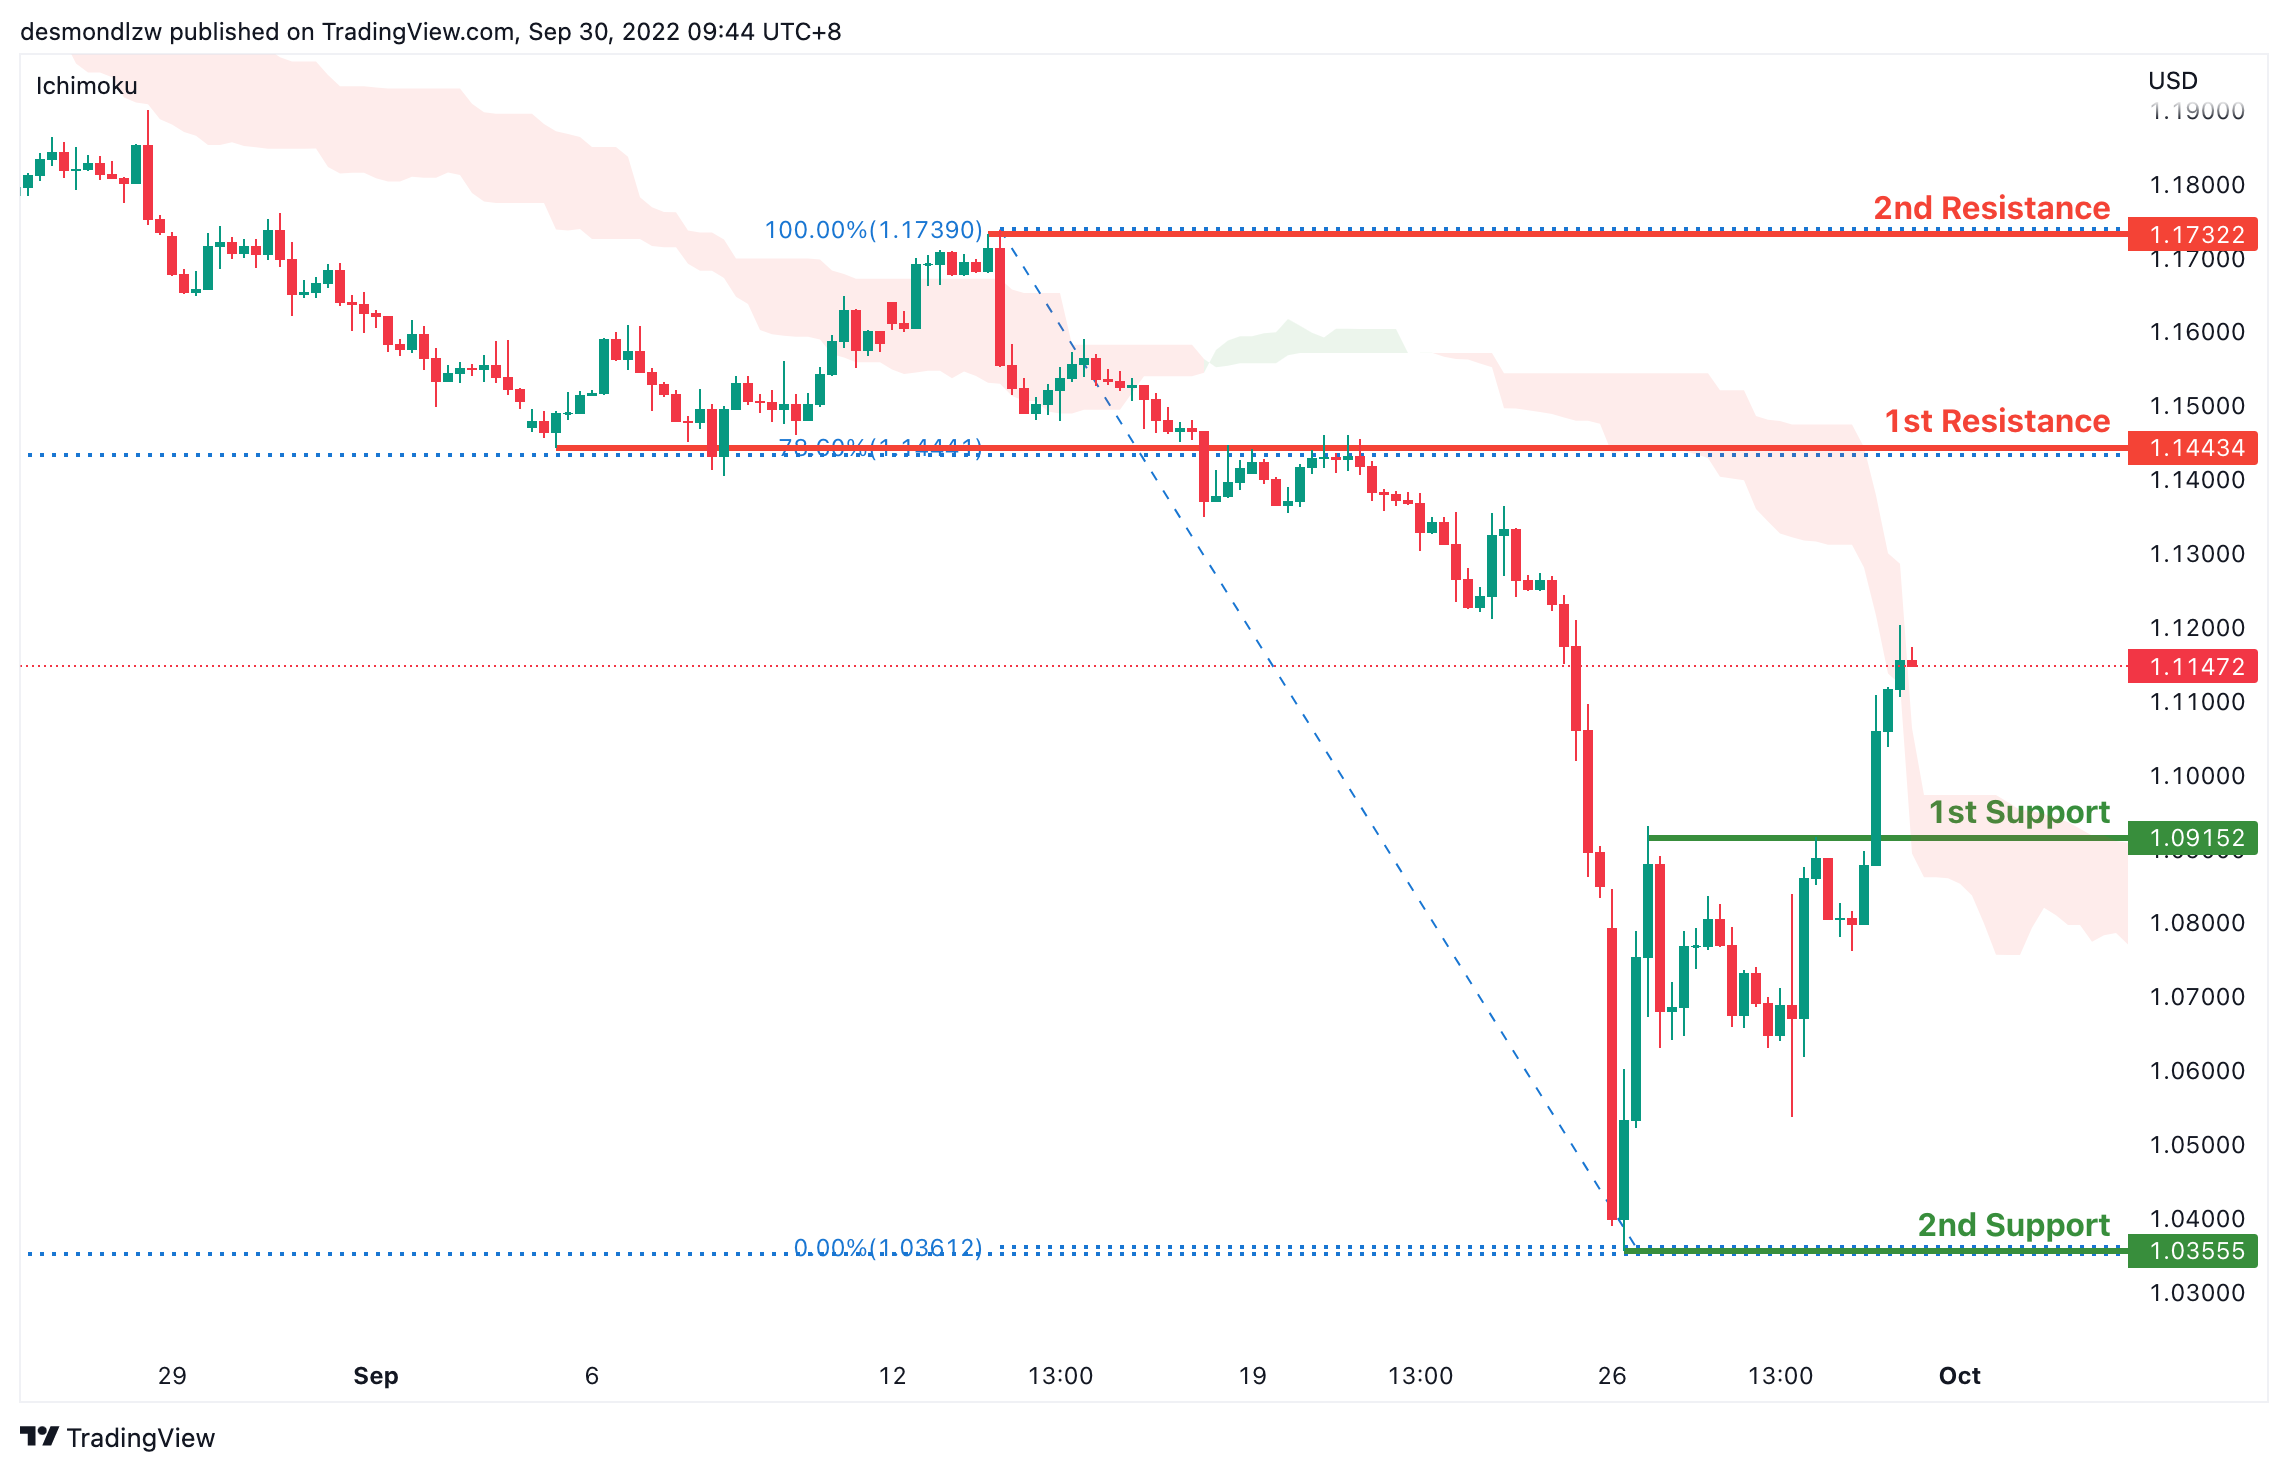
GBP/USD:
On the H4 time frame, prices have bounced off the support level and are moving in an ascending manner, we are slightly bullish. Price is moving toward the first resistance at 1.1443 where the 78.6% retracement and overlap support sits. If it breaks this level, its bullish momentum will bring price to second resistance at 1.7322 where the previous swing high sits. Alternatively, price could pull back to test the first support at 1.0915 where the 38.2% retracement sits then the second resistance at 1.0355 where the previous swing low and 138.2% extension sits
Areas of consideration:
- H4 1st resistance at 1.1443
- H4 1st support at 1.0915
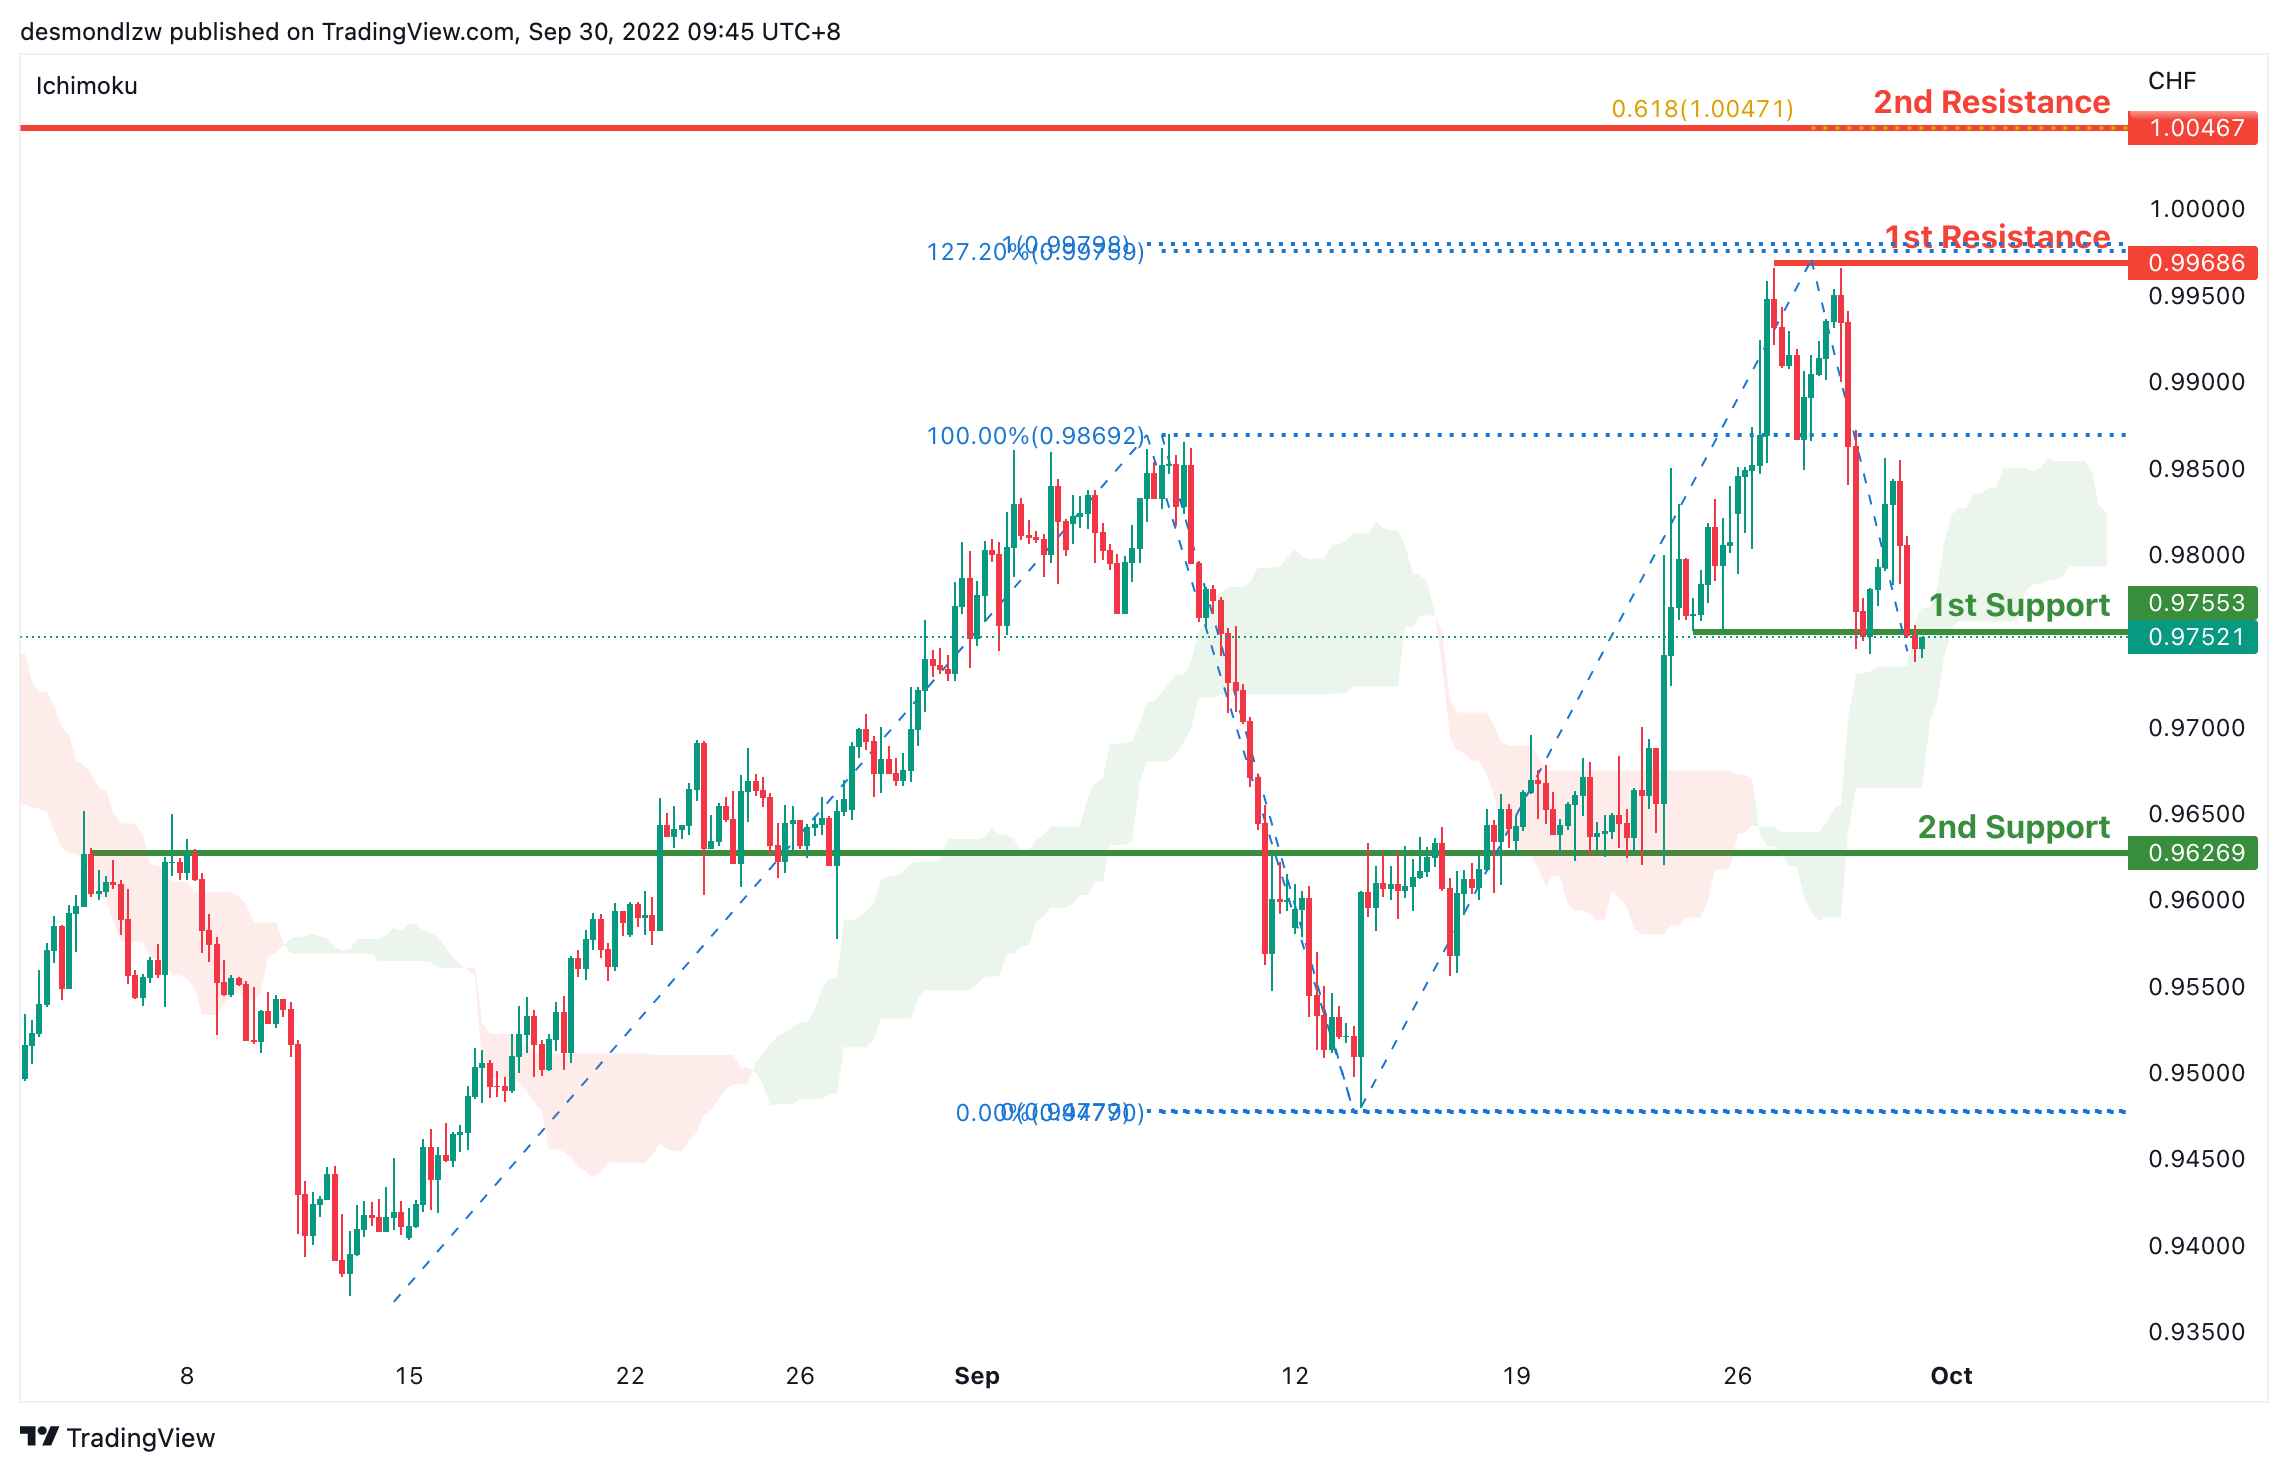
USD/CHF:
On the H4, prices have broken the ichimoku and in a descending manner hence we are bearish biased. Price is testing at the first support of 0.9755, if it breaks this level, we have a bearish confirmation to bring price further down to the second support at 0.9626 where the key overlap support sits. Alternatively, price could pull back to test the first resistance at 0.9968 where the 100% projection,127.2% extension and swing high sits. If bullish momentum continues, it should bring price to the second resistance at 1.0046 where the 61.8% projection and previous swing high sits.
Areas of consideration
- H4 1st support at 0.9755
- H4 1st resistance at 0.9968
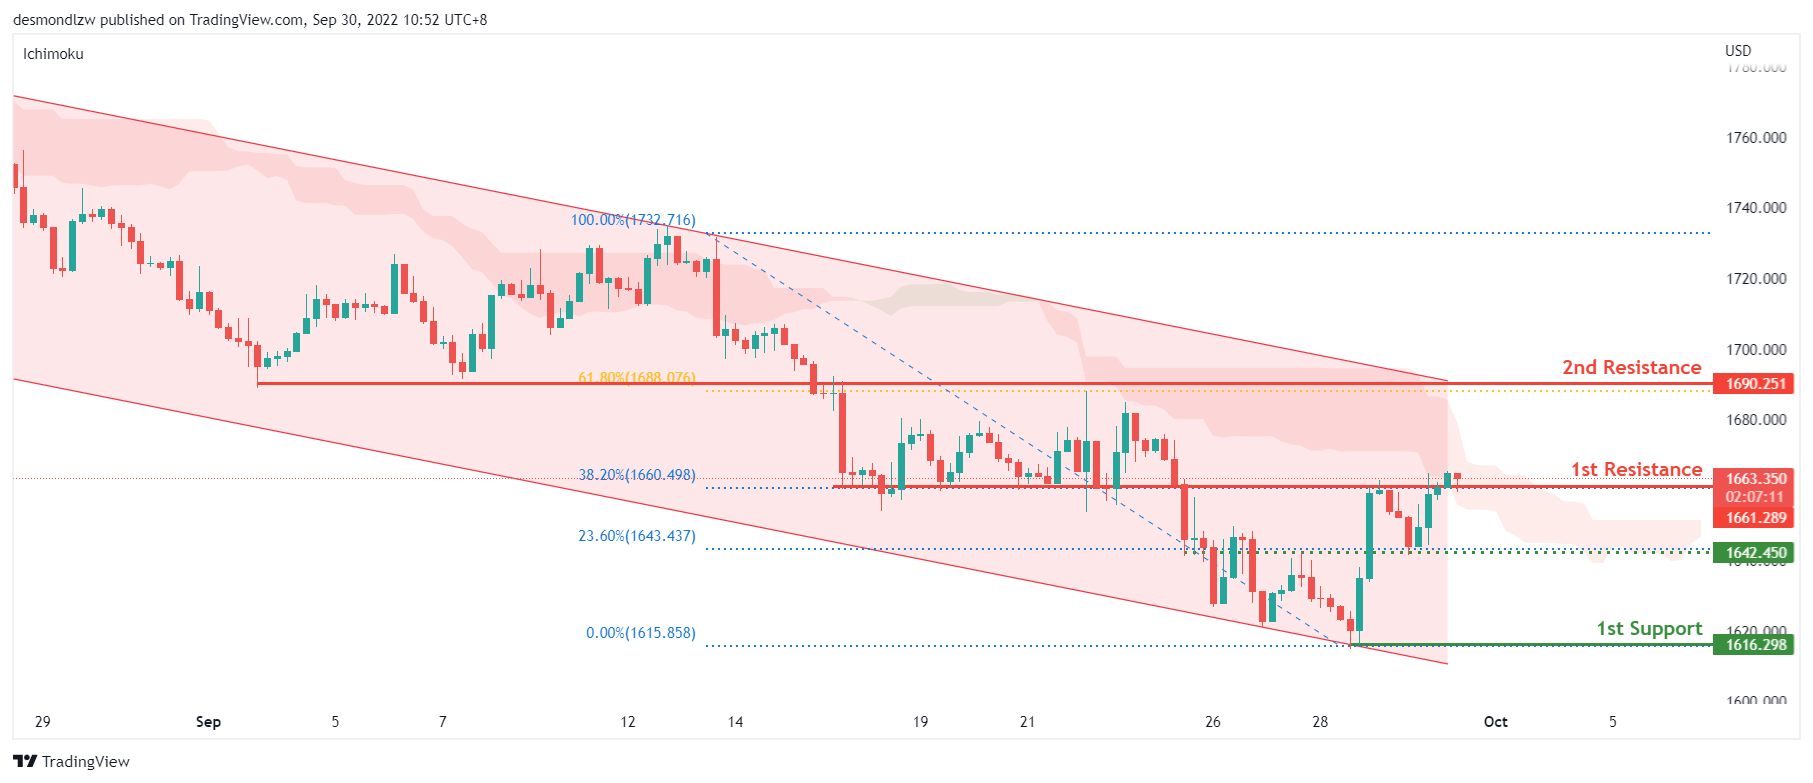
XAU/USD (GOLD):
On the H4, price is retracing from the 1st support of 1616 and within the bearish channel. However, price has moved into the ichimoku cloud which leads to a slight bullish bias that price may continue trading higher towards the 2nd resistance level of 1690 which is in line with the 61.80% fibonacci retracement level. Alternatively, price could trade lower to test the top of the 1st support level of 1616, which a risk level at 1642 which is in line with the 23.60% fibonacci retracement level.
Areas of consideration:
- H4 time frame, 1st resistance at 1663
- H4 time frame, 2nd resistance at 1690
- H4 time frame, 1st support at 1616
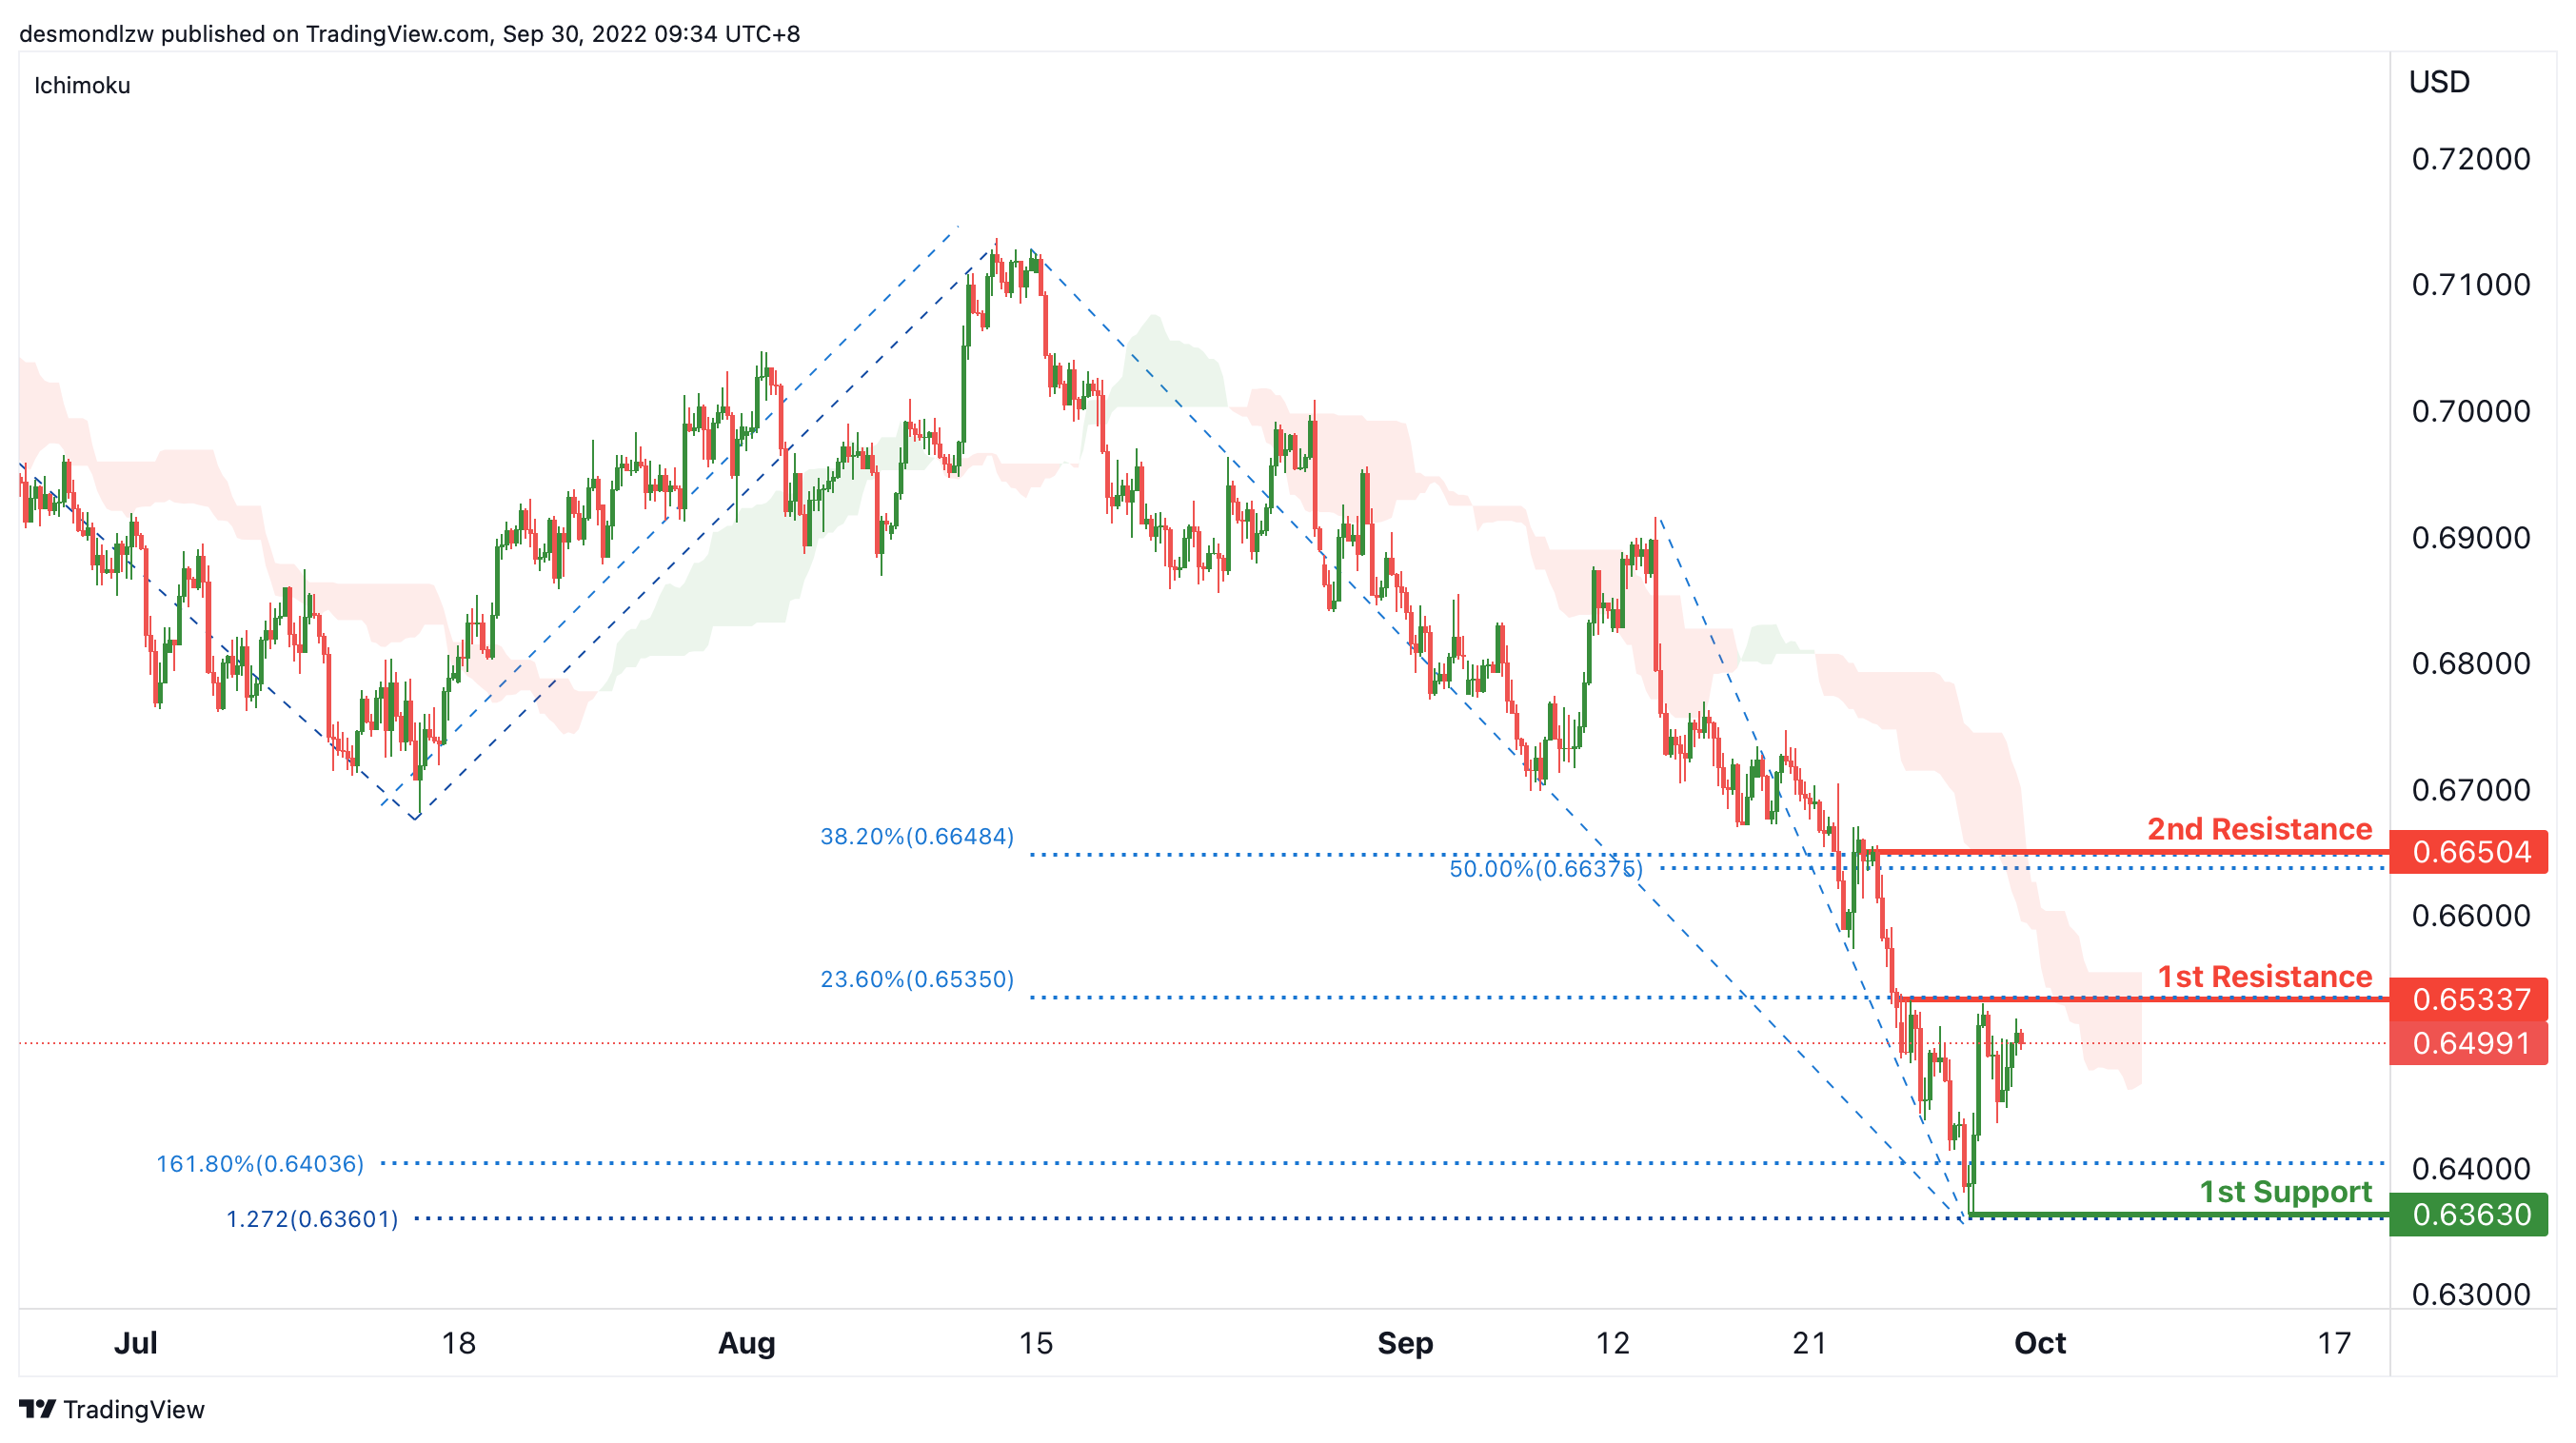
AUD/USD:
On the H4, the price is moving in a strong bearish trend. To add on confluence to this bias, price is below the Ichimoku cloud which indicates a bear market. Currently, the price is testing the 1st resistance at 0.65337, which is in line with the 23.6% fibonacci retracement. The price may drop from here to the 1st support at 0.63630, which is in line with the swing low, 161.8% fibonacci extension and 127.2% fibonacci projection. Alternatively, the price may rise to the 2nd resistance at 0.66504, where the pullback resistance, 50% and 38.2% fibonacci retracement are.
Areas of consideration
- H4, 1st resistance at 0.65337
- H4, 1st support at 0.63630
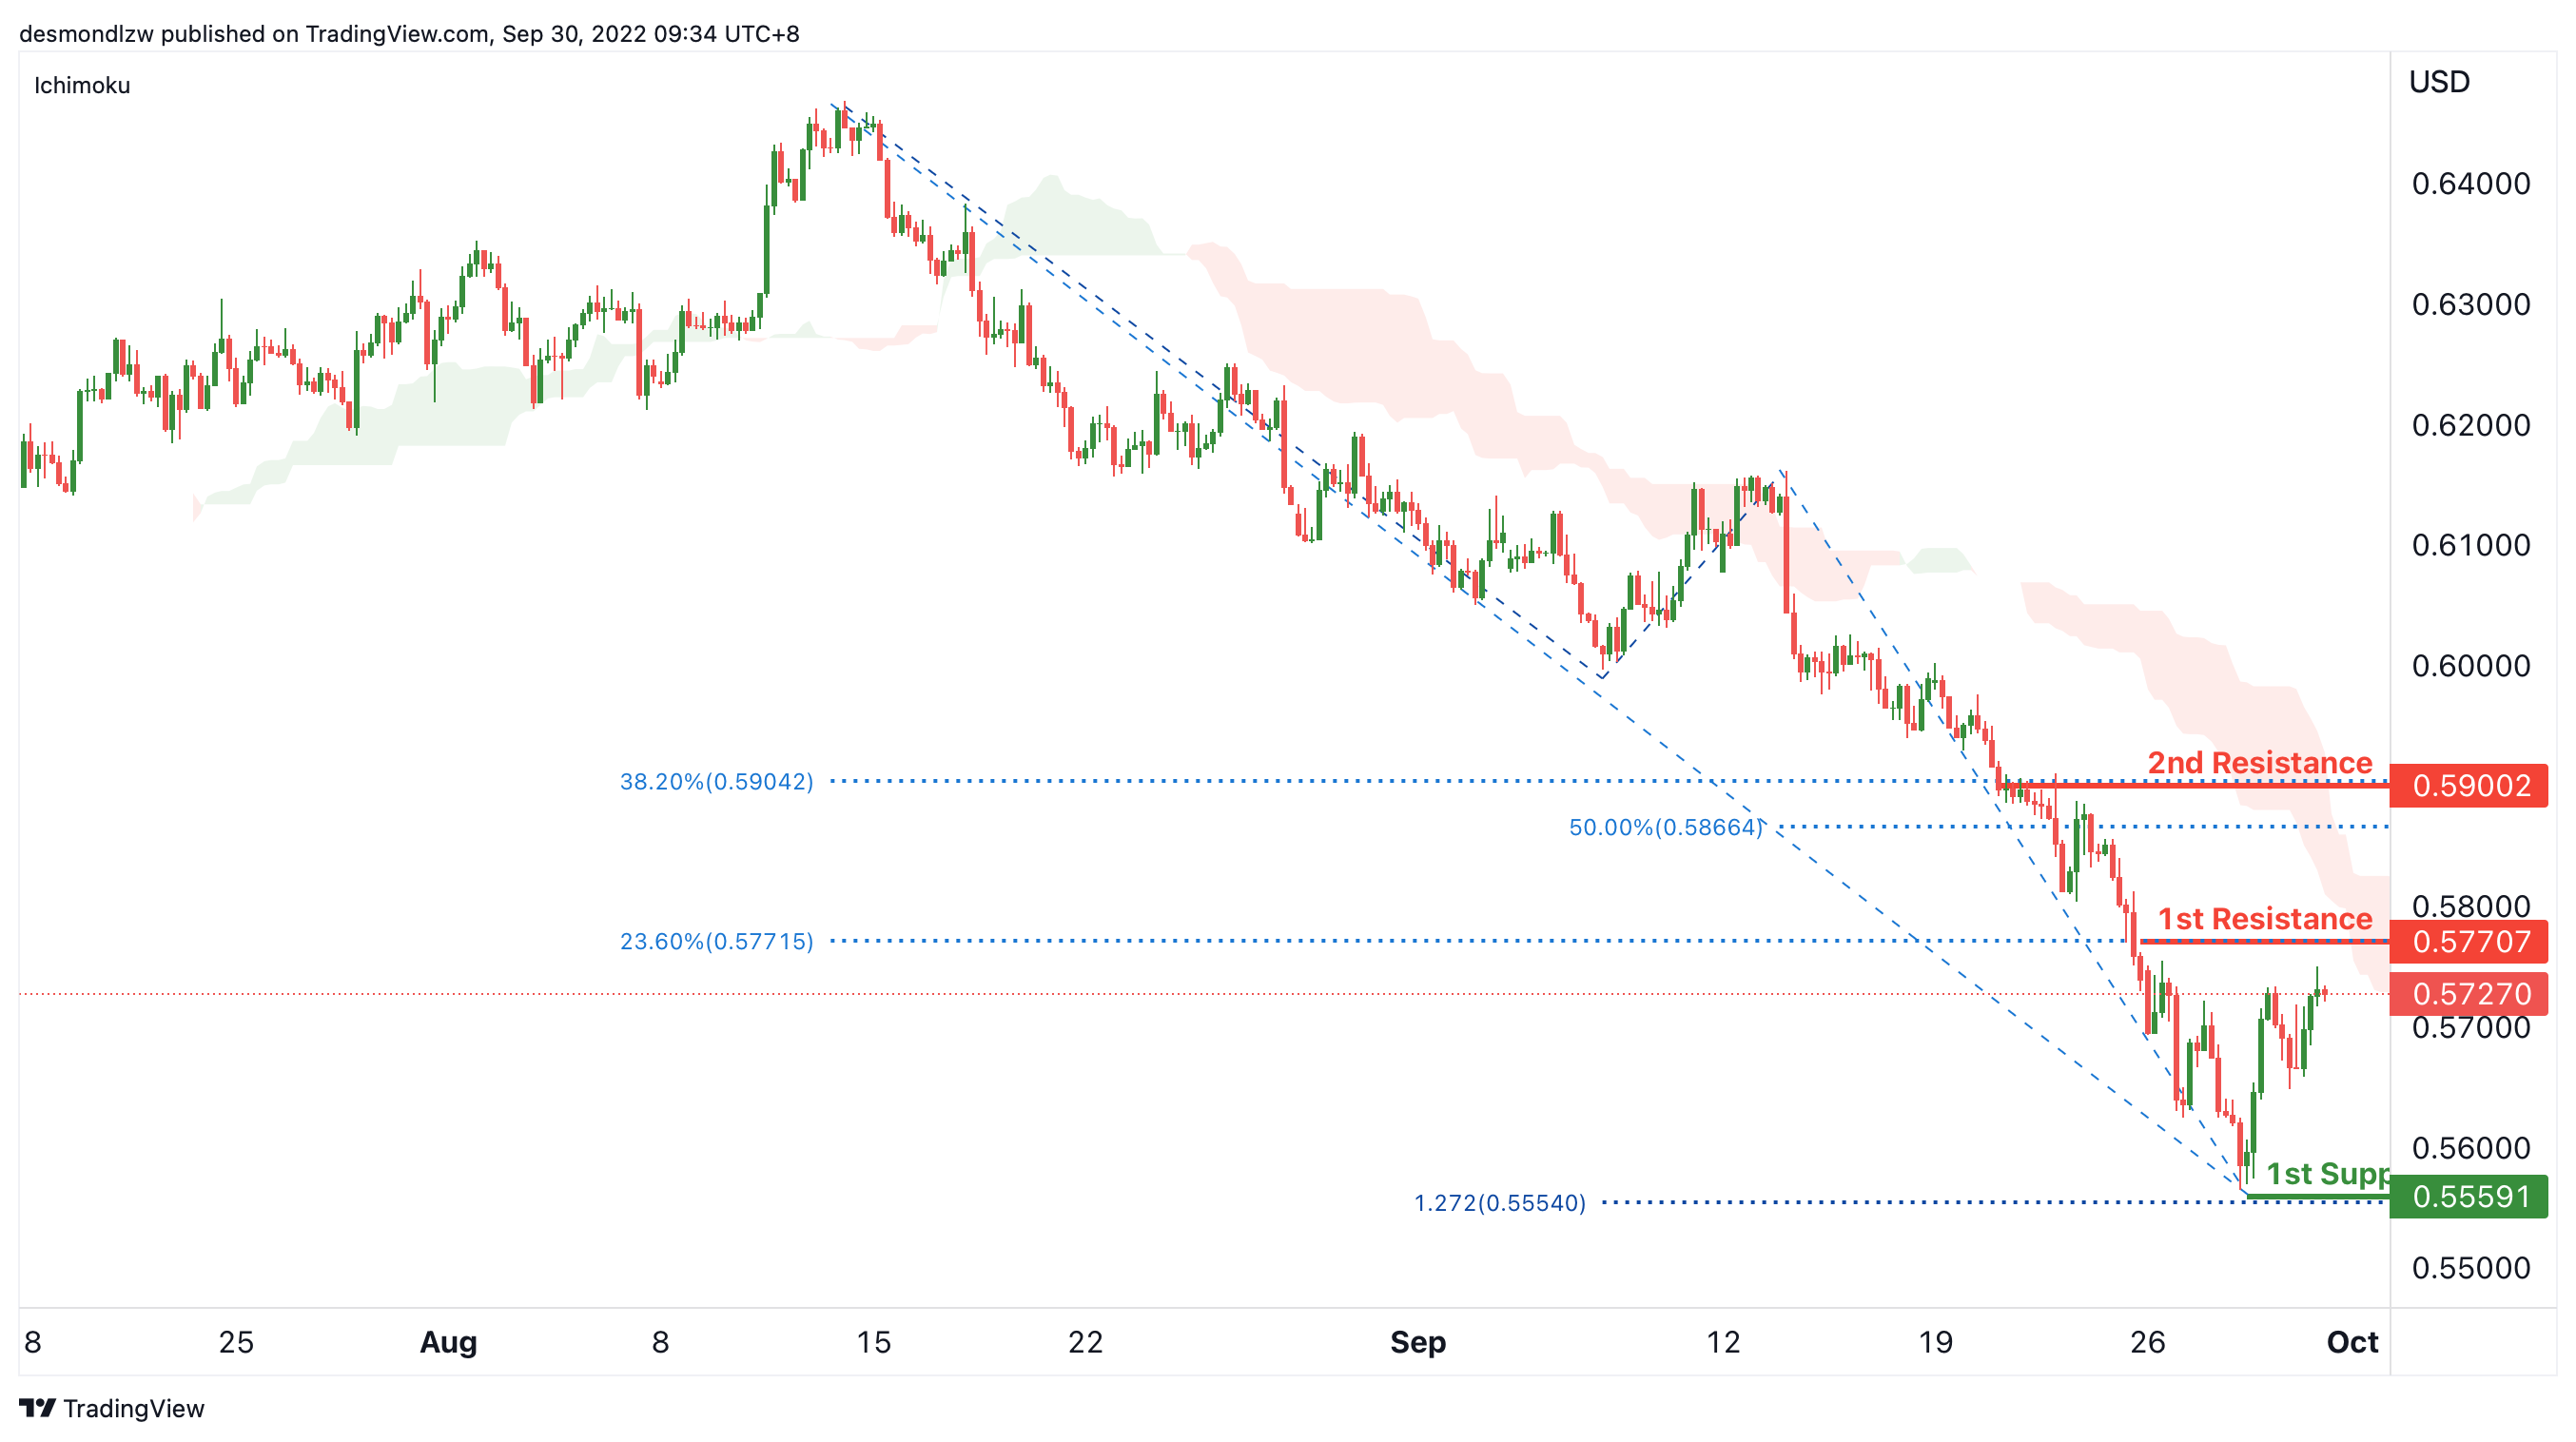
NZD/USD:
On the H4, with the price moving below the ichimoku cloud, we maintain a bearish bias that the price may test the 1st resistance at 0.57707, which is in line with the 23.6% fibonacci retracement and then drop to the 1st support at 0.55591, where the swing low and 127.2% fibonacci projection are. Alternatively, the price may break the 1st resistance and rise to the 2nd resistance at 0.59002, where the 38.2% and 50% fibonacci retracement are.
Areas of consideration:
- H4 time frame, 1st resistance at 0.57707
- H4 time frame, 1st support at 0.55626
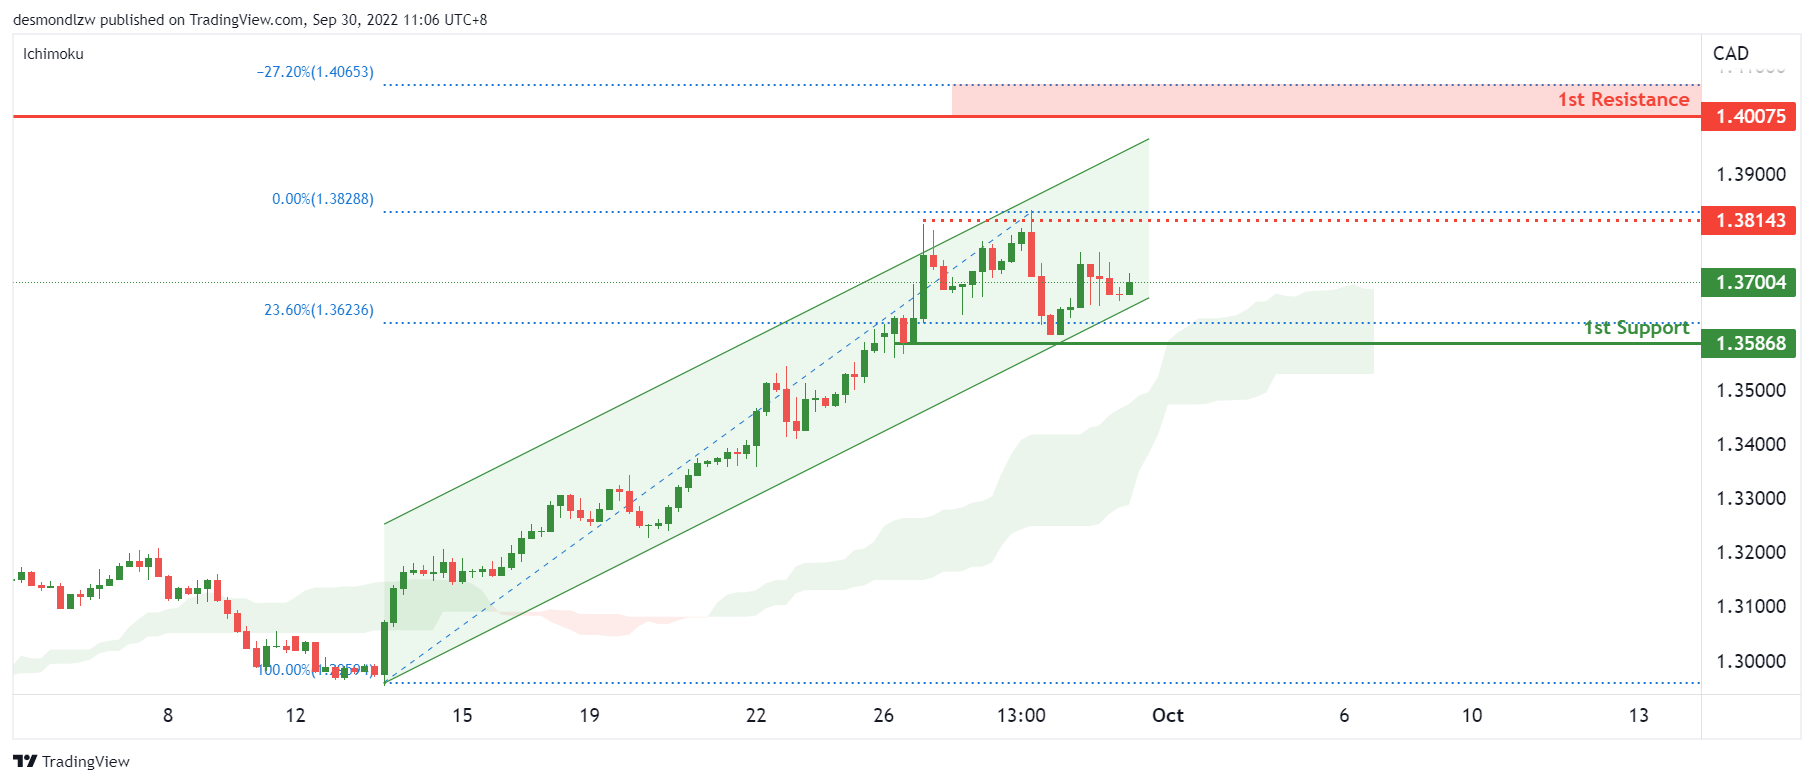
USD/CAD:
On the H4, the price retraced to the bottom of the ascending channel but maintains above the ichimoku cloud. We continue to have a bullish bias that price may rise to the 1st resistance at 1.40, which is in line with the 27.20% fibonacci expansion level and previous swing low from May 2020. However, there is a risk level at 1.3814 which was the previous swing high.
Areas of consideration:
- H4 time frame, 1st resistance at 1.40
- H4 time frame, 1st support at 1.3586
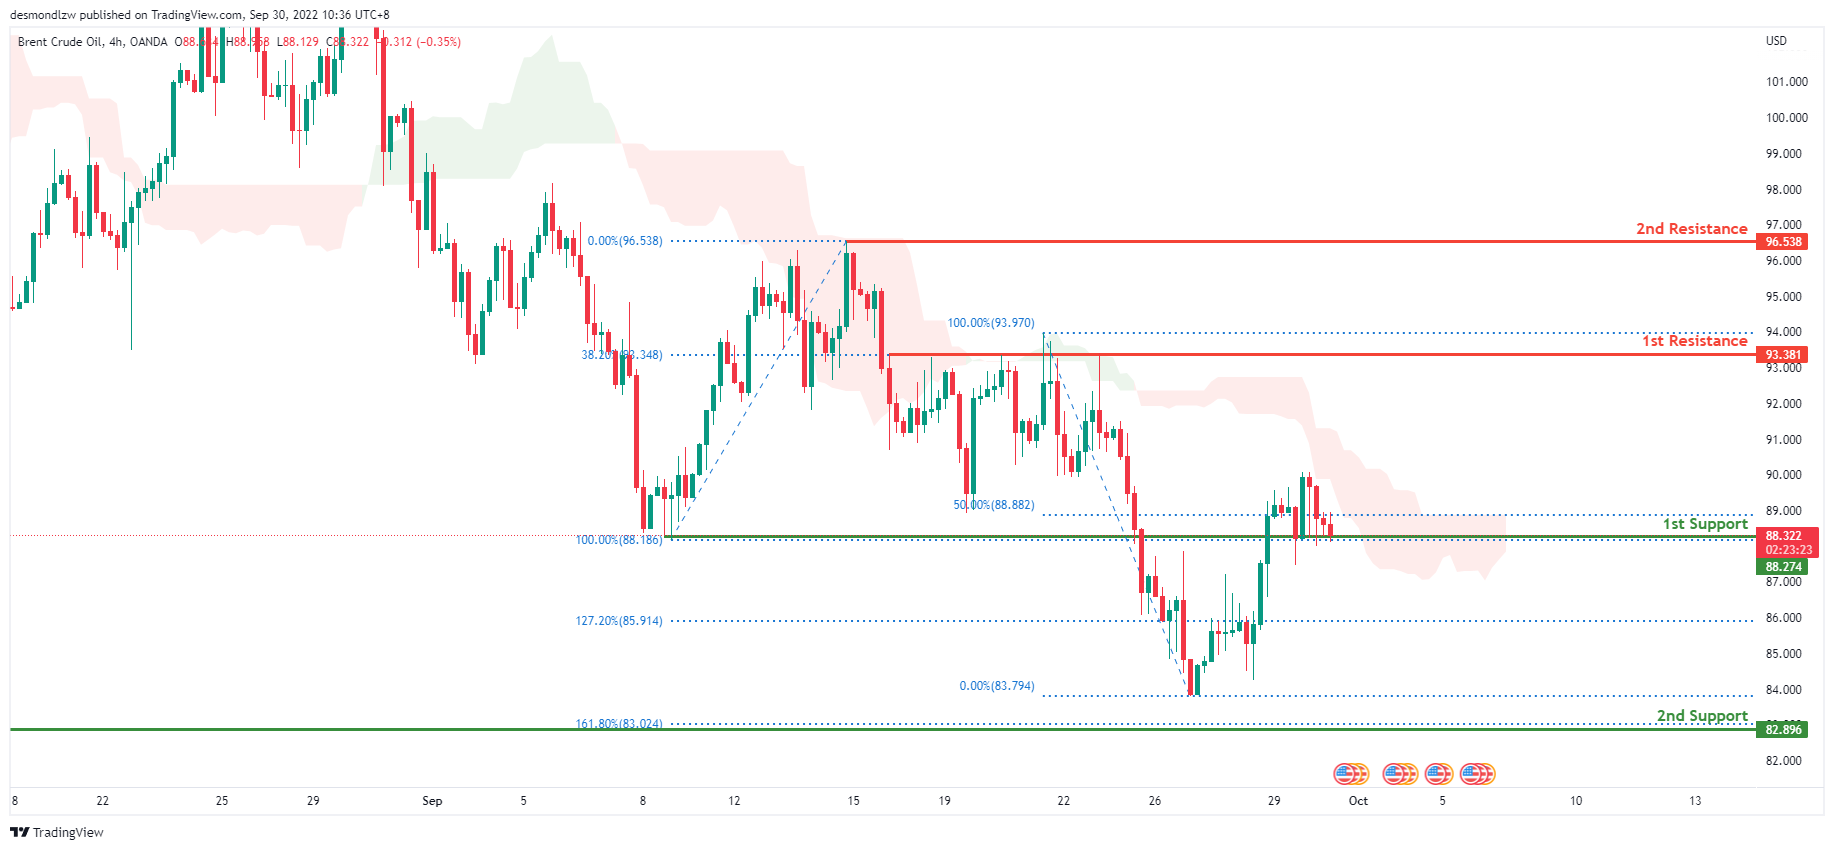
OIL:
On the H4, oil is in a bearish trend, and the price is also below the ichimoku cloud, indicating a bear market. Price is currently consolidating along the first support level at 85.380, which corresponds to the 100% Fibonacci extension. Expect price to move to the first resistance level at 93.381, where the 38.2% Fibonacci extension line is.
Areas of consideration:
- H4 time frame, 1st resistance at 93.381
- H4 time frame, 1st support at 88.366
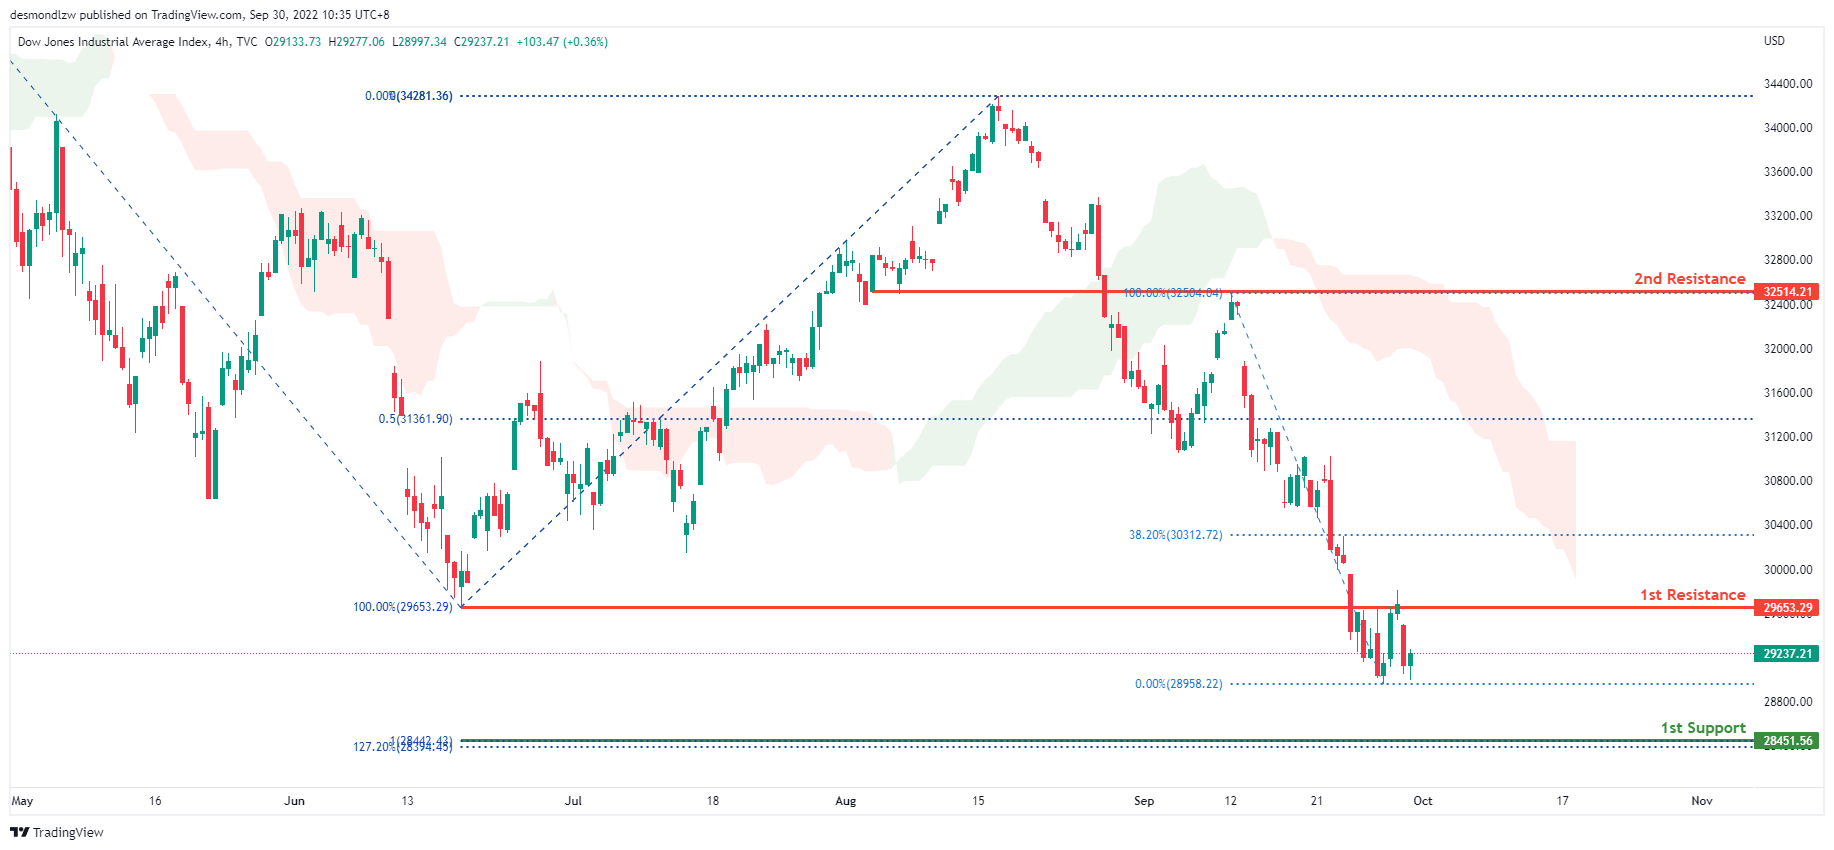
Dow Jones Industrial Average:
On the H4, the price is in a bearish trend. In addition, the price is below the ichimoku cloud, indicating a bearish market. Price has also broken through the first resistance level at 29653.29, which contains the 100% Fibonacci line and the previous swing low. Given the bearish momentum, price may return to the first support level at 28422.42, which contains the 100% Fibonacci projection line and the 127.2% Fibonacci extension line.
Areas of consideration:
- H4 time frame, 1st support at 28422.42
- H4 time frame, 1st resistance at 29653.29
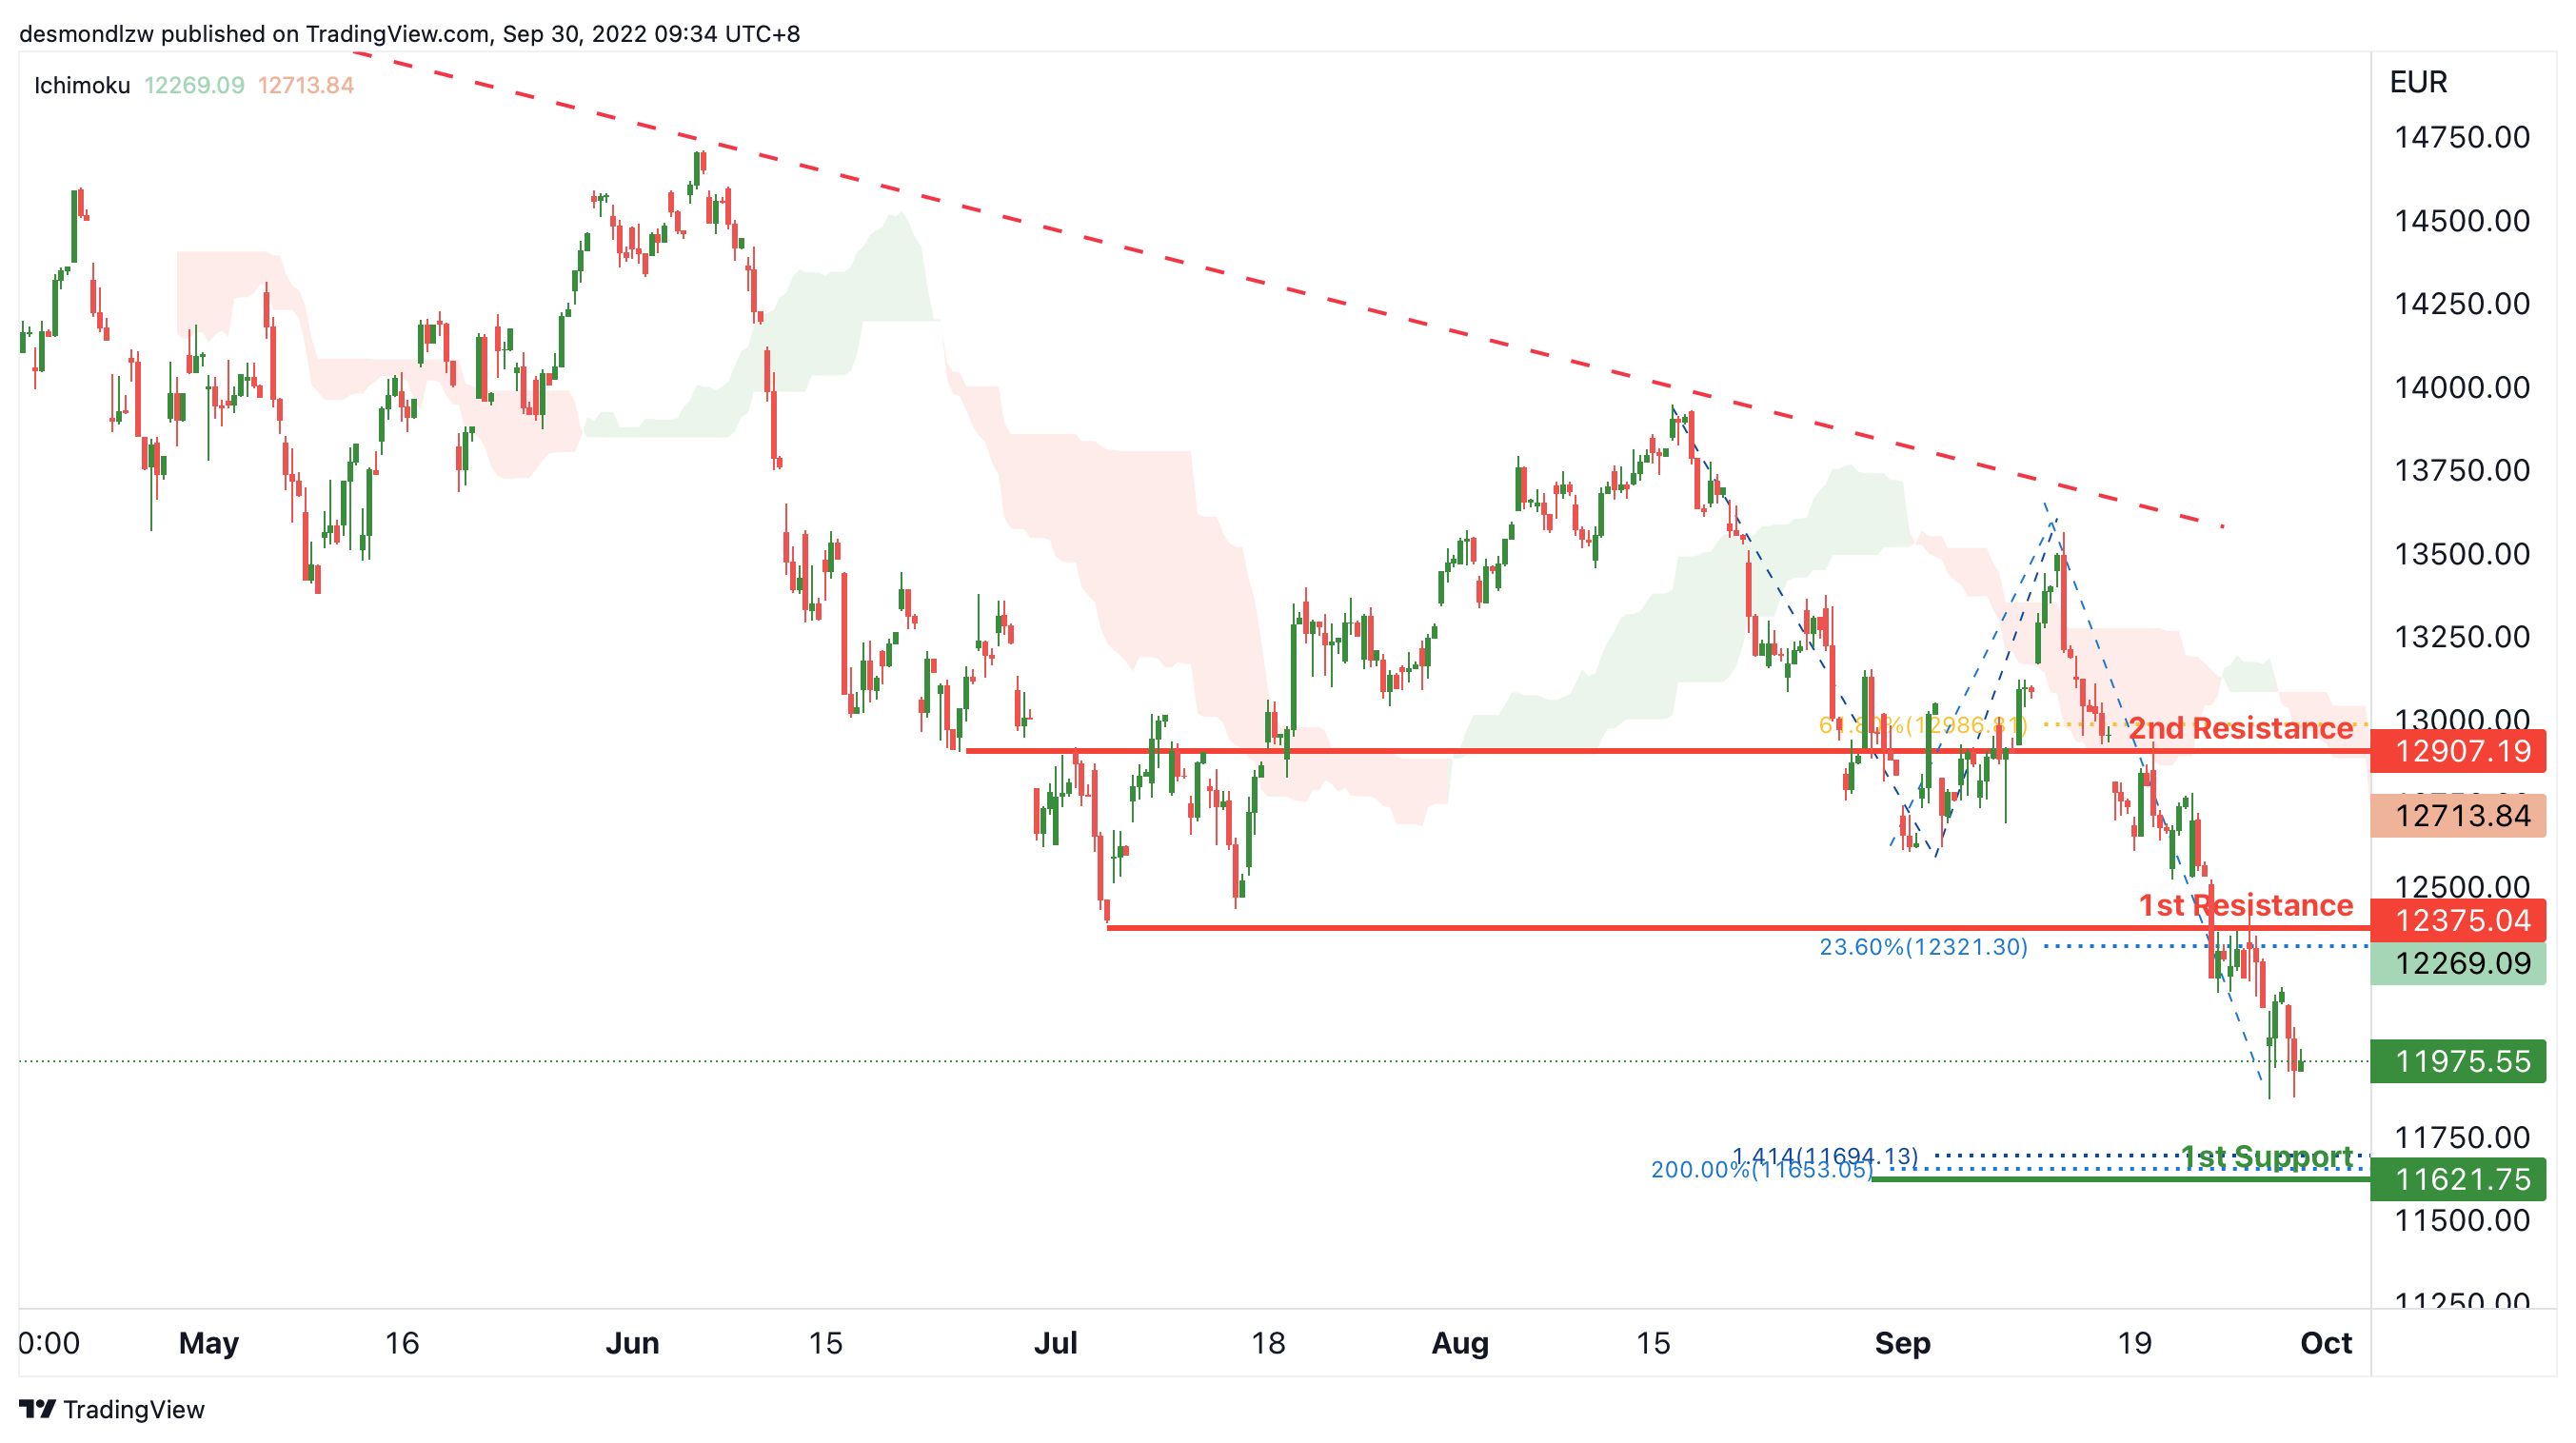
DAX:
On the H4, with the price moving below the descending trendline and below ichimoku cloud, we have a bearish bias that the price may drop to the 1st support at 11621.75, where the 141.4% fibonacci projection and 200% fibonacci projection are. Alternatively, the price may rise to test the 1st resistance at 12375.04, which is in line with the overlap resistance and 23.6% fibonacci retracement. If the 1st resistance is broken, the price may rise to the 2nd resistance at 12907.19, where the 61.8% fibonacci retracement is.
Areas of consideration:
- H4 time frame, 1st resistance at 12375.04
- H4 time frame, 1st support at 11621.75
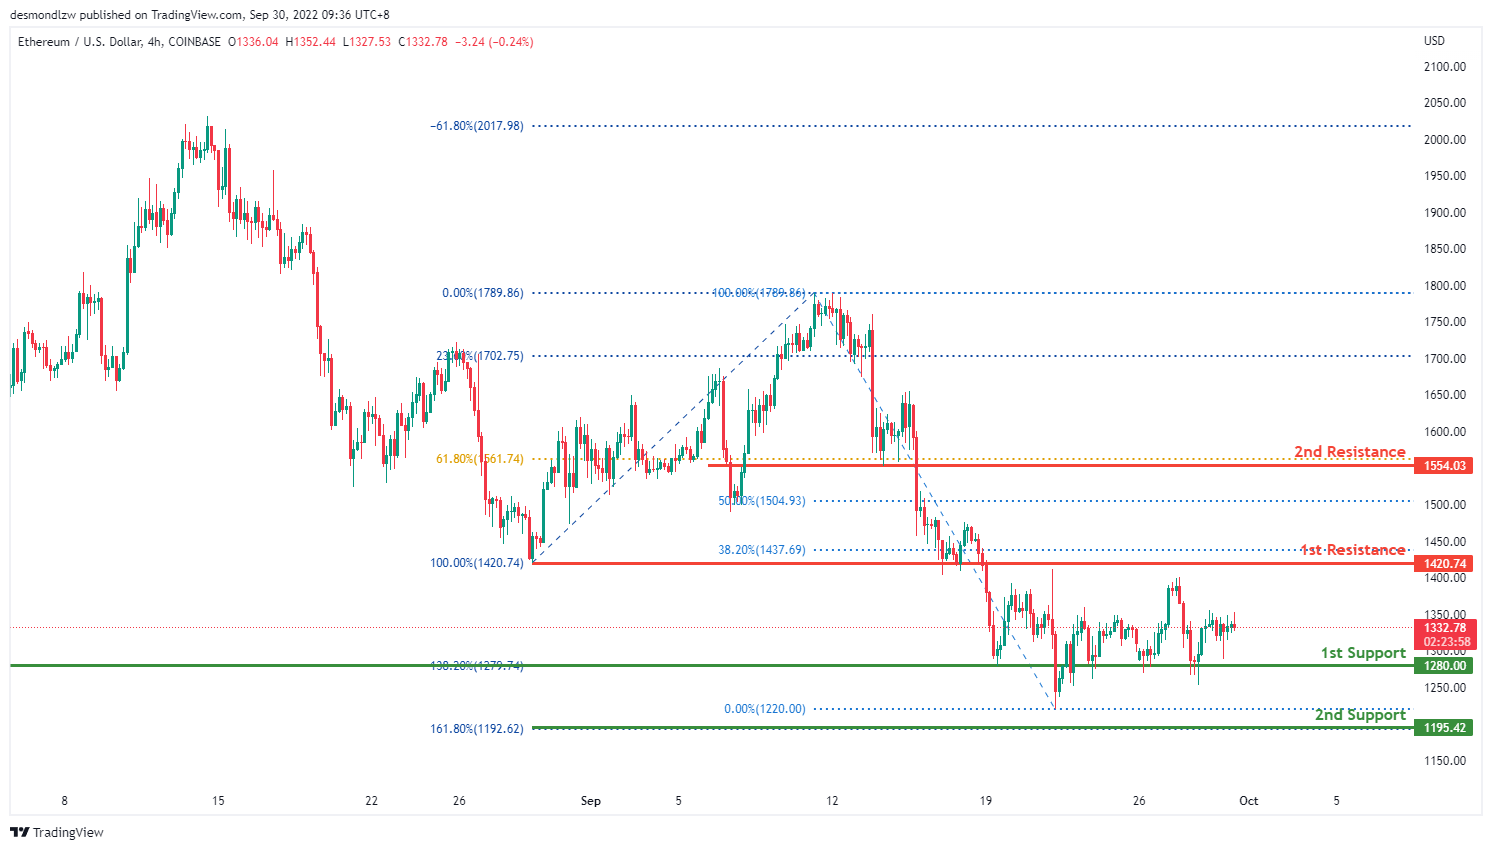
ETHUSD:
On the H4, the overall price of ETHUSD is very bearish. Price appears to be consolidating above the first support line at 1270.74, which also happens to be the 138.2% Fibonacci line. Price is expected to remain in this range between the first resistance at 1420.74, where the previous swing low is located, and the first support.
Areas of consideration:
- H4 time frame, 1st resistance of 1420.74
- H4 time frame, 1st support at 1280.00
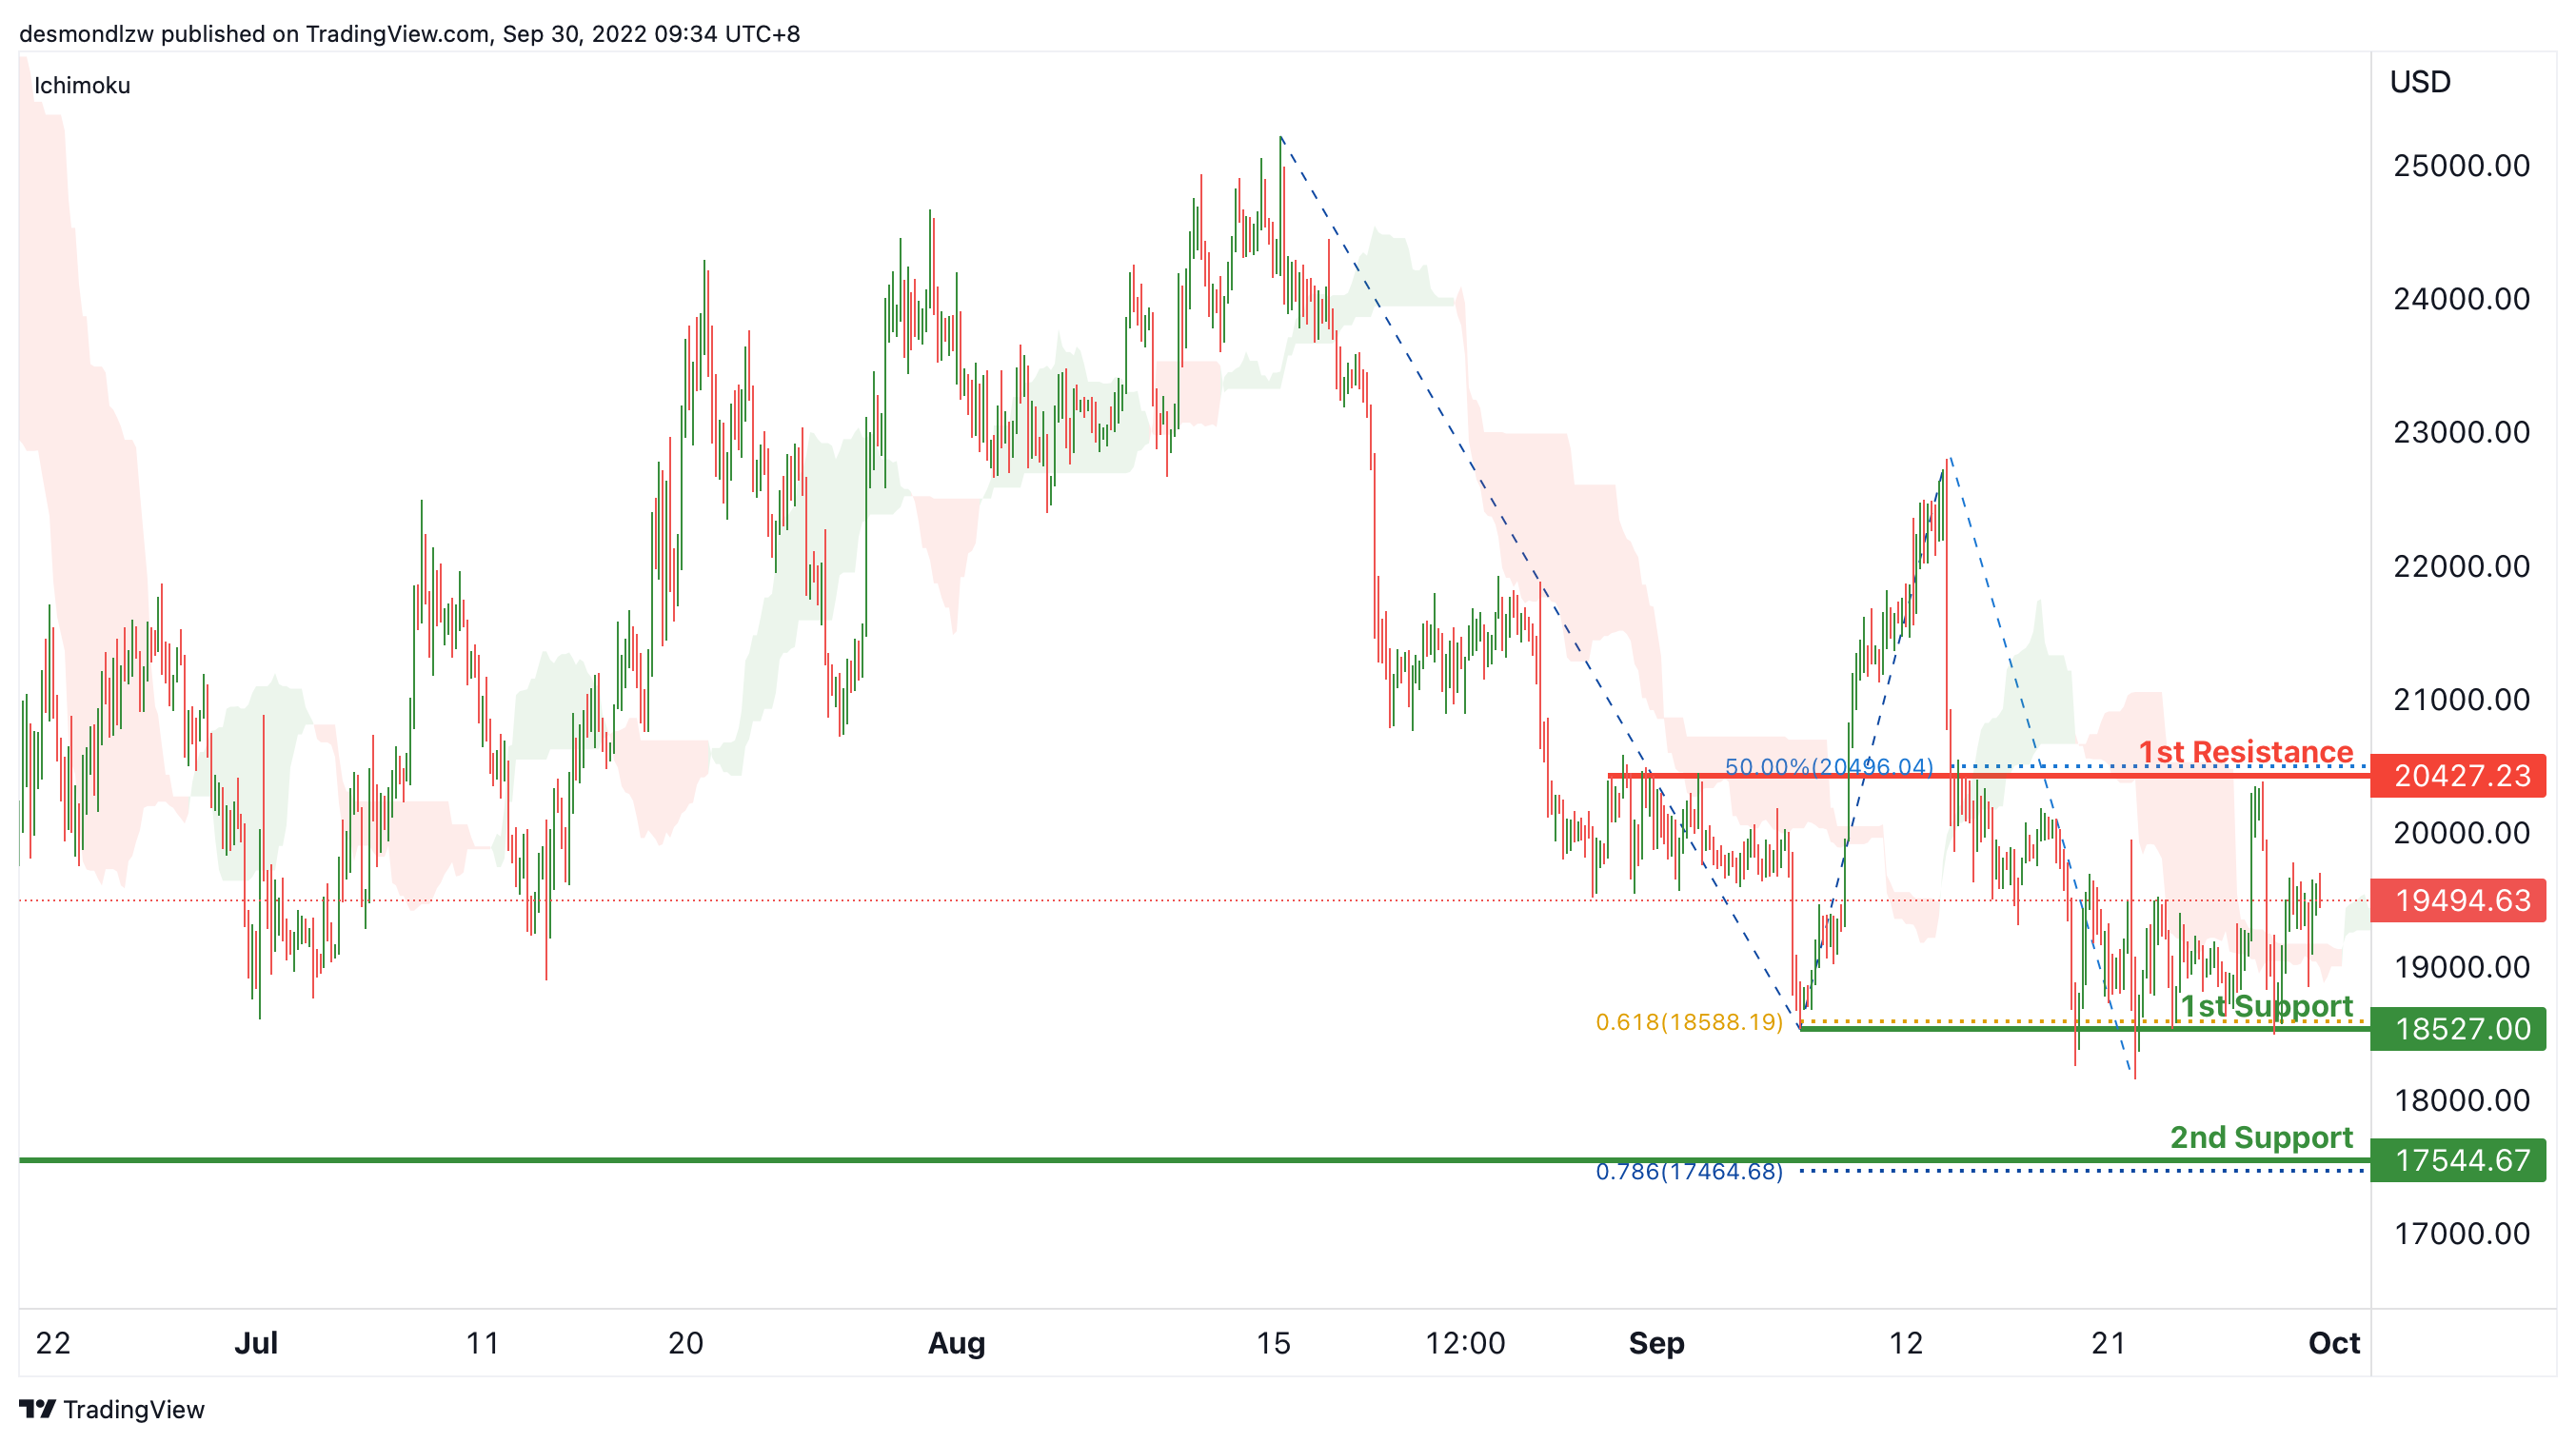
BTCUSD:
On the H4, price reversing from the 1st support and crossing the ichimoku cloud, we have a bullish bias that the price may test the 1st resistance at 20427.23, where the overlap resistance and 50% fibonacci retracement are. After testing the 1st resistance, the price may pullback and drop to the 1st support at 18527, which is in line with the swing lows and 61.8% fibonacci projection. If the 1st support is broken, the 2nd support could be at 17544.67, which is in line with the 78.6% fibonacci projection and swing low.
Areas of consideration:
- H4 time frame, 1st resistance at 20427.23
- H4 time frame, 1st support at 18527
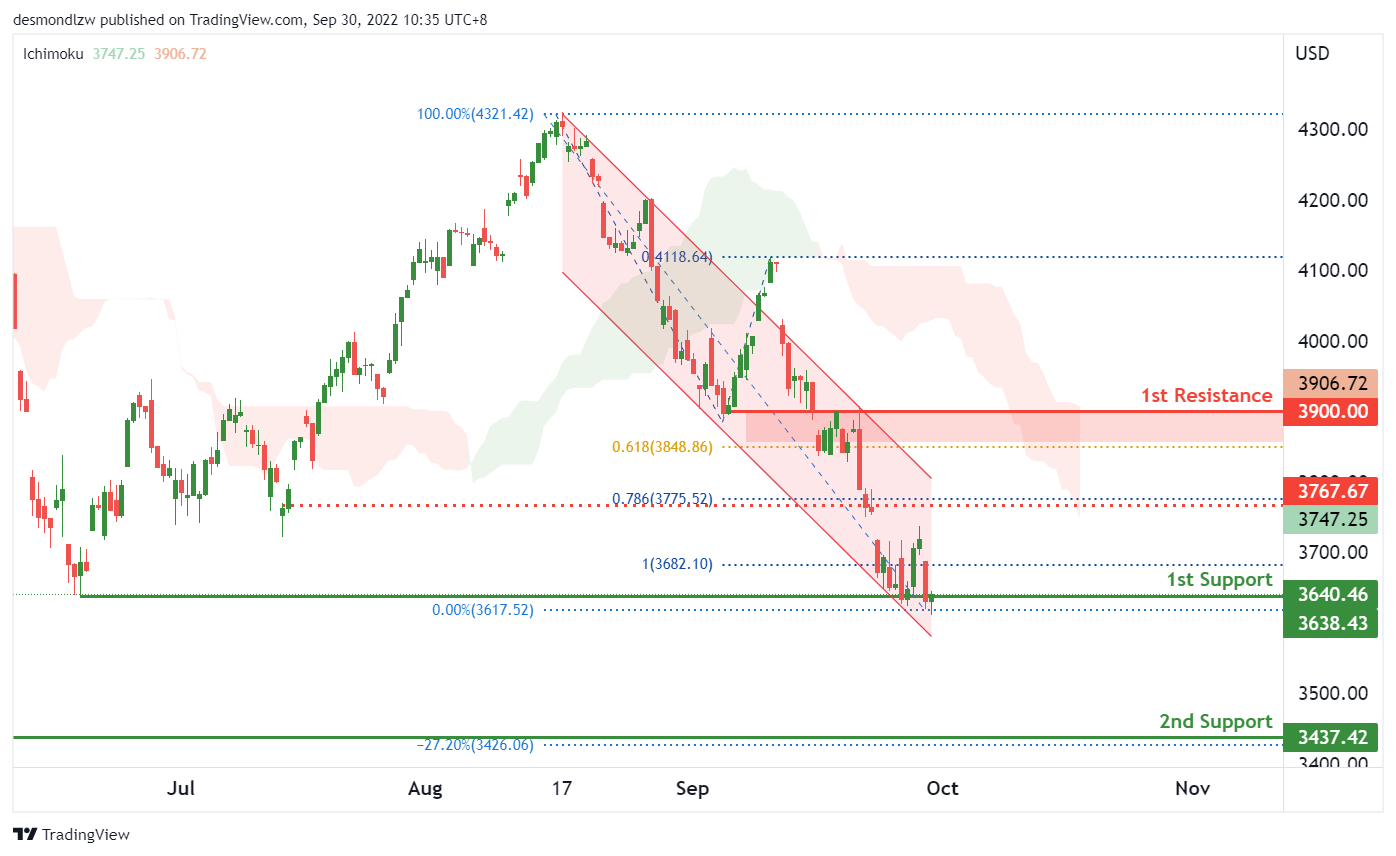
S&P 500:
On the H4, with the price within a descending channel and below the ichimoku cloud, we continue to have a bearish bias. However, with the price currently at the 1st support off the 1st support of 3640, which is in line with the previous swing low of June 2022, we could see price testing the 3767 intermediate level before testing the 1st support again. Beyond the 1st support, the 2nd support is at 3427 which is in line with the previous swing low of October 2020 and the 27.20% fibonacci expansion level
Areas of consideration:
- H4 time frame, 1st resistance at 3900
- H4 time frame, 1st support at 3640
- H4 time frame, 2nd support at 3437
The accuracy, completeness and timeliness of the information contained on this site cannot be guaranteed. IC Markets does not warranty, guarantee or make any representations, or assume any liability regarding financial results based on the use of the information in the site.
News, views, opinions, recommendations and other information obtained from sources outside of www.icmarkets.com.au, used in this site are believed to be reliable, but we cannot guarantee their accuracy or completeness. All such information is subject to change at any time without notice. IC Markets assumes no responsibility for the content of any linked site.
The fact that such links may exist does not indicate approval or endorsement of any material contained on any linked site. IC Markets is not liable for any harm caused by the transmission, through accessing the services or information on this site, of a computer virus, or other computer code or programming device that might be used to access, delete, damage, disable, disrupt or otherwise impede in any manner, the operation of the site or of any user’s software, hardware, data or property.