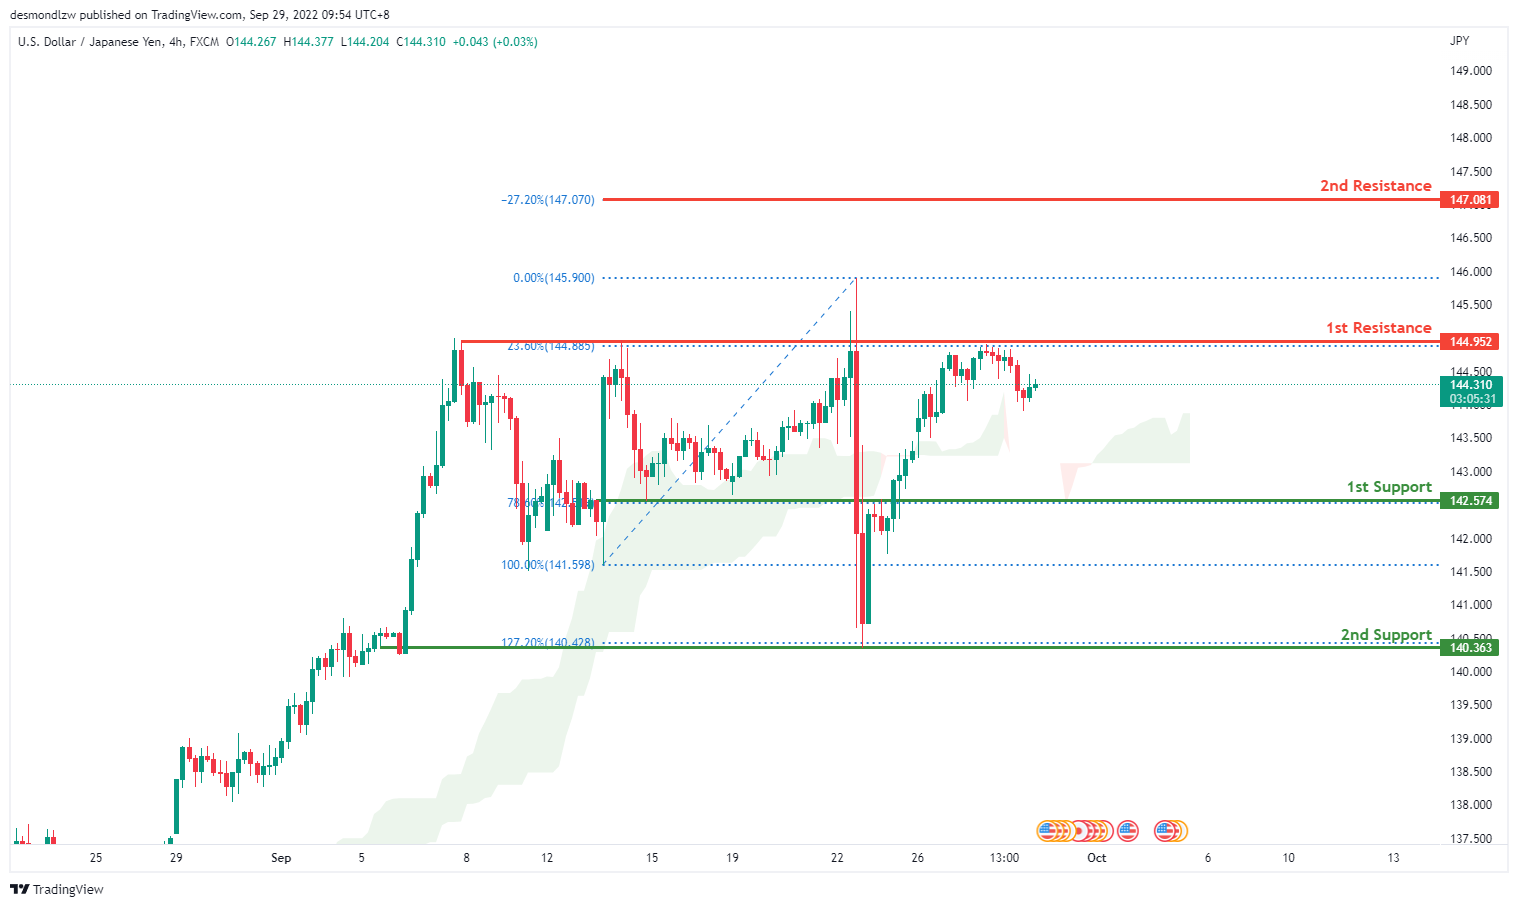
USD/JPY:
On the H4 chart, price has pushed through very strongly through the 1st support at 142.574 where the 78.6% Fibonacci line lies. Price has tapped and tried to break through the 1st resistance multiple times at 144.952 where the 23.6% Fibonacci line lies. Looking for price to possibly reflect back down from the 1st resistance back down towards the 1st support at 142.574 where the 78.6% Fibonacci line is. Alternatively, price might break through the 1st resistance and head towards the 2nd resistance at 147.070 where the -27.2% Fibonacci expansion line is.
Areas of consideration:
- H4 time frame, 1st resistance at 144.952
- H4 time frame, 1st support at 142.574
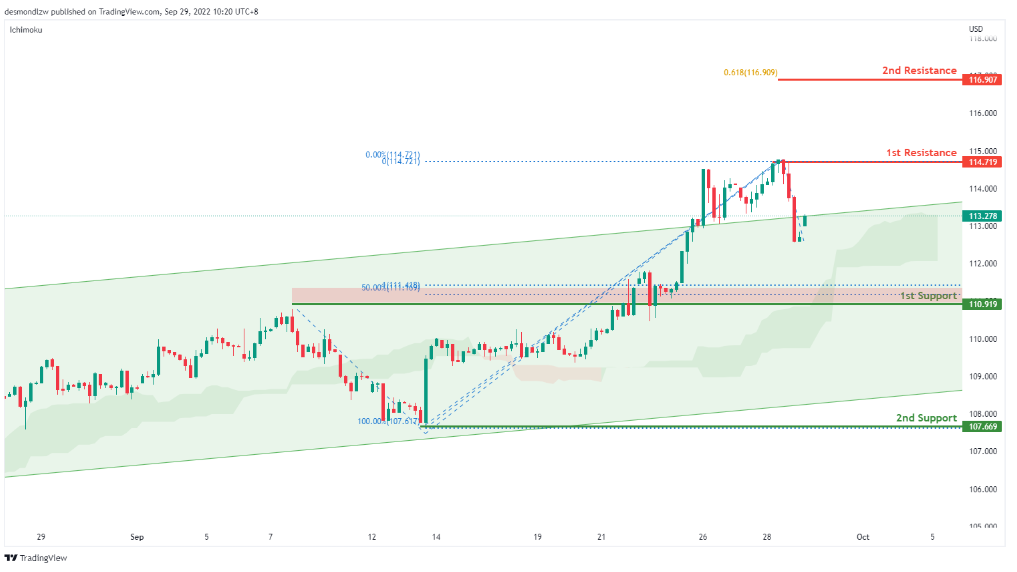
DXY:
On the H4, price is still respecting the ichimoku and ascending trend hence we are bullish bias. Price has tested the first resistance at 114.719 levels where the previous swing high sits. If it breaks this level, there is a confirmation for strong bullish momentum and price might test the second resistance at 116.507 where the 61.8% sits. Alternatively price could pull back to test the first support at 110.919 where the 50% retracement and 100% projection sits. If price breaks this support it should test the second support at 107.669 where the previous swing low sits
Areas of consideration:
- H4 time frame, 1st resistance at 114.719
- H4 time frame, 1st support at 110.919
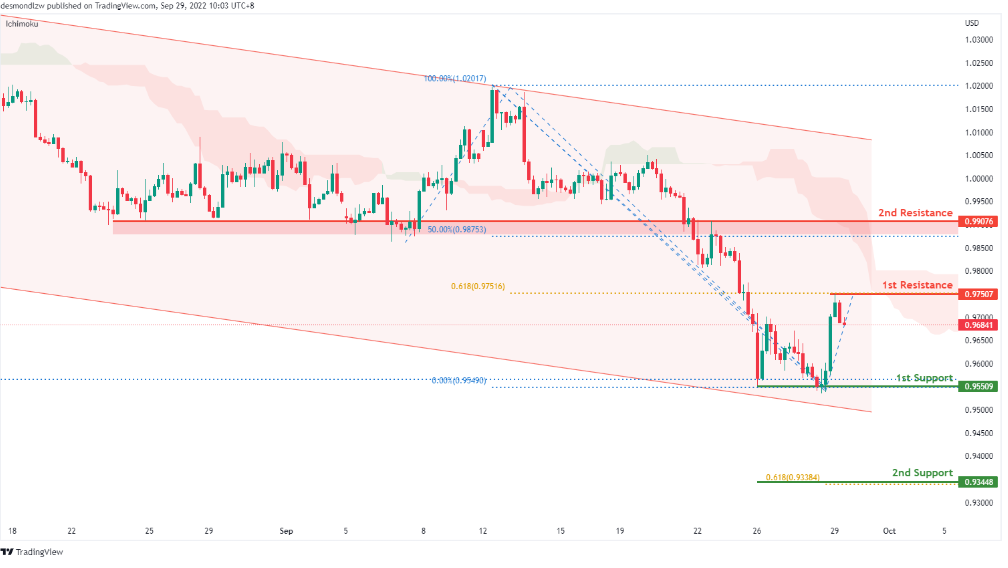
EUR/USD:
On the H4, price is moving within the channel in a descending manner- we are bearish biased. Price has bounced off the first support and is moving toward the first resistance at 0.9750 where the 61.8% projection sits. If price breaks this level, it will test the second resistance at 0.9907 where the 50% retracement and 100% projection sits. Alternatively, strong bearish momentum should bring price back to test the first resistance at 0.9550 where the previous swing low and 161.8% extension sits. If it breaks this level, we have a strong bearish confirmation to bring price down to 0.9344 where the 61.8% projection sits
Areas of consideration :
- H4 1st resistance at 0.9750
- H4 1st support at 0.9550
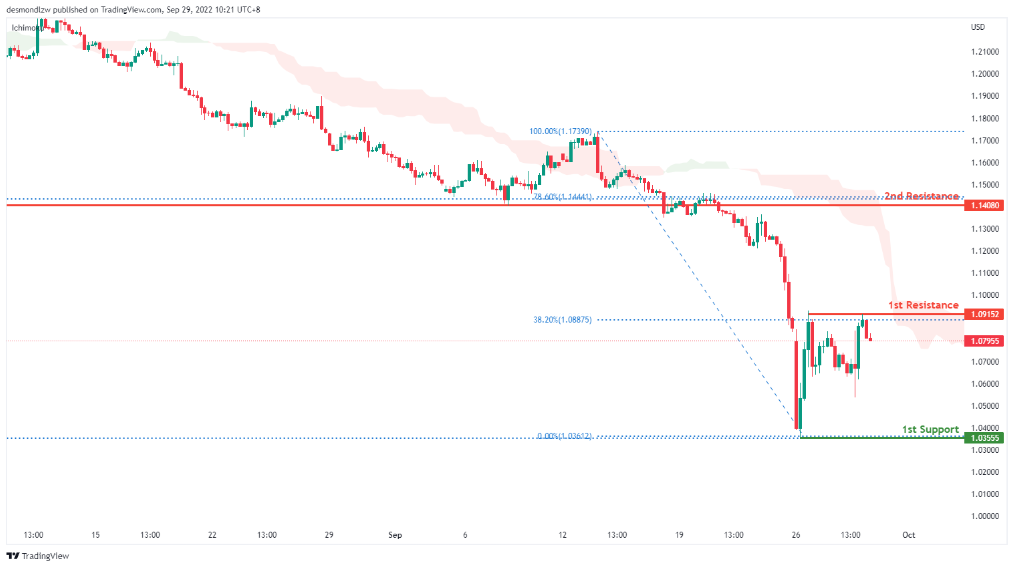
GBP/USD:
On the daily time frame, prices are still moving in a bearish momentum and have rejected the first resistance hence we are bearish biassed. Price has already tested the previous swing low at 1.0355 where the 138.2% extension sits. If bearish momentum continues, it should bring price to 0.9665 where the 161.8% extension sits. Alternatively price could pull back to test the first resistance at 1.0915 where the 38.2% retracement sits then the second resistance at 1.1408 where the previous swing low and 78.6% retracement sits
Areas of consideration:
- H4 1st resistance at 1.0915
- H4 1st support at 1.0355
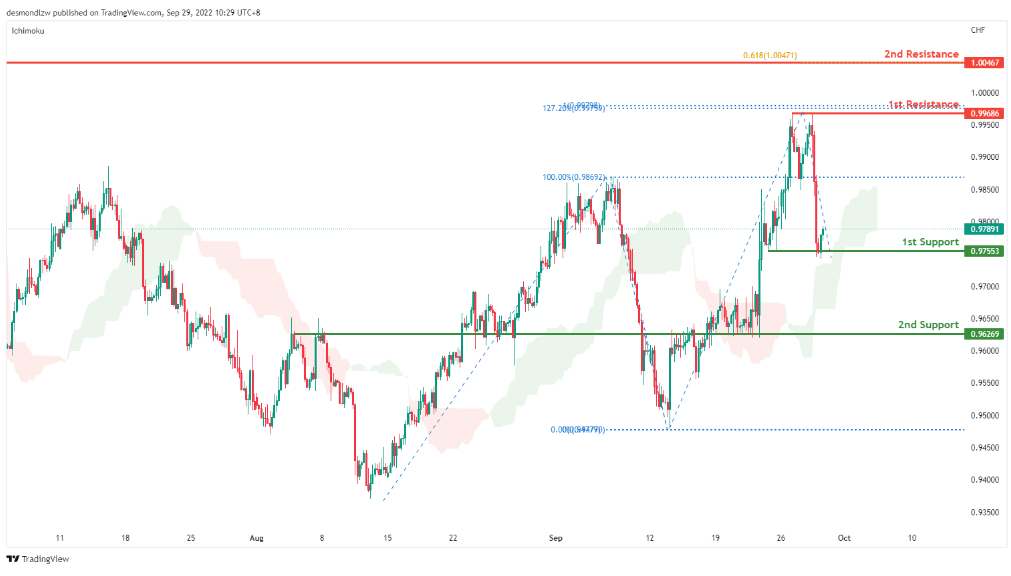
USD/CHF:
On the H4, prices have broken the descending channel and are still moving above the ichimoku cloud- we are bullish biased. Price has broken and rejected the first support and is moving toward the first resistance at 0.9968 where the 100% projection,127.2% extension and swing high sits. If bullish momentum continues, it should bring price to the second resistance at 1.0046 where the 61.8% projection and previous swing high sits. Alternatively, price could pull back to test the first support at 0.9755 where the 23.6% retracement and overlapping resistance sits. If it breaks the first support, it should bring price to the second support at 0.9626 where the previous swing low sits.
Areas of consideration
- H4 1st support at 0.9755
- H4 1st resistance at 0.9968
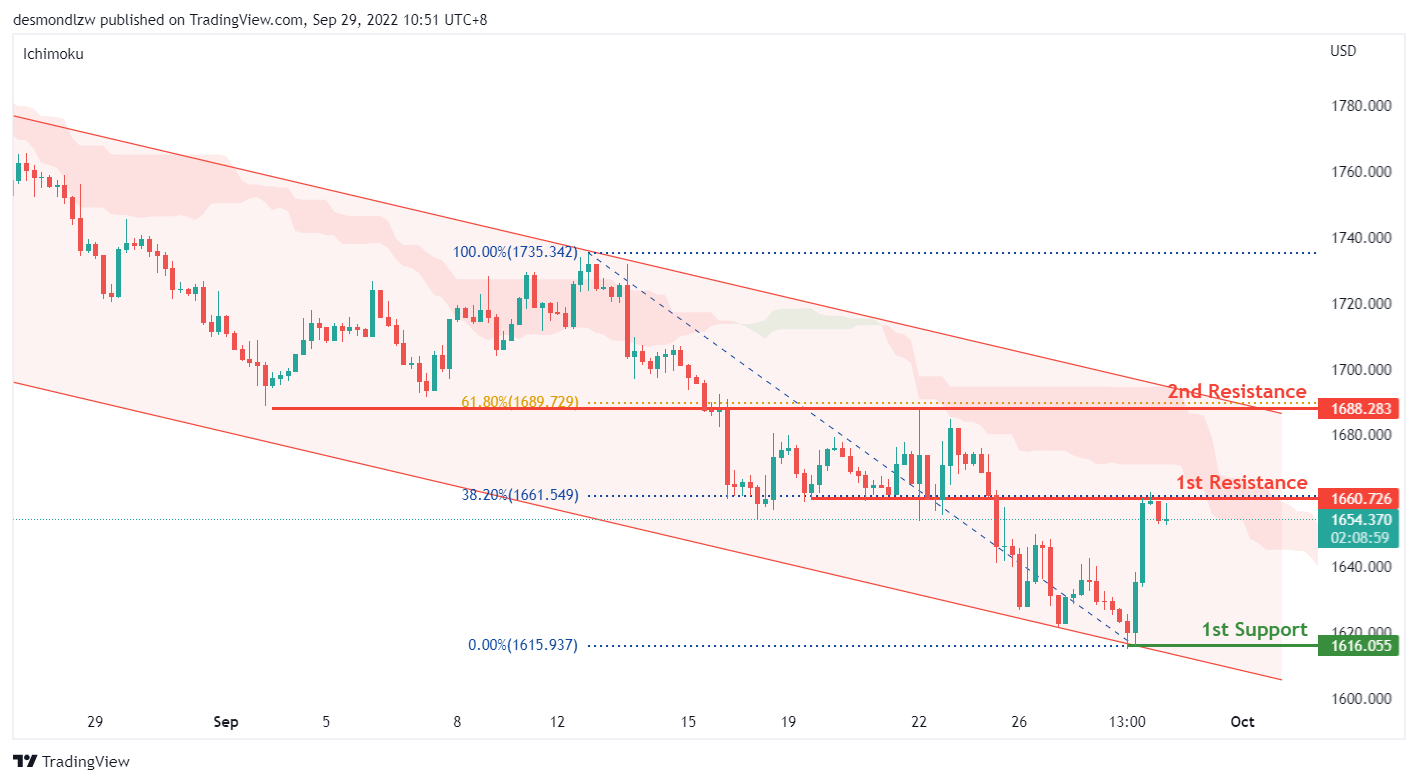
XAU/USD (GOLD):
On the H4, with the price retracing from the 1st support of 1616 but still within the bearish channel and below the ichimoku cloud, we continue to have a bearish bias that price may reverse from the 1st resistance of 1660, which is in line with the 38.20% fibonacci retracement level. Alternatively, price could trade higher to test the top of the bearish channel and the 2nd resistance and 61.80% fibonacci level at 1688.
Areas of consideration:
- H4 time frame, 1st resistance at 1660
- H4 time frame, 2nd resistance at 1688
- H4 time frame, 1st support at 1616
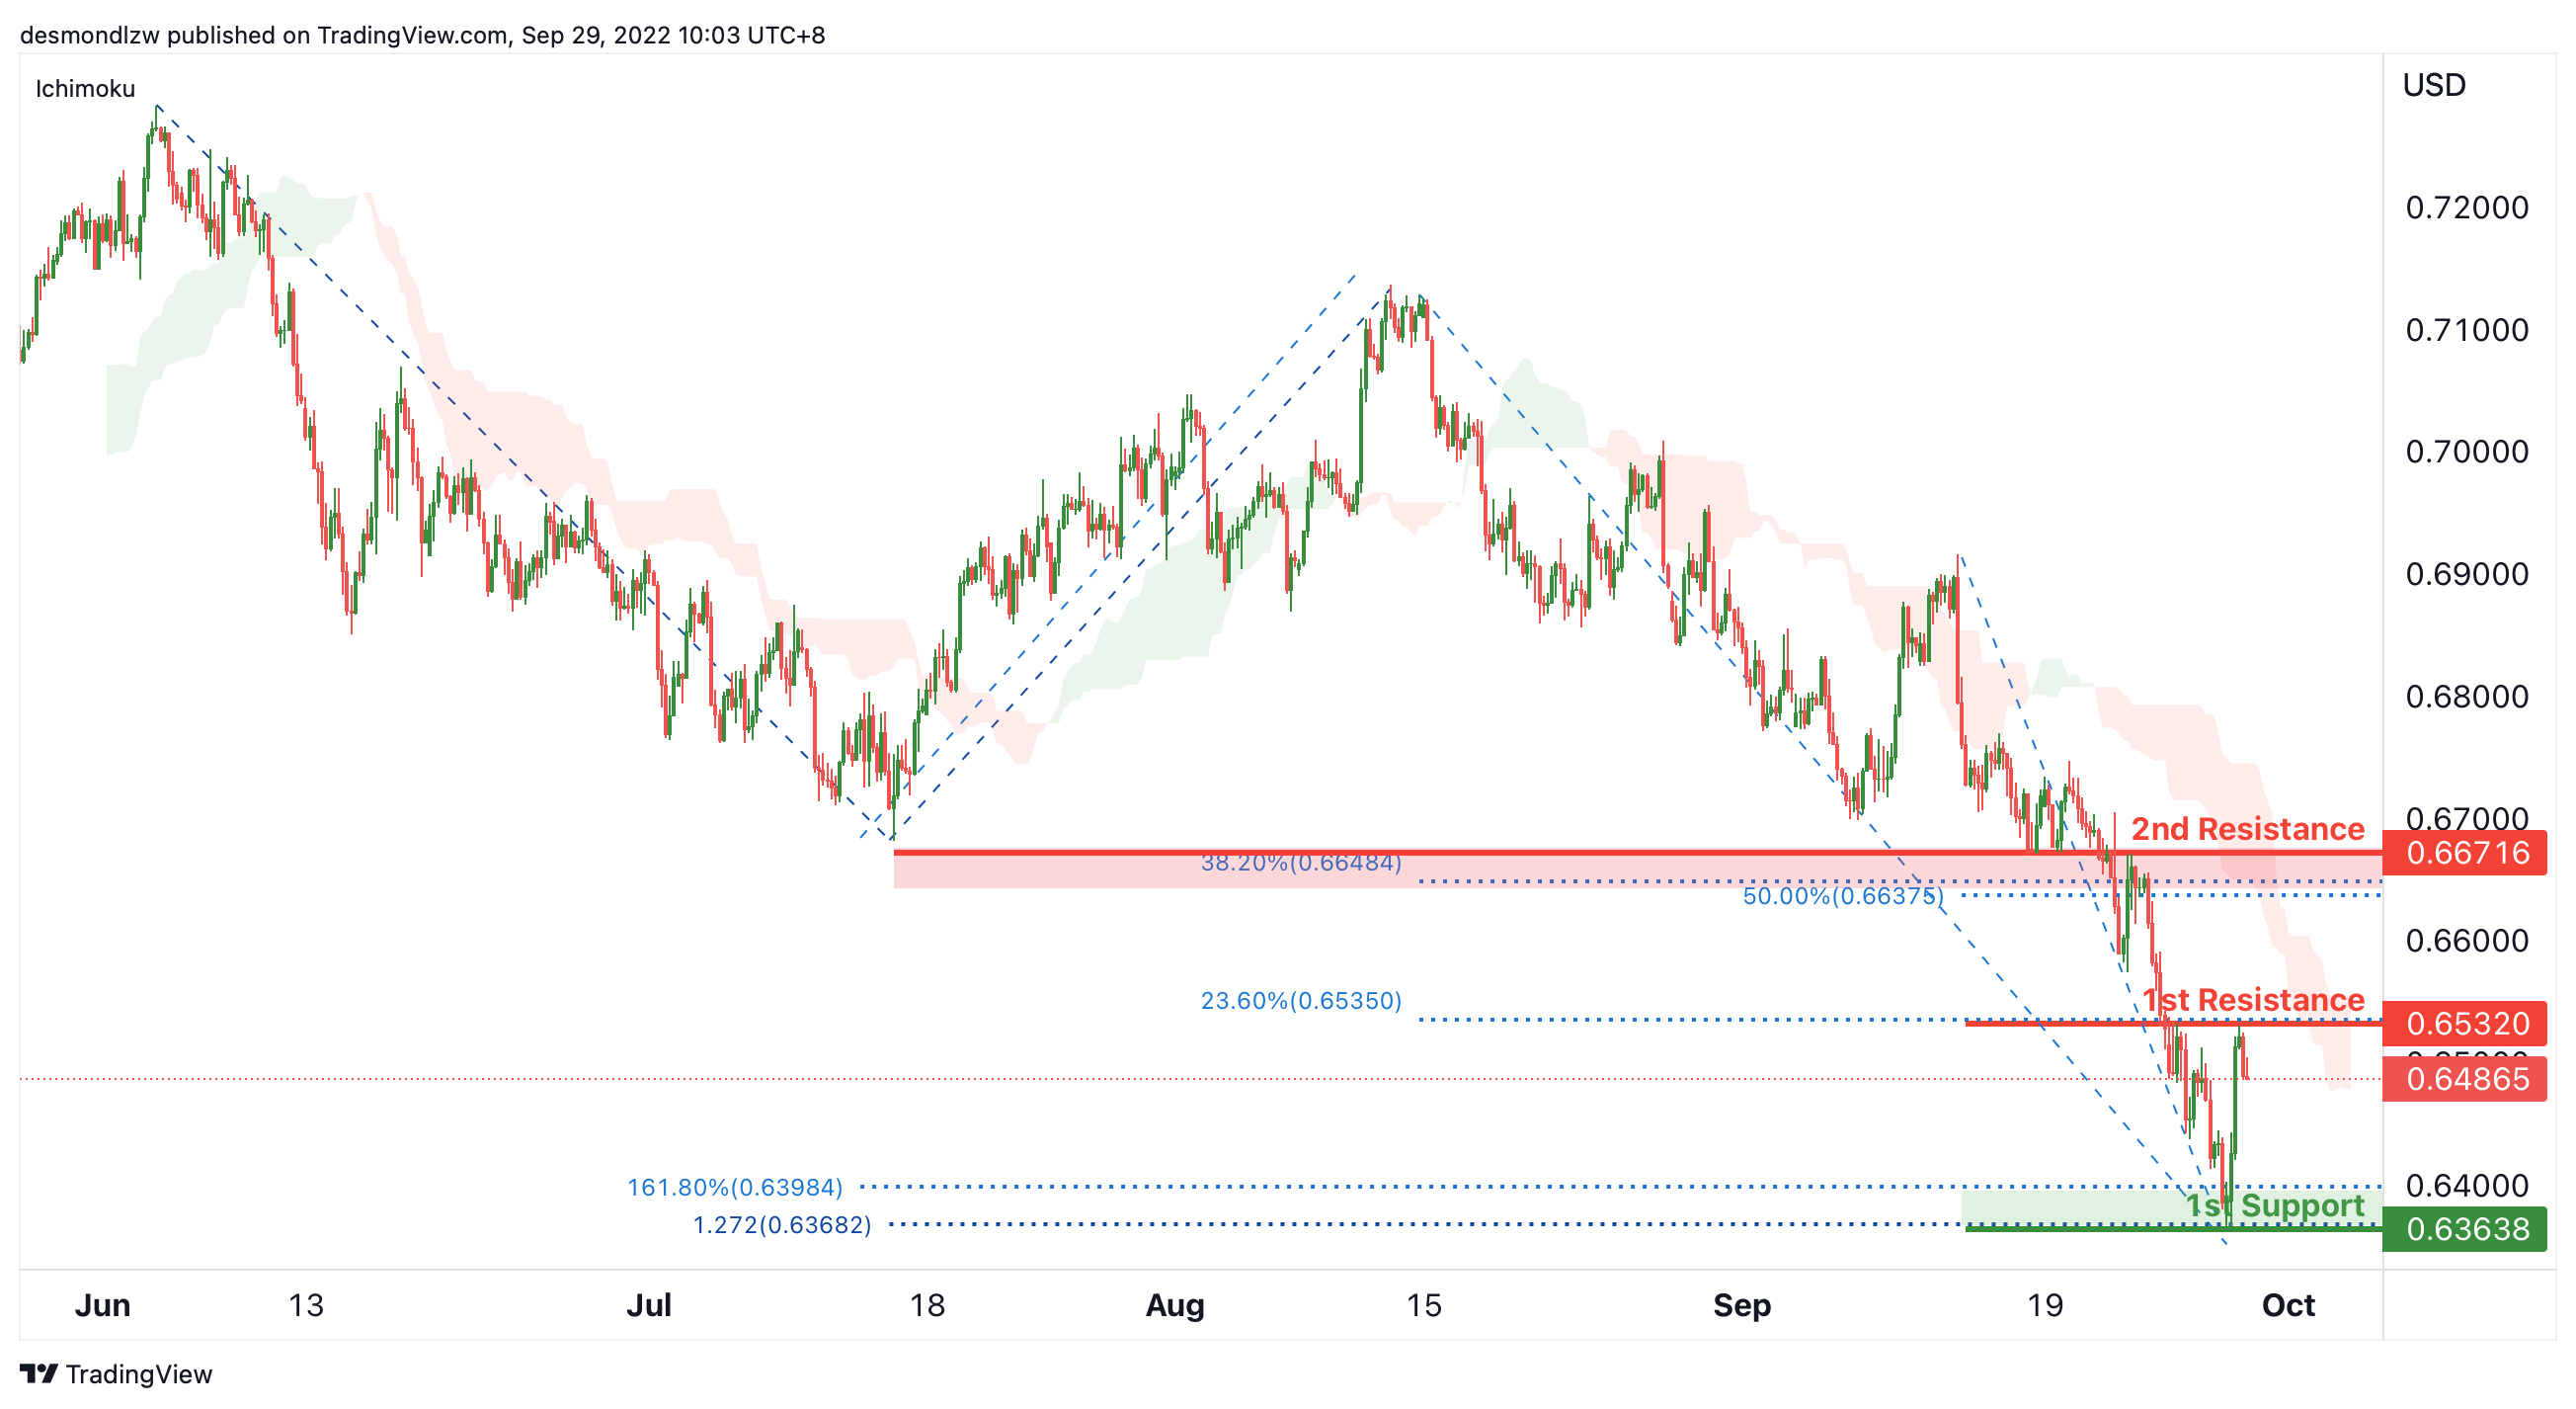
AUD/USD:
On the H4, the price is moving in a strong bearish trend. To add on confluence to this bias, price is below the Ichimoku cloud which indicates a bear market. Currently, the price is testing the 1st resistance at 0.65320, which is in line with the 23.6% fibonacci retracement. The price may drop from here to the 1st support at 0.63638, which is in line with the swing low, 161.8% fibonacci extension and 127.2% fibonacci projection. Alternatively, the price may rise to the 2nd resistance at 0.66716, where the pullback resistance, 50% and 38.2% fibonacci retracement are.
Areas of consideration
- H4, 1st resistance at 0.65320
- H4, 1st support at 0.63638
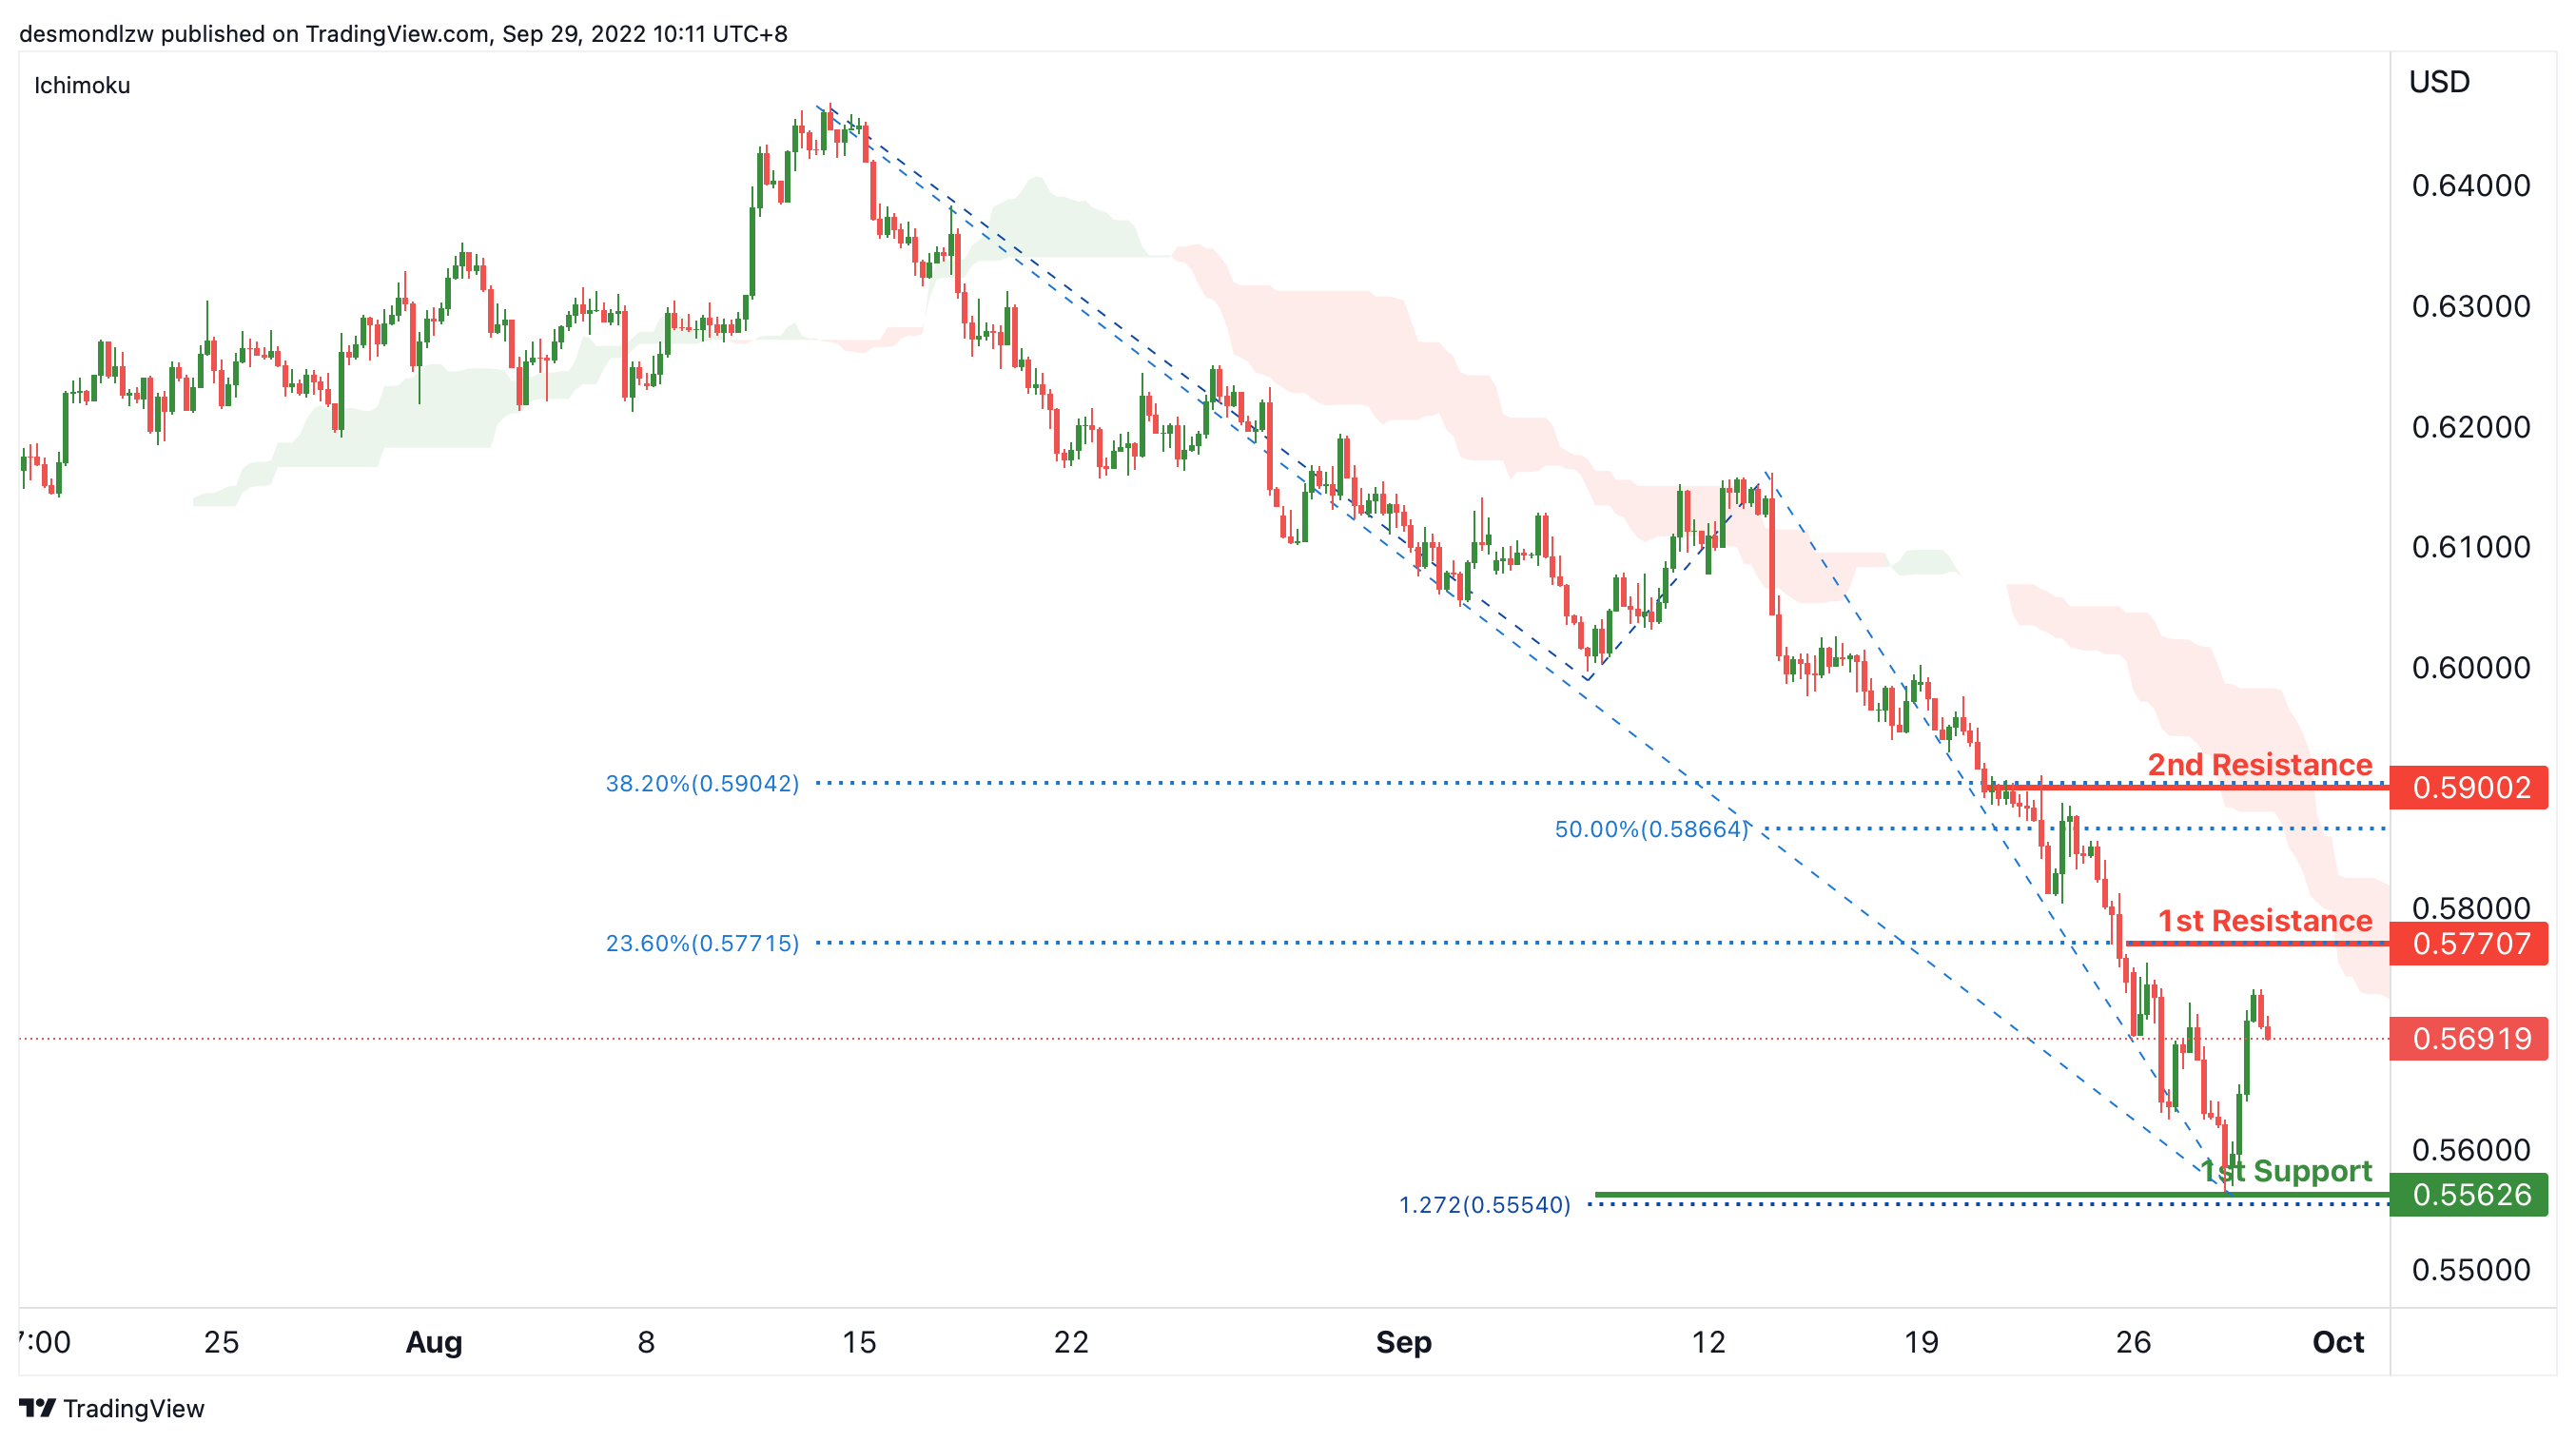
NZD/USD:
On the H4, with the price moving below the ichimoku cloud, we maintain a bearish bias that the price may test the 1st resistance at 0.57707, which is in line with the 23.6% fibonacci retracement and then drop to the 1st support at 0.55626, where the swing low and 127.2% fibonacci projection are. Alternatively, the price may break the 1st resistance and rise to the 2nd resistance at 0.59002, where the 38.2% and 50% fibonacci retracement are.
Areas of consideration:
- H4 time frame, 1st resistance at 0.57707
- H4 time frame, 1st support at 0.55626
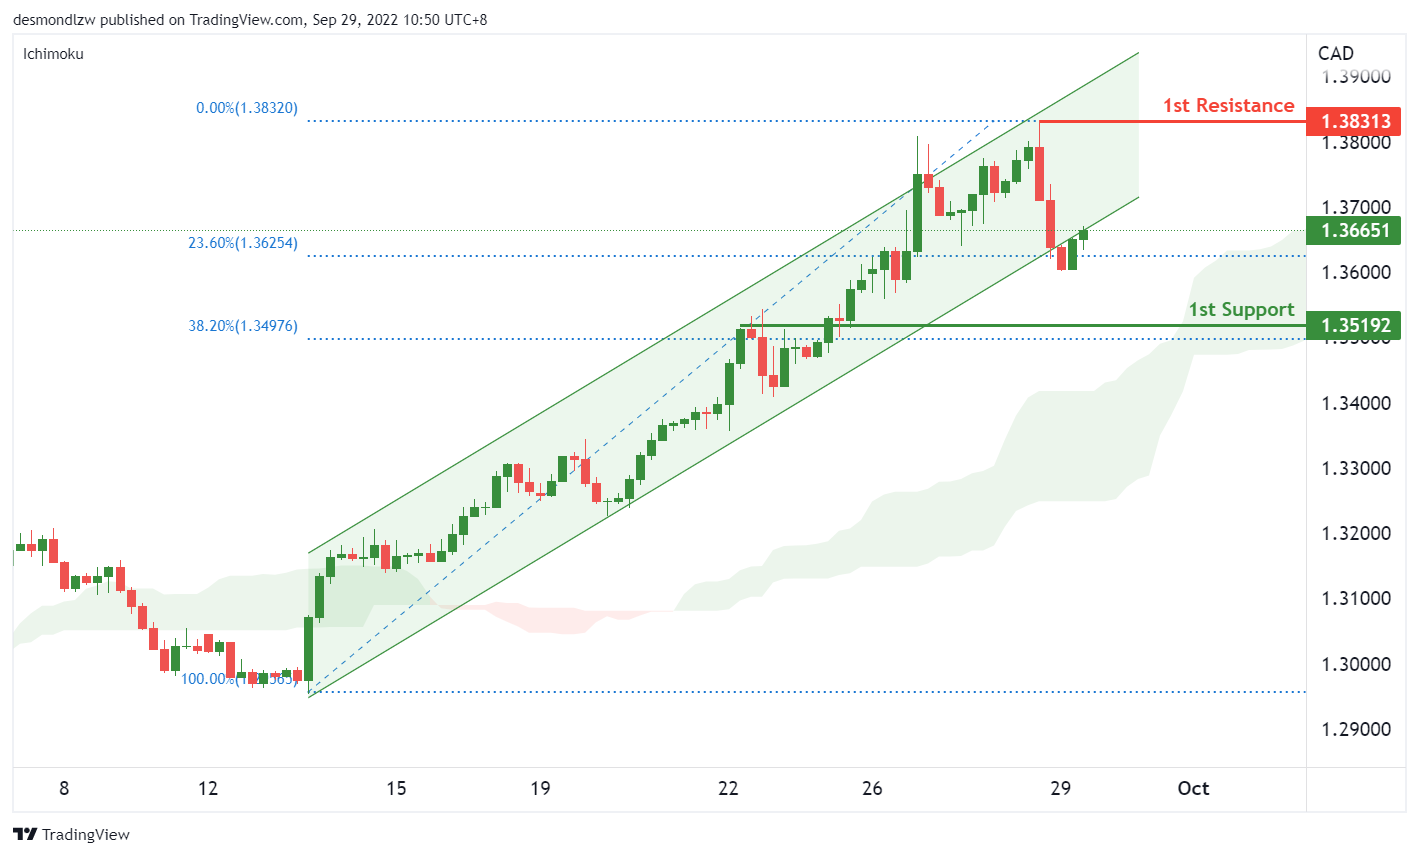
USD/CAD:
On the H4, the price broke out of the ascending channel but maintains above the ichimoku cloud. We continue to have a bullish bias that price may rise to the 1st resistance at 1.3831, previous swing major swing high. Currently price is at the 23.60% retracement level which could form a good intermediate support level to trigger the next move up to our resistance level.
Areas of consideration:
- H4 time frame, 1st resistance at 1.3831
- H4 time frame, 1st support at 1.3519
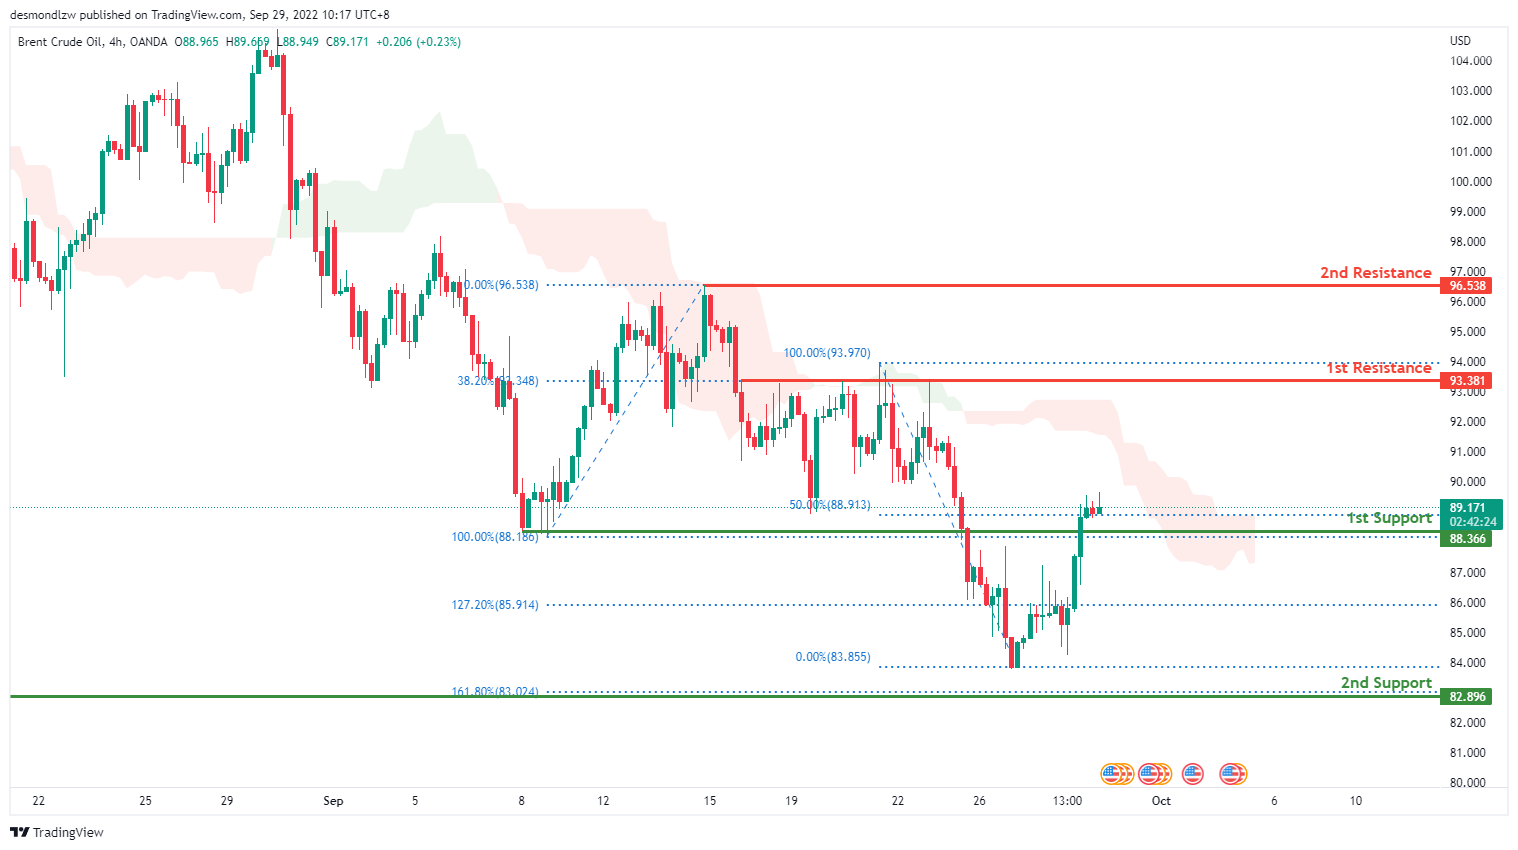
OIL:
On the H4, oil is on a bearish trend and to add confluence to this, the price is below the ichimoku cloud which indicates a bear market. However, Price has broken back up the 1st support at 85.380 where the 100% Fibonacci extension lies. Expect price to possibly go to the 1st resistance at 93.381 where the 38.2% Fibonacci extension line is.
Areas of consideration:
- H4 time frame, 1st resistance at 93.381
- H4 time frame, 1st support at 88.366
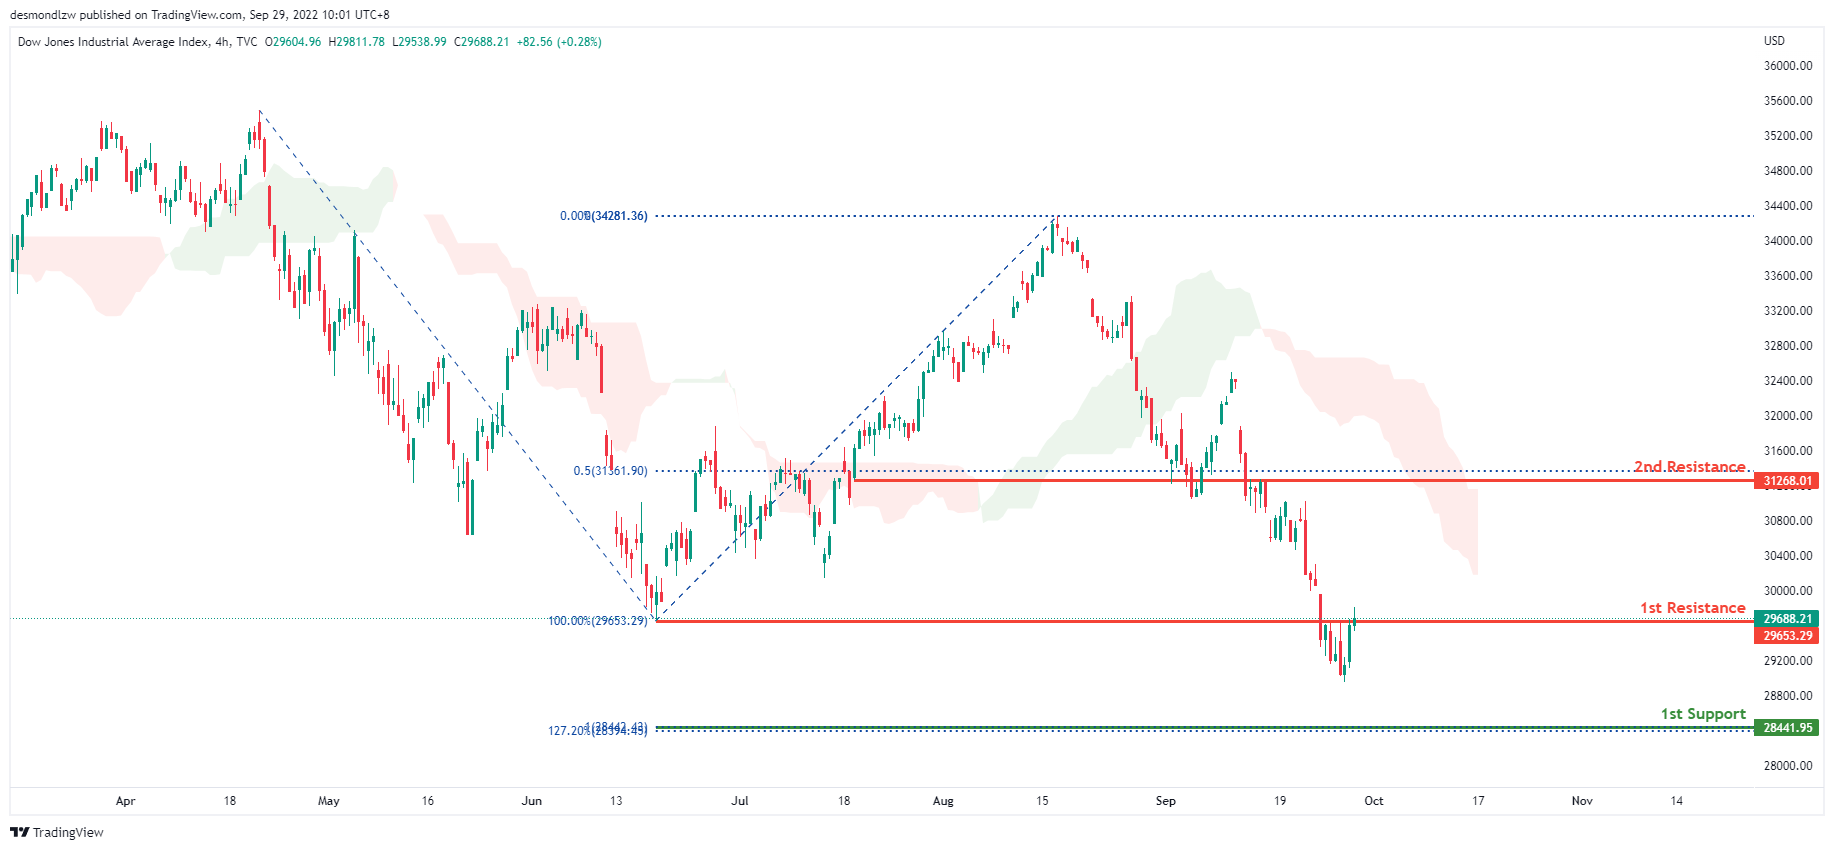
Dow Jones Industrial Average:
On the H4, price is on a very bearish trend. To add confluence to this, price is below the ichimoku cloud which indicates a bearish market. Price has also broke through and close back up the 1st support at 29653.29, where the 100% Fibonacci line and previous swing low lies. Since price has broken back above the 1st support , expect price to possibly head back up towards the 1st resistance at 31268.01 where the 50% Fibonacci line is.
Areas of consideration:
- H4 time frame, 1st support at 29653.29
- H4 time frame, 1st resistance at 31268.01
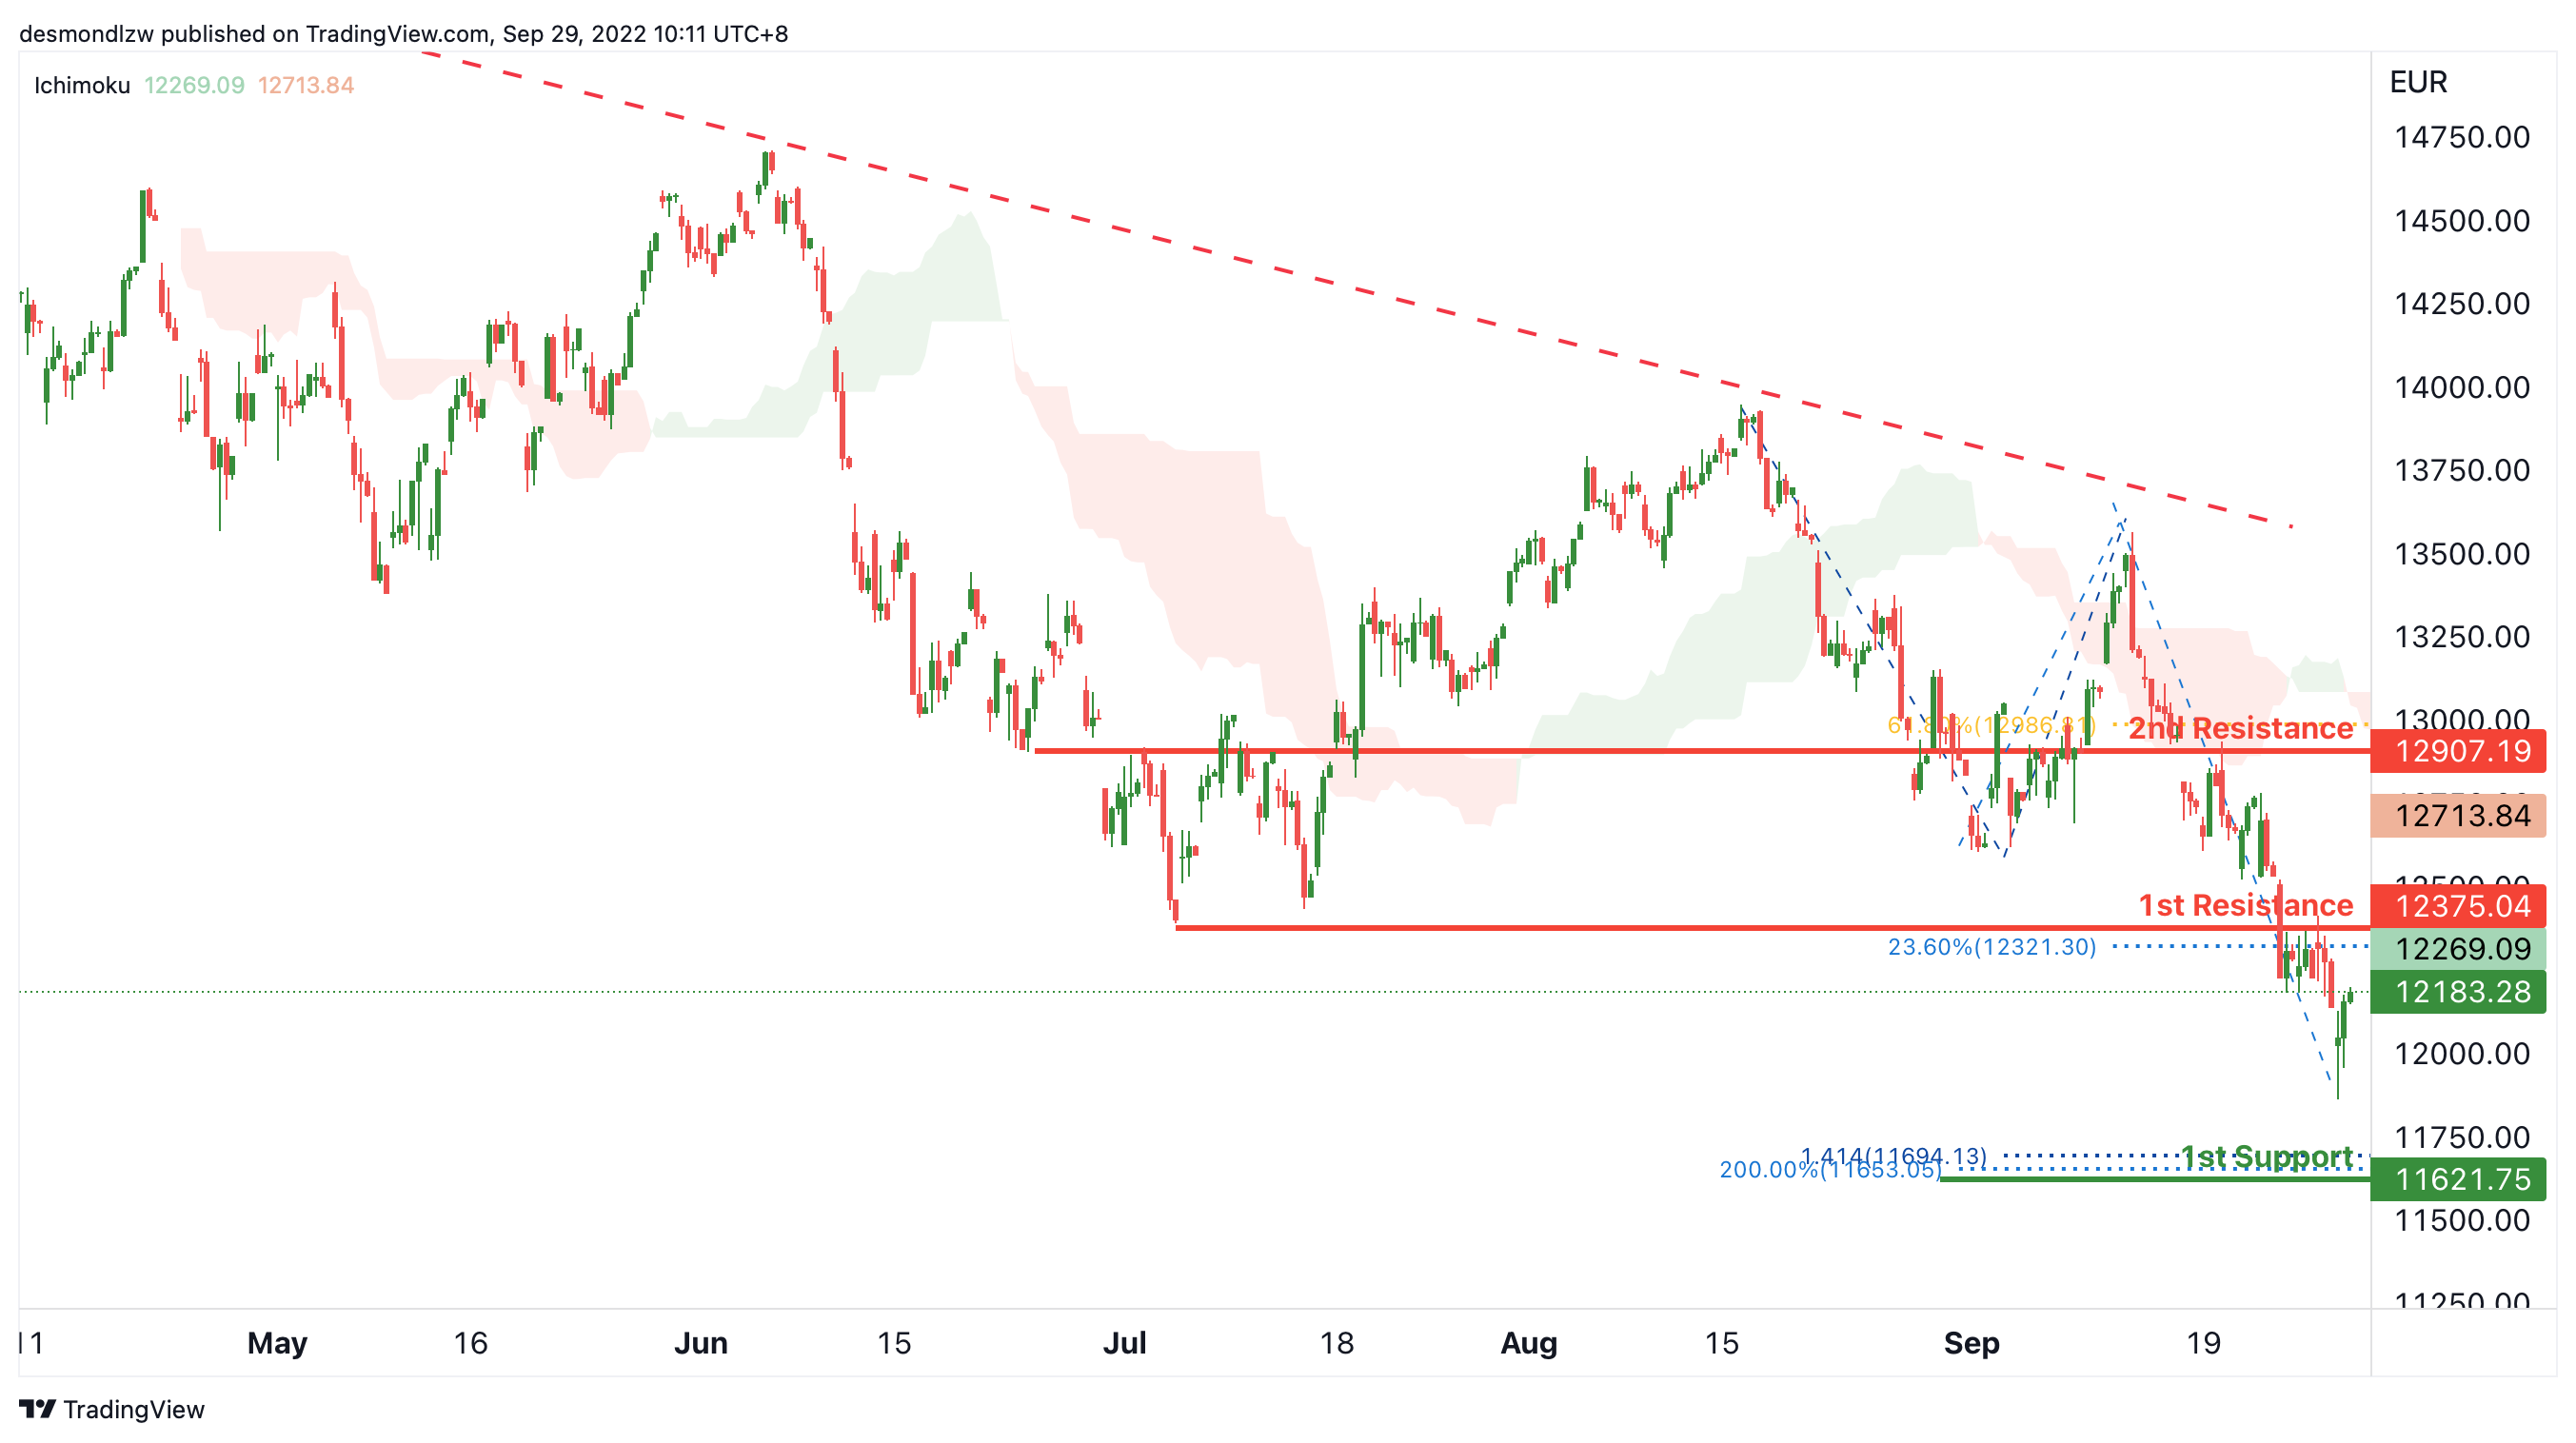
DAX:
On the H4, with the price moving below the descending trendline and below ichimoku cloud, we have a bearish bias that the price may test the 1st resistance at 12375.04, which is in line with the overlap resistance and 23.6% fibonacci retracement and drop to the 1st support at 11621.75, where the 141.4% fibonacci projection and 200% fibonacci projection are. Alternatively, the price may rise to the 2nd resistance at 12907.19, where the 61.8% fibonacci retracement is.
Areas of consideration:
- H4 time frame, 1st resistance at 12375.04
- H4 time frame, 1st support at 11621.75
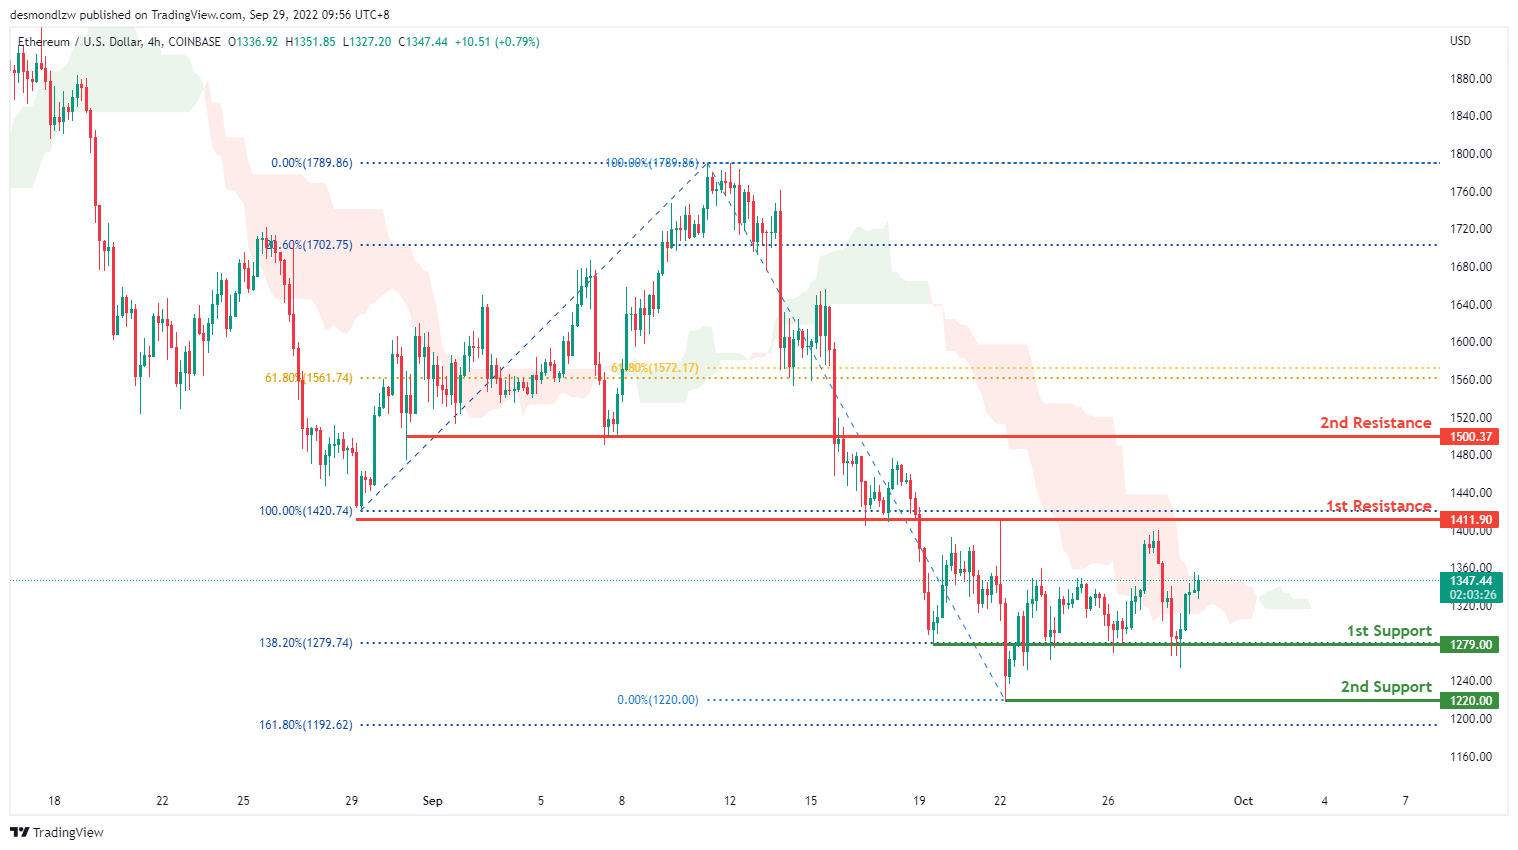
ETHUSD:
On the H4, overall price is very bearish on ETHUSD. Price has reflected off the 1st support at 1279.74 where the 138.2% Fibonacci line lies 6 times which indicates that the 1st support is a very strong level. Watching for price to head back up and potentially break through the 1st resistance at 1411.9 where the 100% Fibonacci line and previous swing low is.
Areas of consideration:
- H4 time frame, 1st resistance of 1411.90
- H4 time frame, 1st support at 1279.00
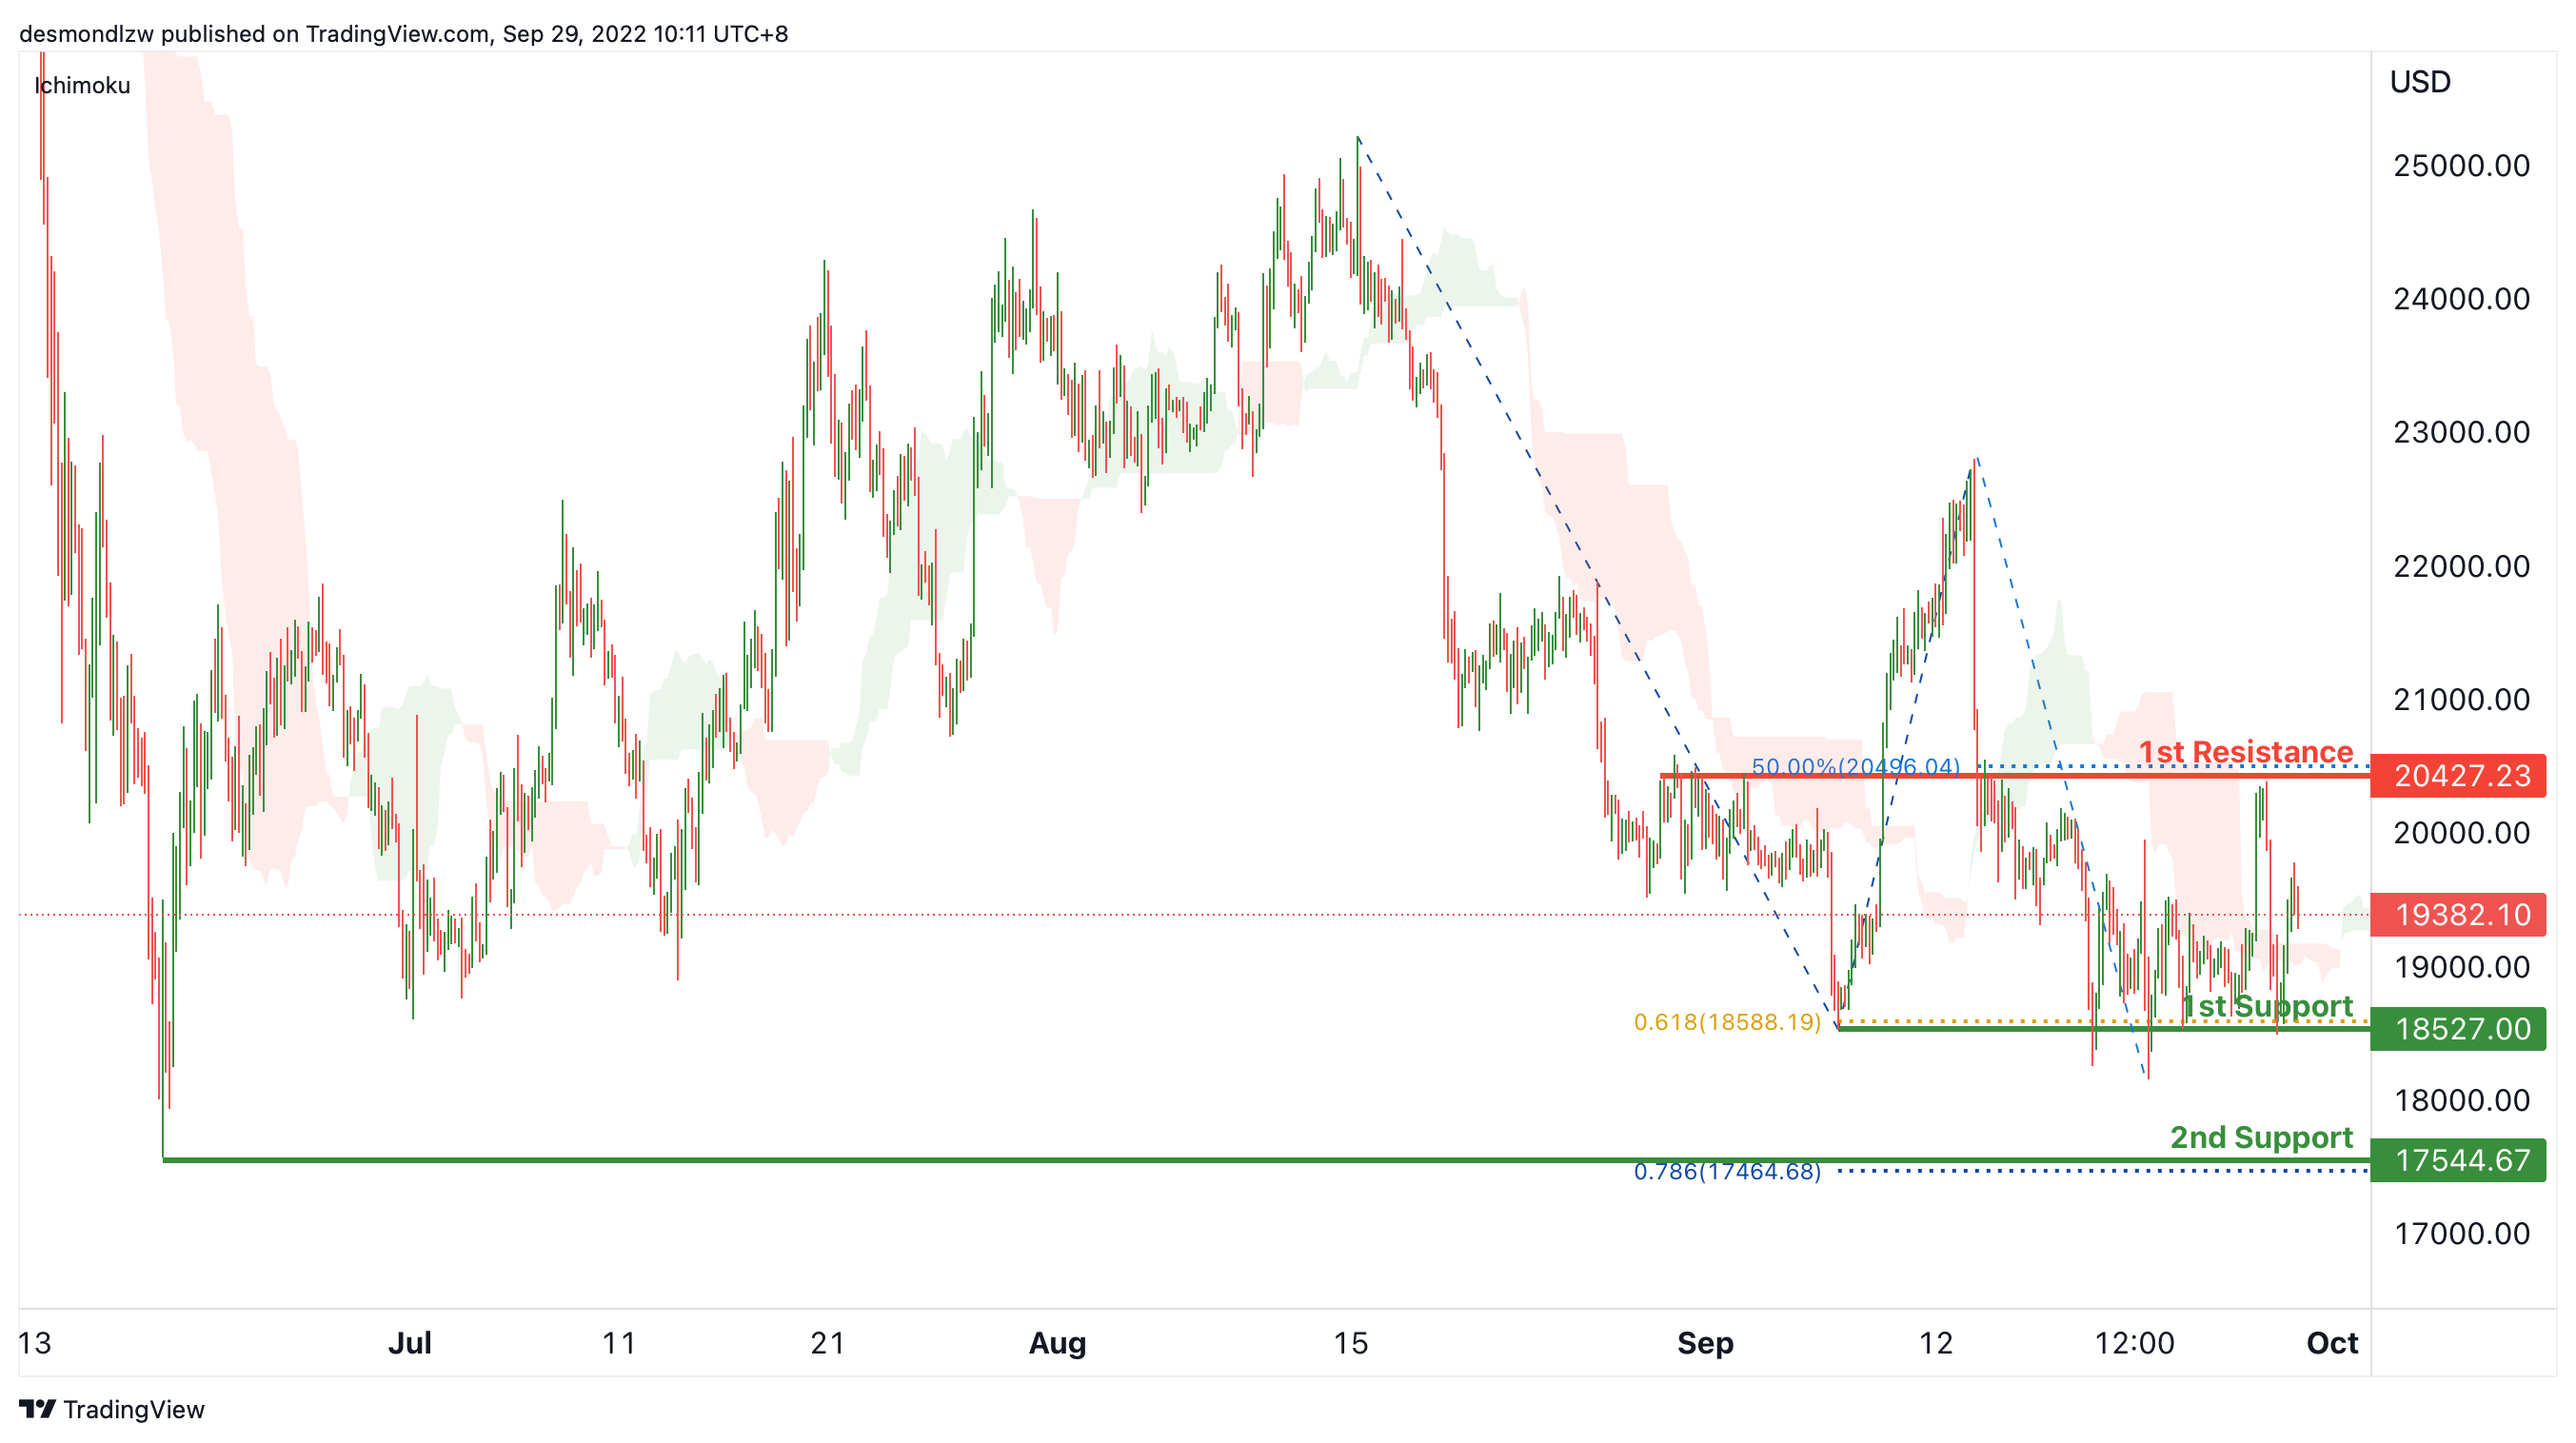
BTCUSD:
On the H4, price reversing from the 1st support and crossing the ichimoku cloud, we have a bullish bias that the price may test the 1st resistance at 20427.23, where the overlap resistance and 50% fibonacci retracement are. After testing the 1st resistance, the price may drop to the 1st support at 18527, which is in line with the swing lows and 61.8% fibonacci projection. If the 1st support is broken, the 2nd support could be at 17544.67, which is in line with the 78.6% fibonacci projection and swing low.
Areas of consideration:
- H4 time frame, 1st resistance at 20427.23
- H4 time frame, 1st support at 18527
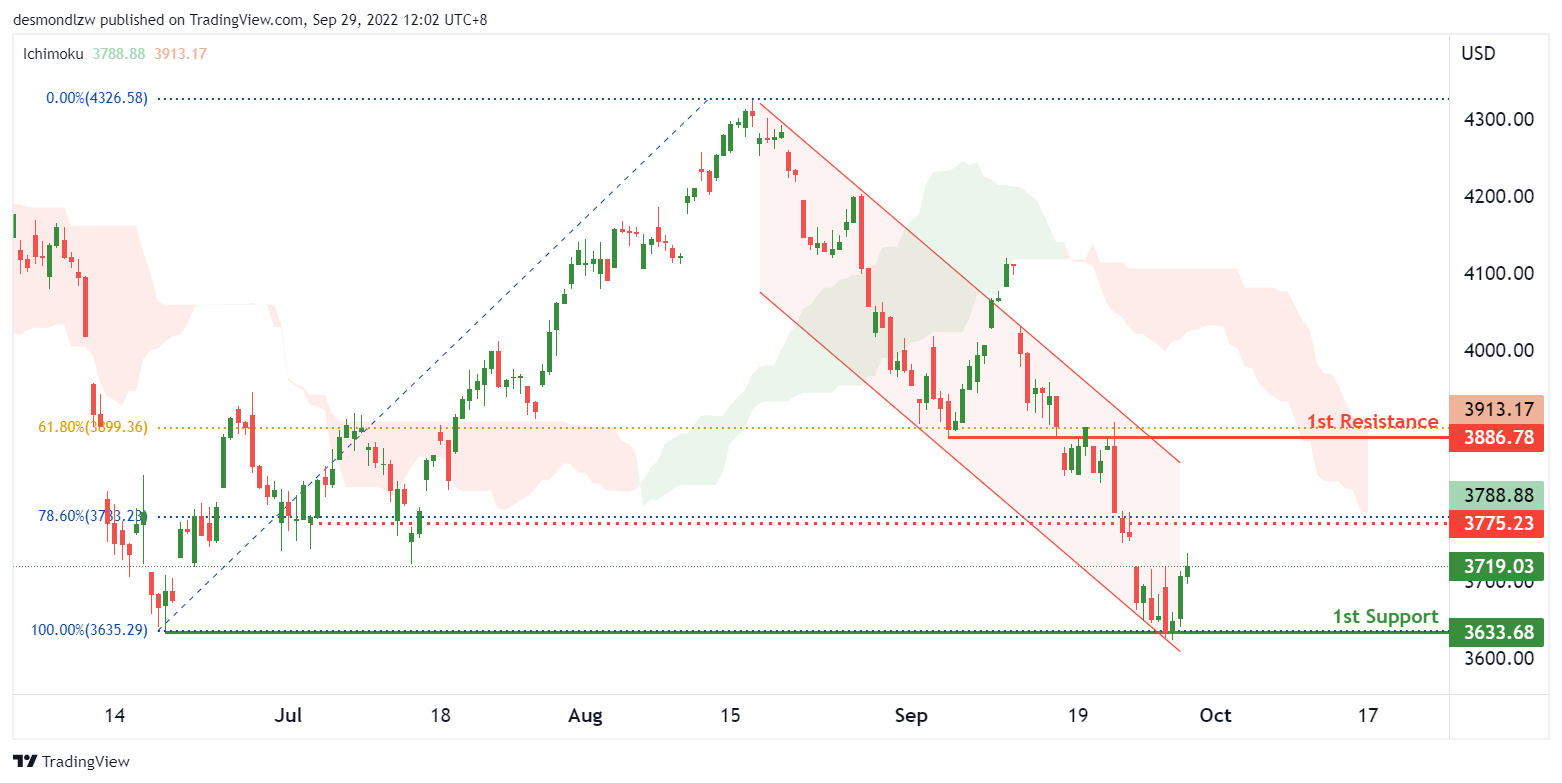
S&P 500:
On the H4, with the price within a descending channel and below the ichimoku cloud, we continue to have a bearish bias. However, with the price bouncing off the 1st support of 3633, which is in line with the previous swing low of June 2022, we could see price testing the 3775 intermediate level before testing the 1st support again.
Areas of consideration:
- H4 time frame, 1st resistance at 3886
- H4 time frame, 1st support at 3633
The accuracy, completeness and timeliness of the information contained on this site cannot be guaranteed. IC Markets does not warranty, guarantee or make any representations, or assume any liability regarding financial results based on the use of the information in the site.
News, views, opinions, recommendations and other information obtained from sources outside of www.icmarkets.com.au, used in this site are believed to be reliable, but we cannot guarantee their accuracy or completeness. All such information is subject to change at any time without notice. IC Markets assumes no responsibility for the content of any linked site.
The fact that such links may exist does not indicate approval or endorsement of any material contained on any linked site. IC Markets is not liable for any harm caused by the transmission, through accessing the services or information on this site, of a computer virus, or other computer code or programming device that might be used to access, delete, damage, disable, disrupt or otherwise impede in any manner, the operation of the site or of any user’s software, hardware, data or property.