
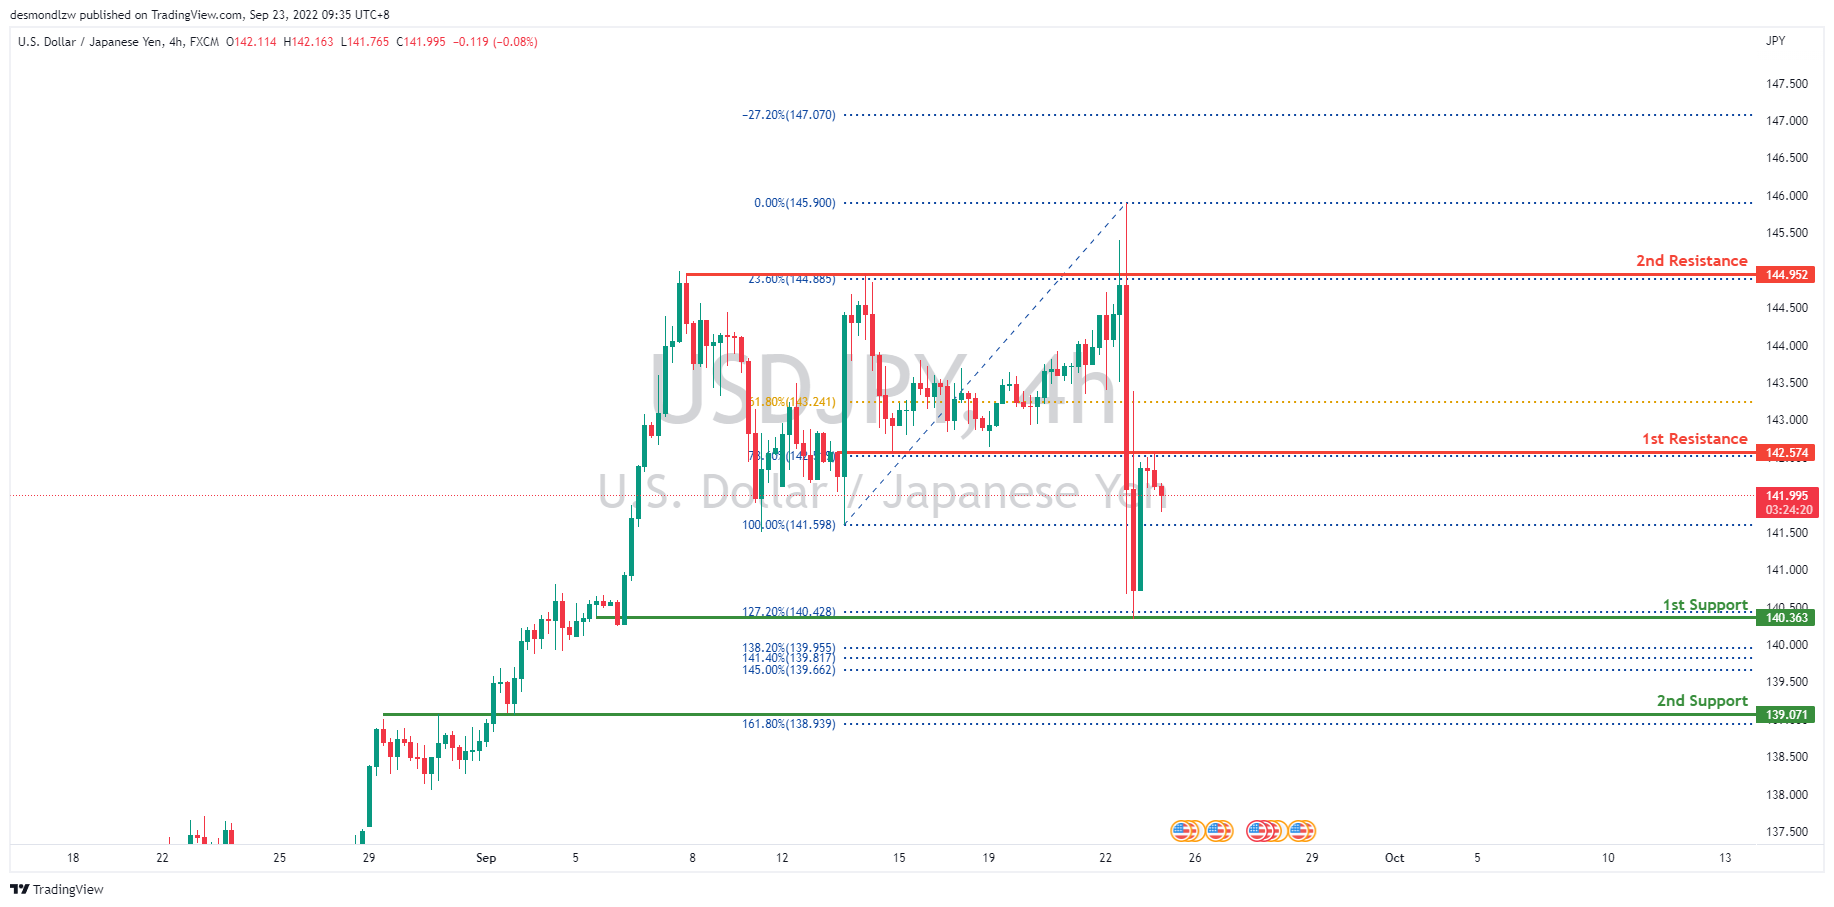
USD/JPY:
On the H4 chart, price has reflected off the 1st support at 140.363 and back up to the 1st resistance at 142.574 where the 78.6% Fibonacci line is. Price might possibly reflect off it and head back down towards the 1st support. Price could also possibly break past up the 1st resistance and head up towards the 2nd resistance at 144.952 where the 24.6% Fibonacci line lies.
Areas of consideration:
- H4 time frame, 1st resistance at 142.574
- H4 time frame, 1st support at 140.363
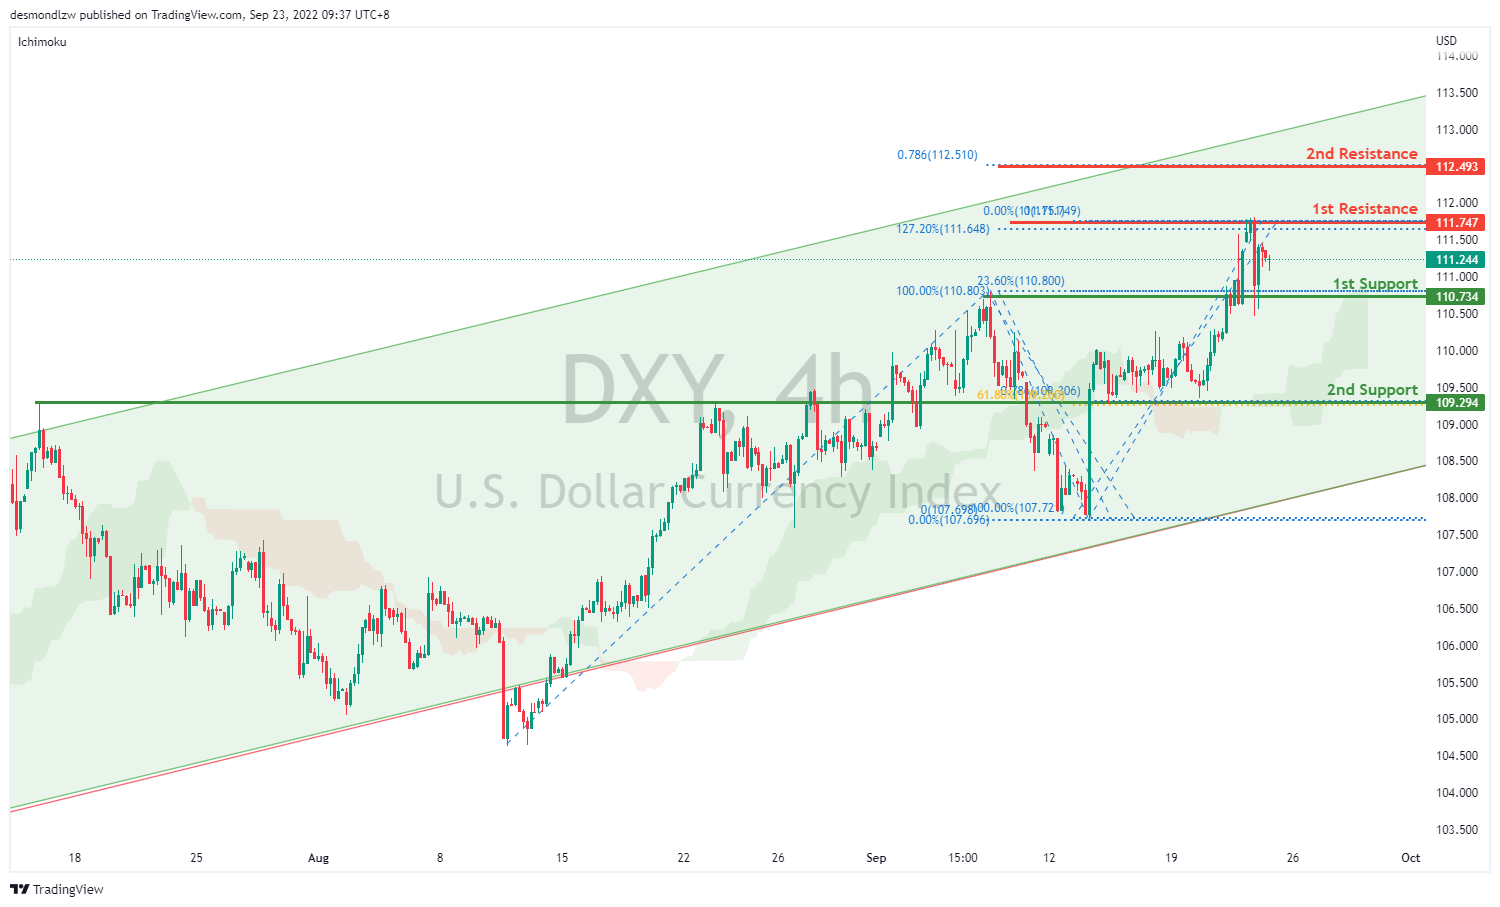
DXY:
On the H4, price is still respecting the bullish channel and has failed to break the first support- we are bullish bias. Price has broken the previous high to test at the first resistance at 111.747 where the 127.2% extension sits. If bullish momentum continues, it should bring price toward the second resistance at 112.493 where the 78.6% projection sits. Alternatively, it could pull back to test the first support at 110.734 where the 23.6% retracement and previous swing high sits then the second support at 109.294 where the 78.6% projection,61.8% retracement and overlap support sits
Areas of consideration:
- H4 time frame, 1st resistance at 111.747
- H4 time frame, 1st support at 110.734
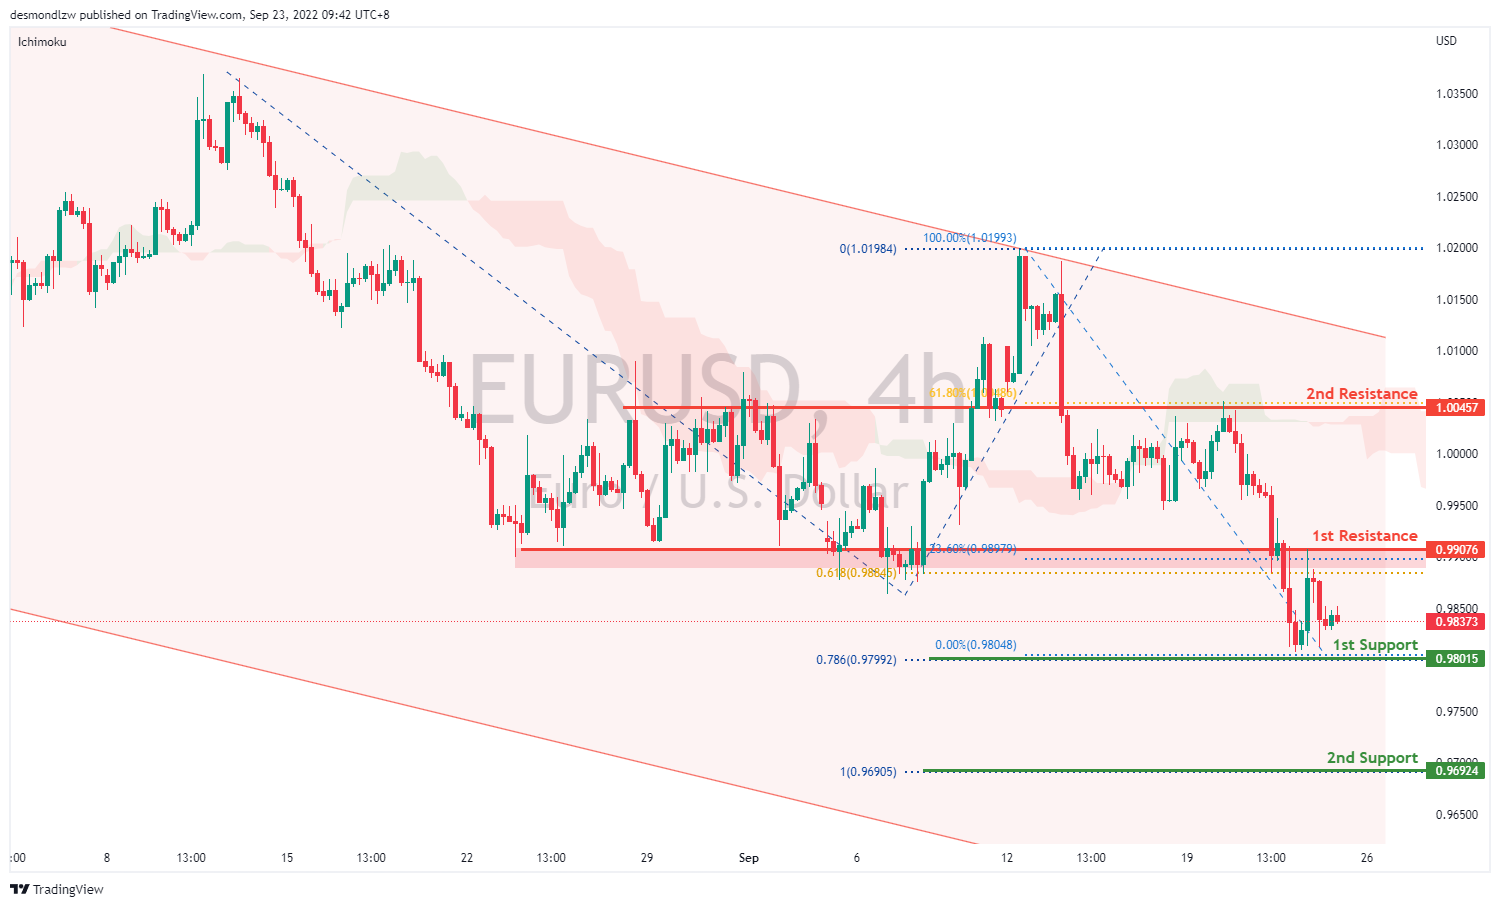
EUR/USD:
On the H4, price is moving within the channel in a descending manner- we are bearish biased. Price has bounced off the first resistance and it looks like it’s moving to test 0.9801 where the 78.6% projection sits. If price breaks this level, it will bring prices to the second support at 0.9692 where the 100% projection sits. Alternatively it could pull back to test the first resistance again at 0.9907 level where the 23.6% retracement, 61.8% projection and previous swing low sits then to the second resistance at 1.0045 where the 61.8% retracement and previous swing high sits.
Areas of consideration :
- H4 1st resistance at 0.9907
- H4 1st support at 0.9801
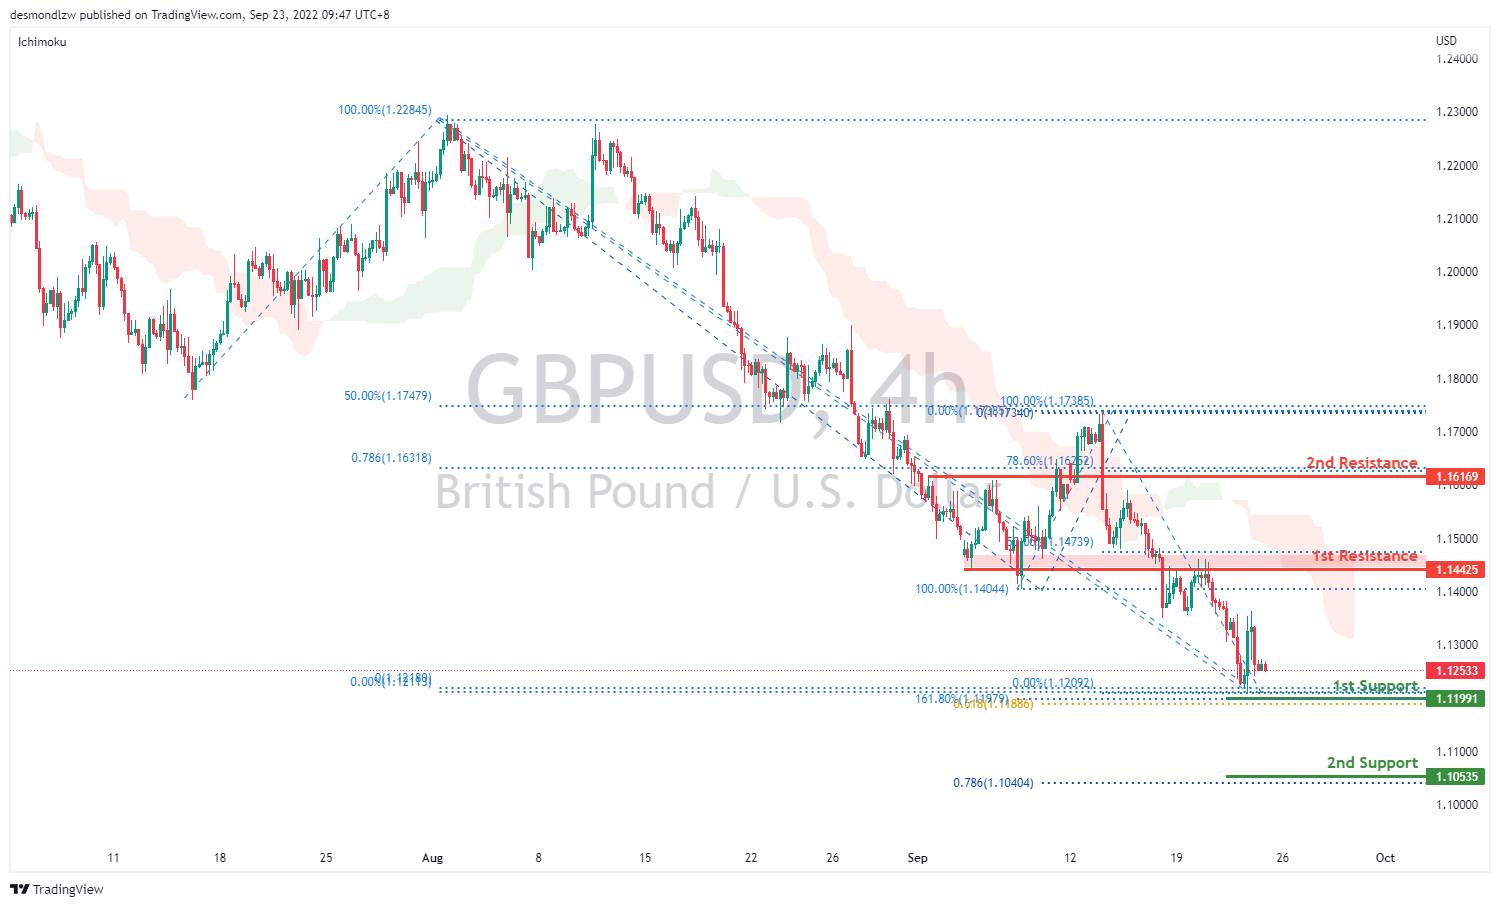
GBP/USD:
On the H4, prices are still moving in a bearish momentum hence we are bearish biassed. If bearish momentum continues, it should test the first support at 1.1199 levels where the 61.8% projection and 161.8% extension sits then the second support at 1.1053 where the 78.6% projection sits. Alternatively, price could pull back to test the first resistance at 1.1442 where the 50% retracement and overlapping resistance sits then the second resistance at 1.1616 where the 78.6% retracement, 78.6% projection and previous swing high sits
Areas of consideration:
- H4 1st resistance at 1.1442
- H4 1st support at 1.1199
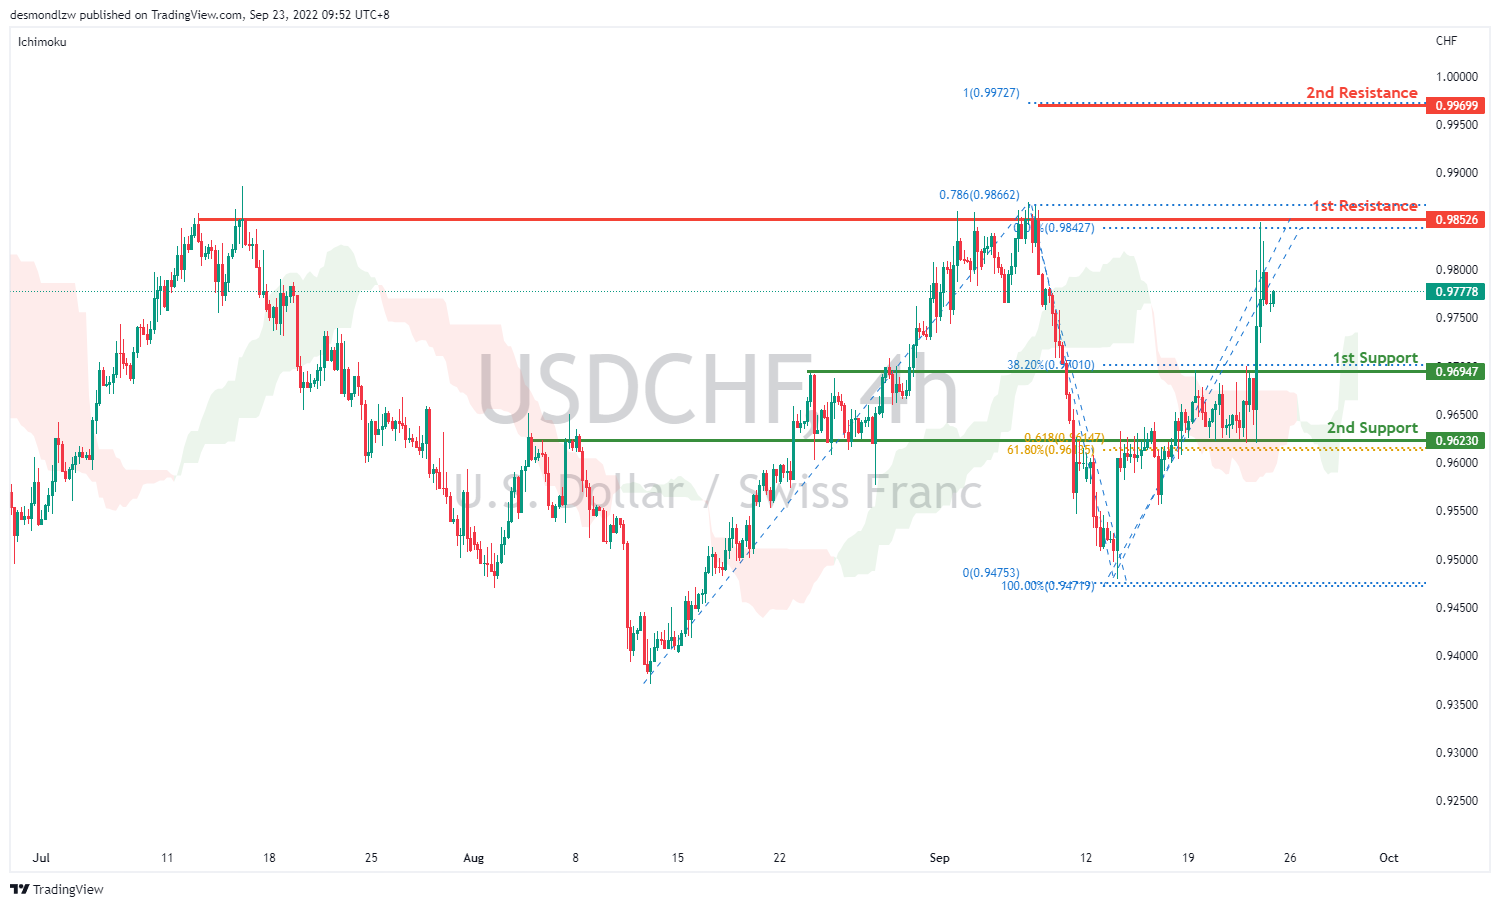
USD/CHF:
On the H4, prices have broken the descending channel and we are currently bullish biased. Price has broken the first support and is moving toward the first resistance at 0.9852 where the 78.6% projection and previous swing high sits. If bullish momentum continues, it should bring price to the second resistance at 0.9969 where the swing high and 100% projection sits. Alternatively, price could pull back to test the first support at 0.9694 where the 38.2% retracement and overlapping resistance sits. If it breaks the first support, it should bring price to the second support at 0.9623 where the 61.8% projection and 61.8% retracement sits.
Areas of consideration
- H4 1st support at 0.9694
- H4 1st resistance at 0.9852
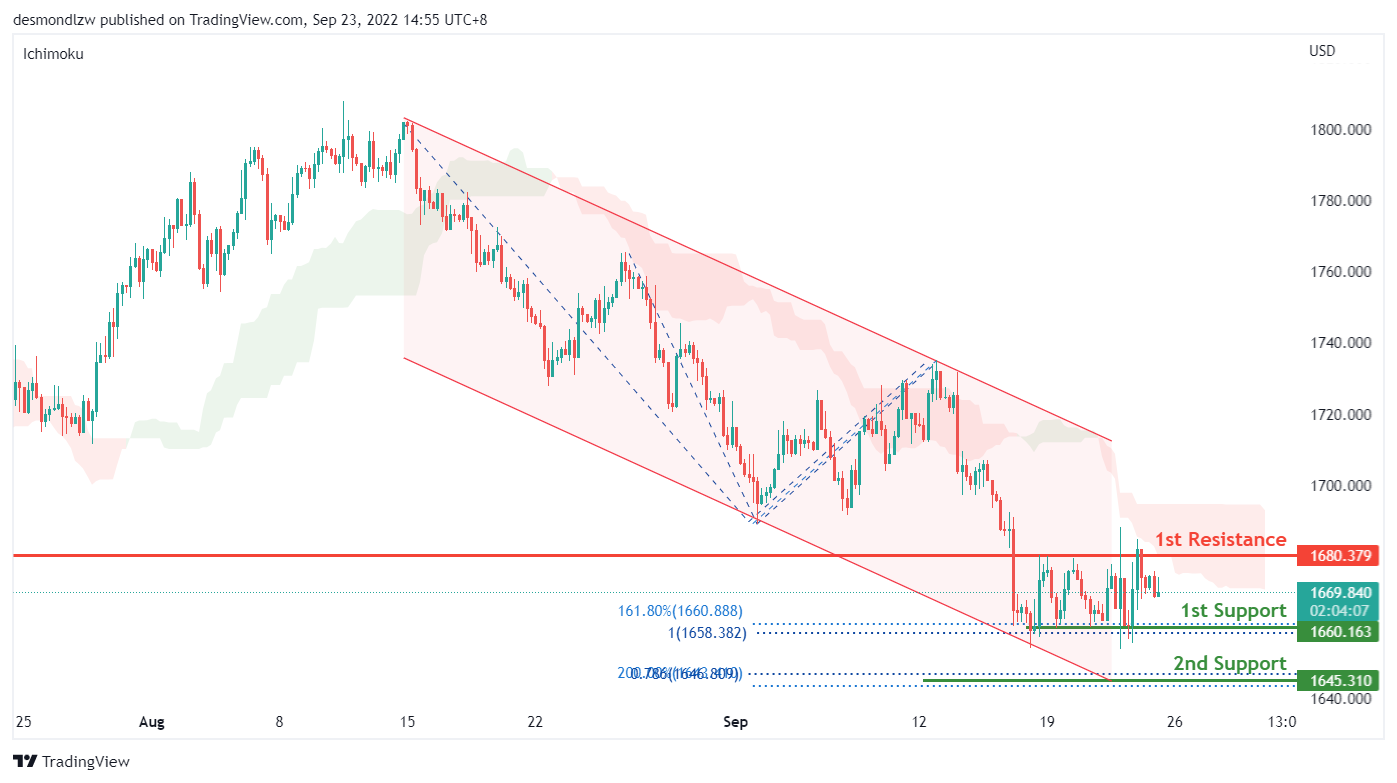
XAU/USD (GOLD):
On the H4, with the price moving within the descending channel and below ichimoku cloud, we have a bearish bias that price may drop to the 1st support of 1660, which is in line with the 161.80% fibonacci extension and 100% fibonacci projection. Alternatively, the price may test the 1st resistance at 1680, which is in line with the overlap resistance and 38.2% fibonacci retracement.
Areas of consideration:
- H4 time frame, 1st resistance at 1680
- H4 time frame, 1st support at 1660
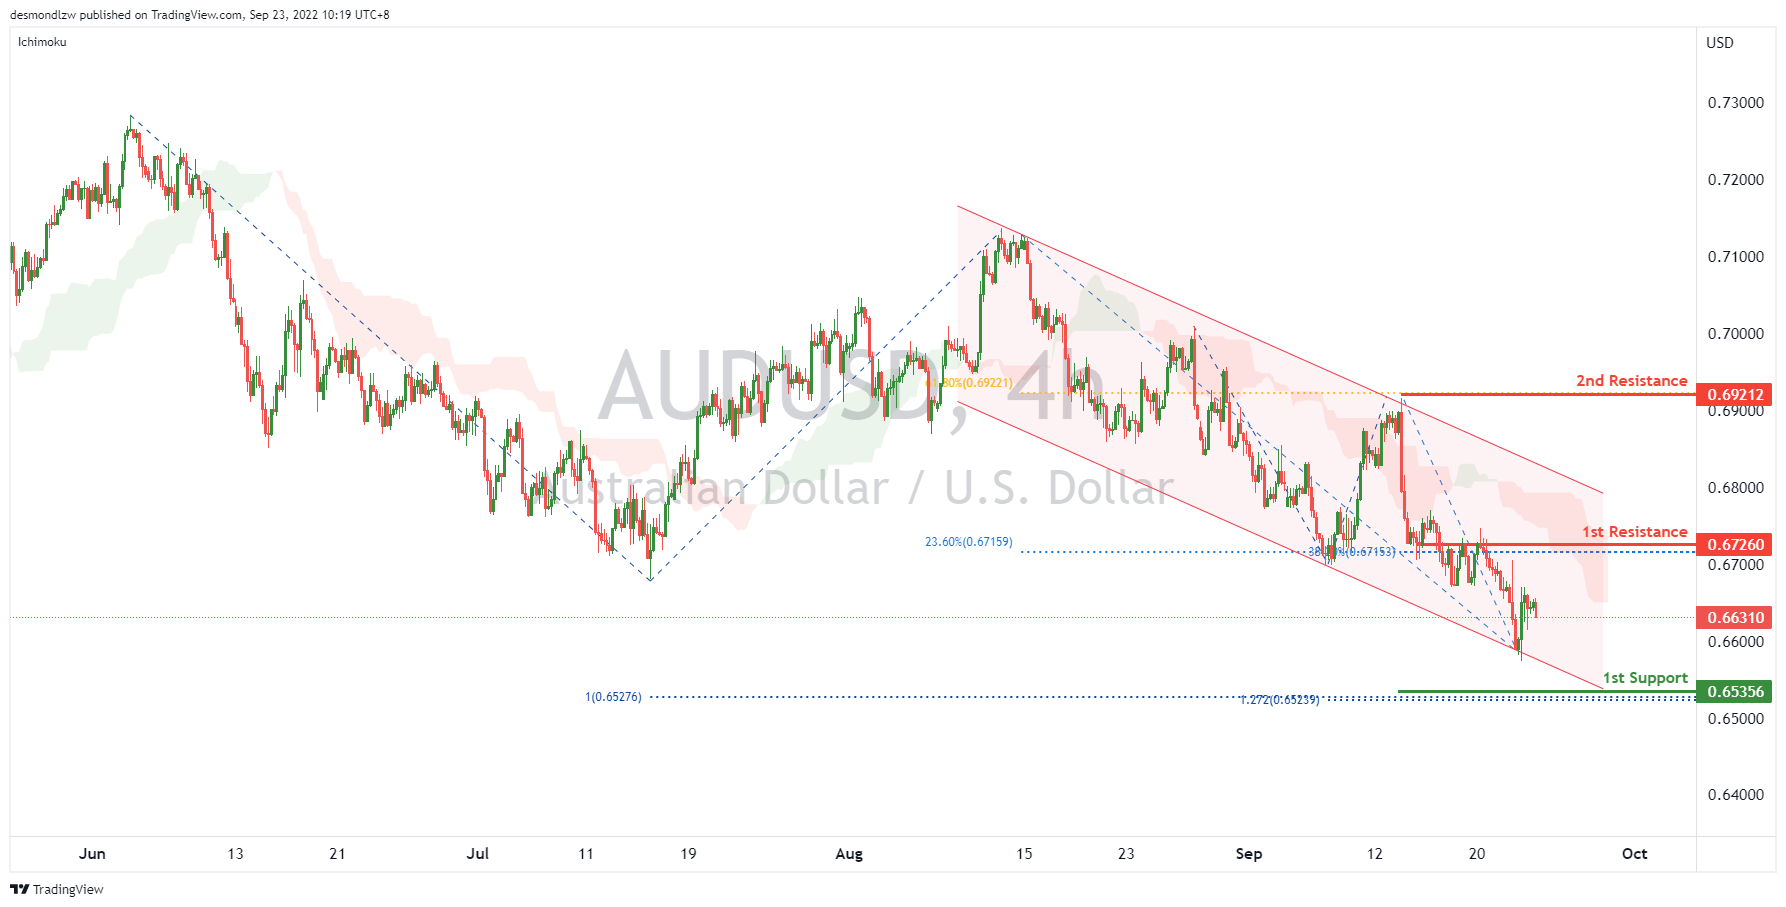
AUD/USD:
On the H4, with the price moving within the descending channel and reversing from the lower bound, we can expect the price to pull back to the 1st resistance at 0.67260, where the 23.6% fibonacci retracement and 38.2% fibonacci retracement are. If the 1st resistance is broken, the 2nd resistance could be at 0.69212, which is in line with the 61.8% fibonacci retracement. Alternatively, the price may drop to the 1st support at 0.65356, which is in line with the 127.2% fibonacci extension and 100% fibonacci projections.
Areas of consideration
- H4, current price
- H4, 1st resistance at 0.67260
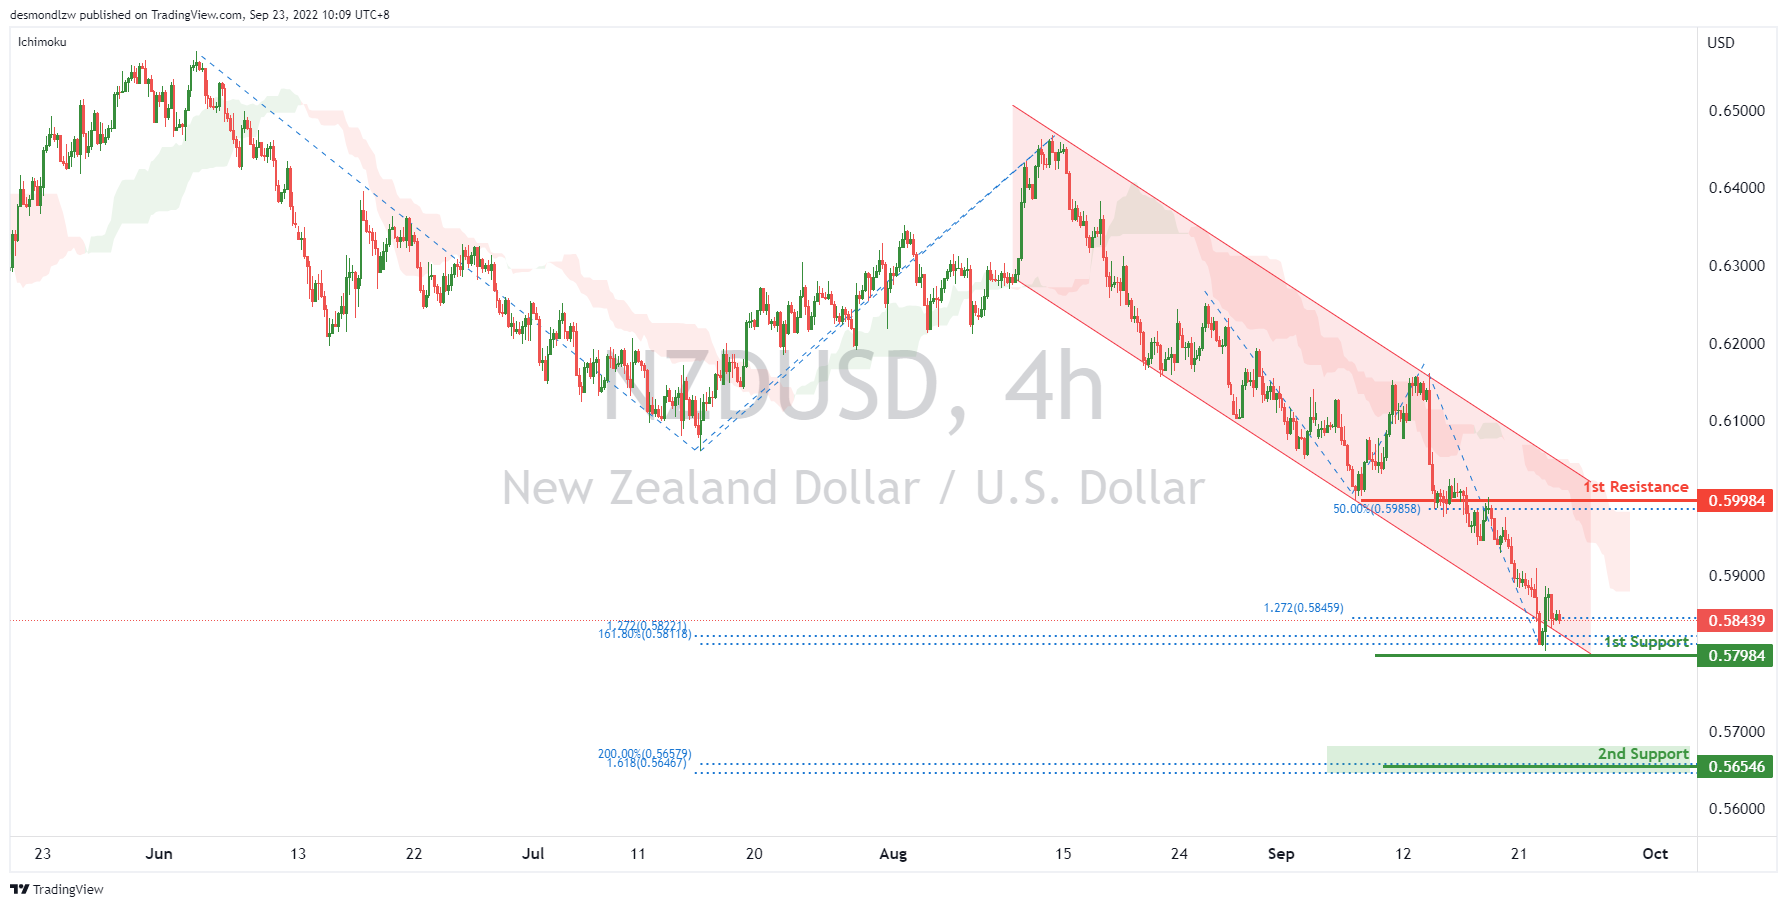
NZD/USD:
On the H4, with the price moving within the descending channel, below ichimoku cloud, If the price can break the 1st support at 0.57984, which is in line with the 78.6% fibonacci projection, 161.8% fibonacci extension, 127.2% fibonacci extensions successfully, we can expect the price drop to the 2nd support at 0.56546, which is in line with the 200% fibonacci extension and 161.8% fibonacci extension. Alternatively, the price may pull back to the 1st resistance at 0.59984, where the 50% fibonacci retracement and overlap resistance are.
Areas of consideration:
- H4 time frame, current price
- H4 time frame, 1st support at 0.57984
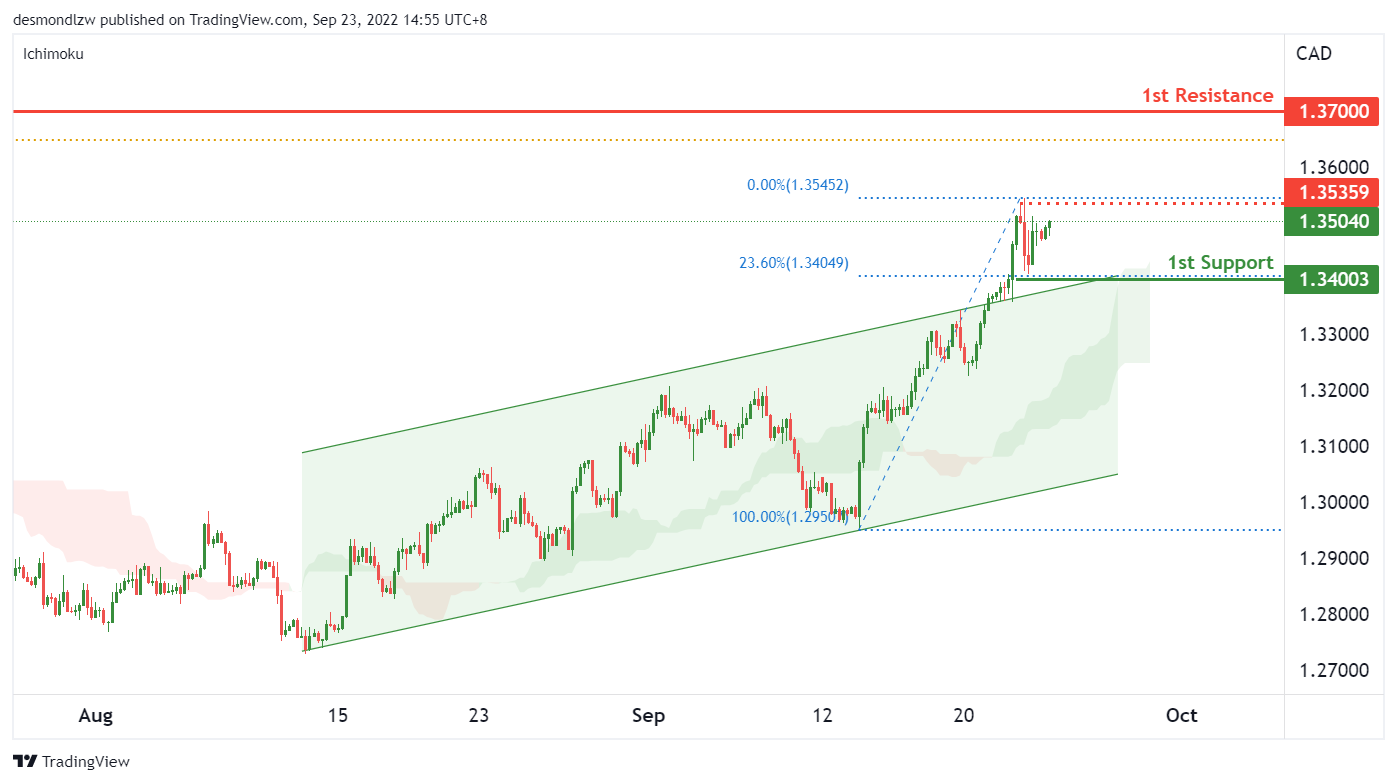
USD/CAD:
On the H4, with the price having broken above the ascending channel and staying above the ichimoku cloud, we have a bullish bias that the price may rise to the 1st resistance at 1.37, major swing high from June 2020 and also slightly above a major 61.8% fibonacci retracement. There is a risk level at 1.3535 which is where our intermediate resistance is, this level needs to be broken to trigger the next move up to our resistance level. The price may pull back to the 1st support at 1.34, which is in line with the 23.6% fibonacci retracement and the ascending channel.
Areas of consideration:
- H4 time frame, 1st resistance at 1.37
- H4 time frame, 1st support at 1.34
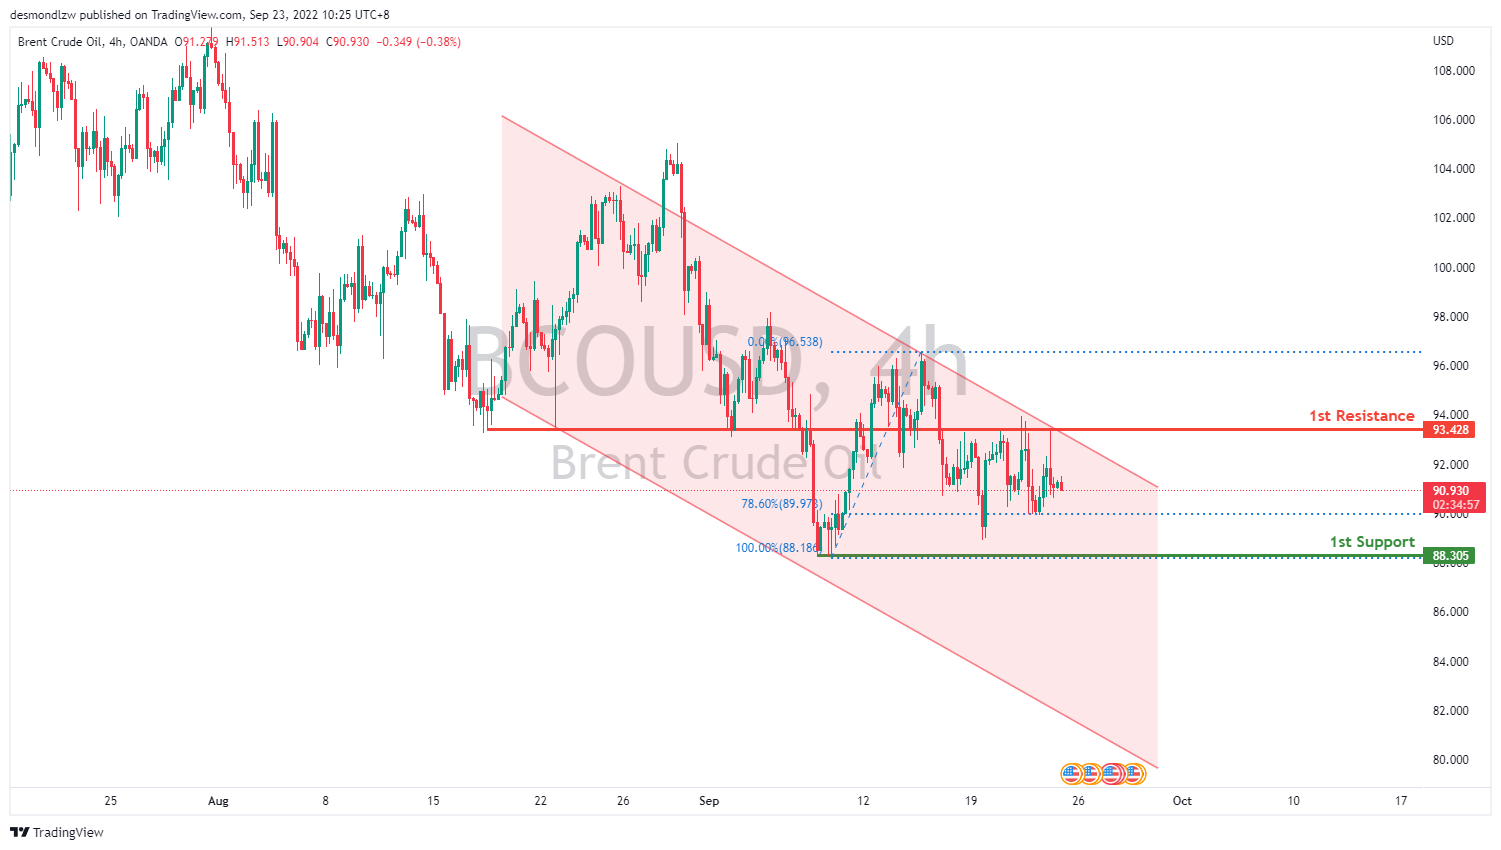
OIL:
On the H4, the overall bias with oil is bearish since the price is moving within the bearish channel. Price broke through the 1st resistance at 93.428 where the 38.2% Fibonacci line and previous swing low are. Price has also reflected multiple times off it. Price is possible to continue bearish and head to wards the 1st support at 88.186 where the 100% Fibonacci line nad previous swing low lies.
Areas of consideration:
- H4 time frame, 1st resistance at 93.428
- H4 time frame, 1st support at 88.305
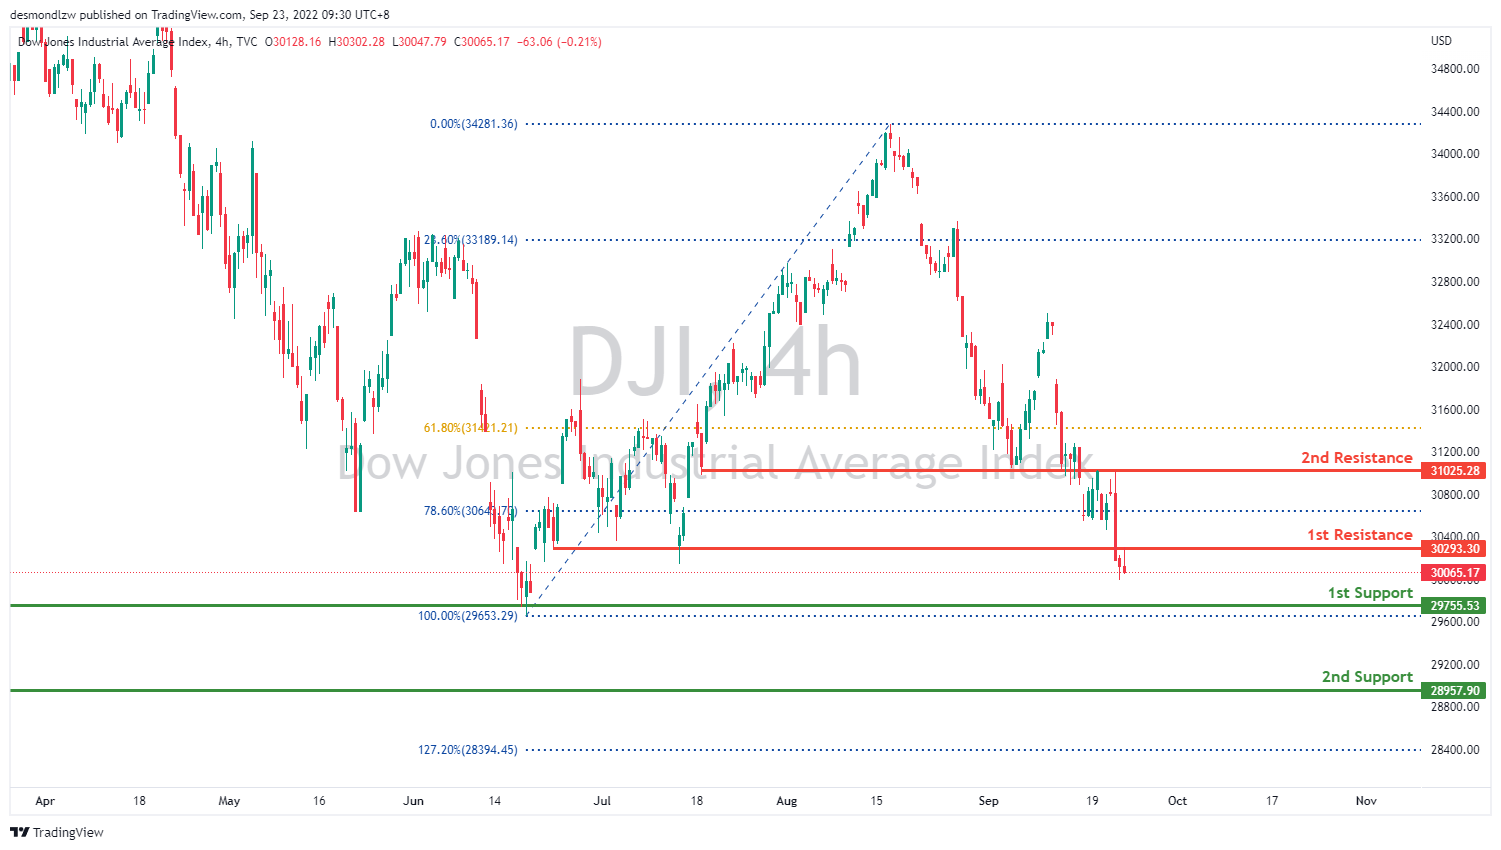
Dow Jones Industrial Average:
On the H4, price has broke through the 1st resistance at30293.30. Price might continue heading downwards towards the 1st support at 29755.53 where the previous swing low and 100% Fibonacci line is.
Areas of consideration:
- H4 time frame, 1st support at 29755.53
- H4 time frame, 1st resistance at 30293.30
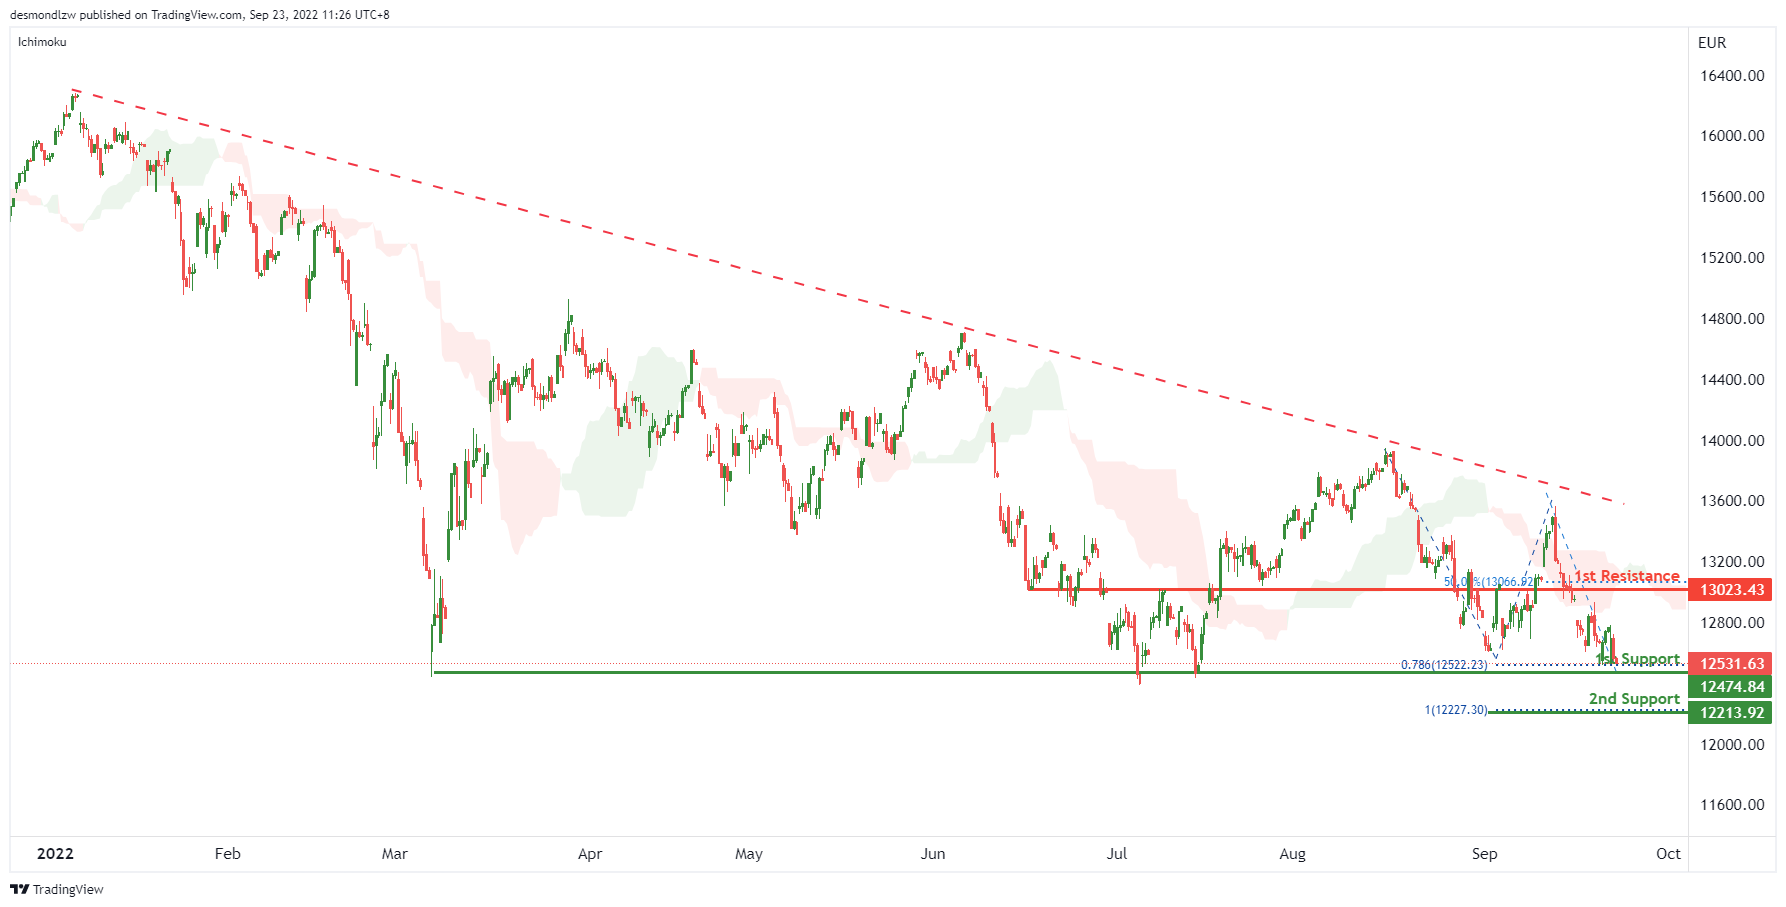
DAX:
On the H4, with the price moving below the descending trendline and below ichimoku cloud, we have a bearish bias that the price may drop to the 1st support at 12474.84, which is in line with the swing lows and 78.6% fibonacci projection. If the 1st support is broken, the next support level could be at 12213.92, where the 100% fibonacci projection is. Alternatively, the price may rise to the 1st resistance at 13023.43, where the 50% fibonacci retracement and overlap resistance are.
Areas of consideration:
- H4 time frame, 1st support at 12474.84
- H4 time frame, 2nd support at 12213.92
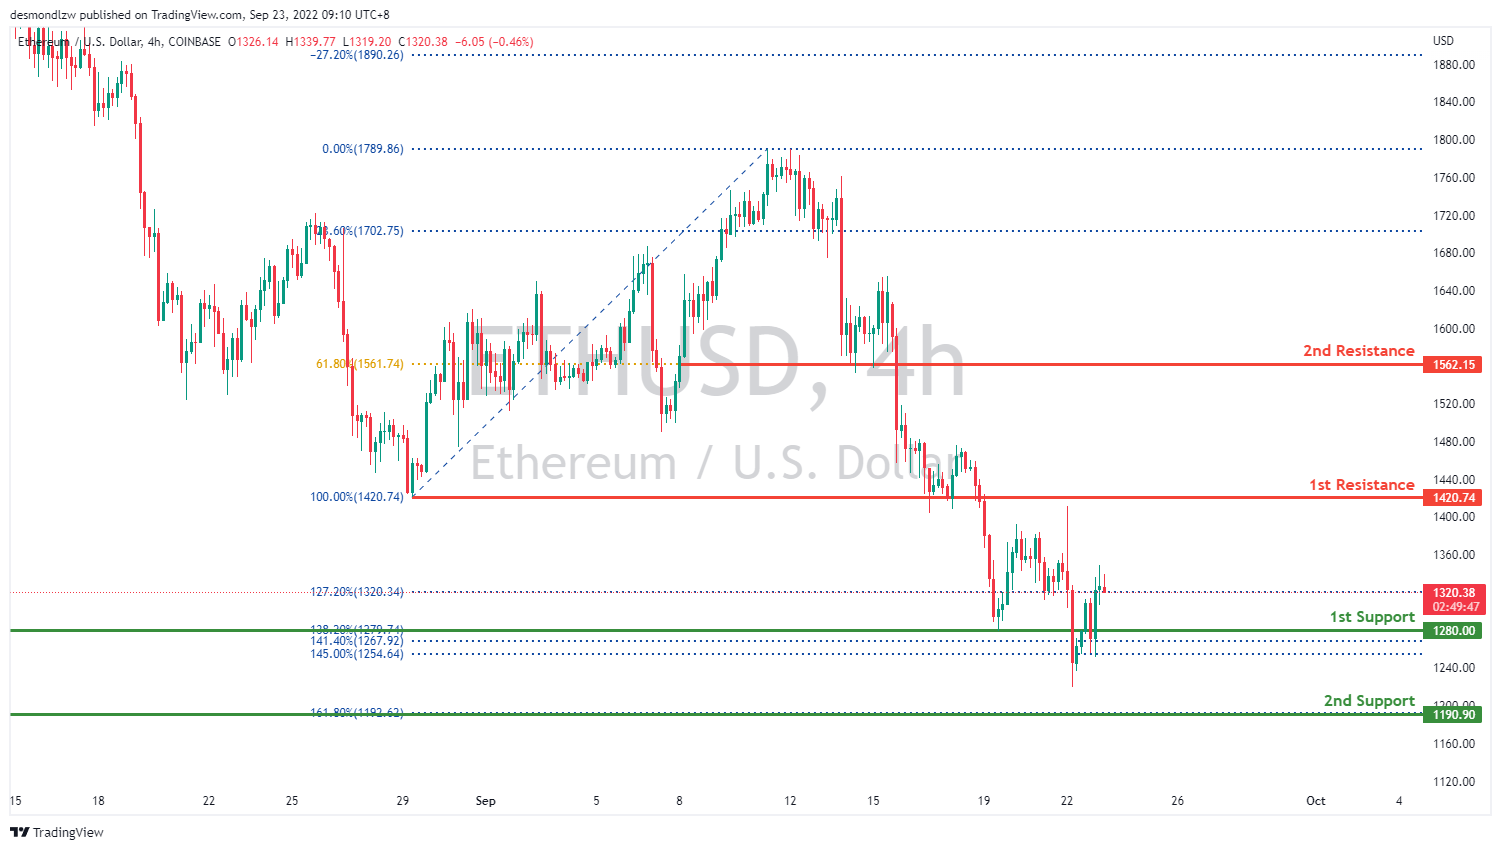
ETHUSD:
On the H4, price has reflected off the 1st Support at 1280.00 where the 138.2% Fibonacci extension line is. Price could possible head back up to the 1st resistance for retracement and then head lower back down towards the 2nd support area.
Areas of consideration:
- H4 time frame, 1st resistance of 1420.74
- H4 time frame, 1st support at 1280.00
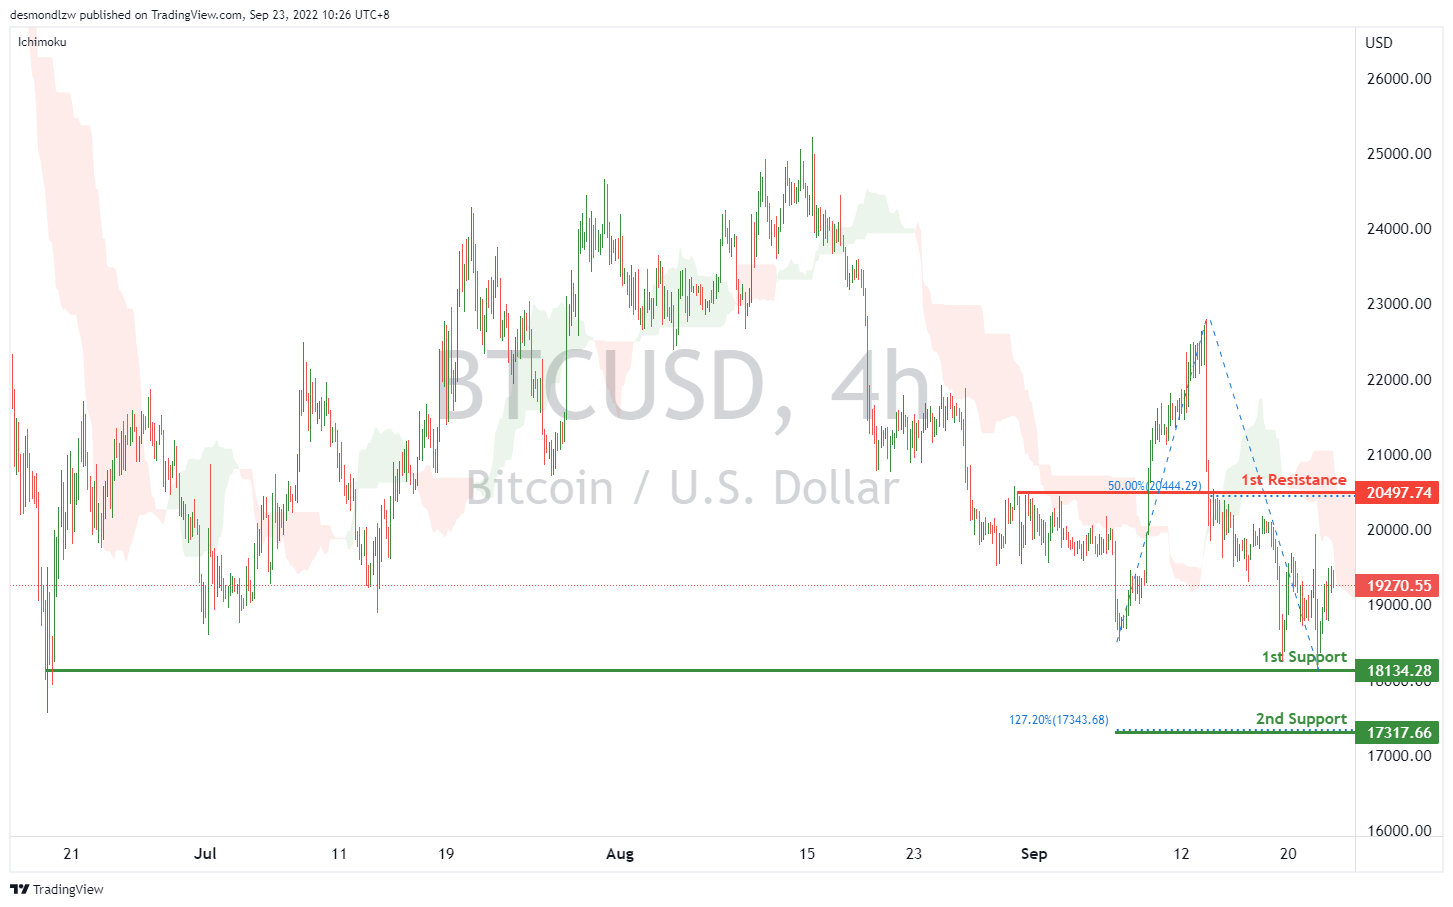
BTCUSD:
On the H4, price has reflected off the first support at 18134.28 where the previous swing low sits. Price could possibly head down to the first resistance area at 20497.74, where the 50% Fibonacci retracement is. Alternatively, the price may retest the 1st support at 18134.28, if the 1st support is broken, the 2nd support could be at 17317.66, where the 127.2% fibonacci extension is.
Areas of consideration:
- H4 time frame, current price
- H4 time frame, first resistance at 20497.74
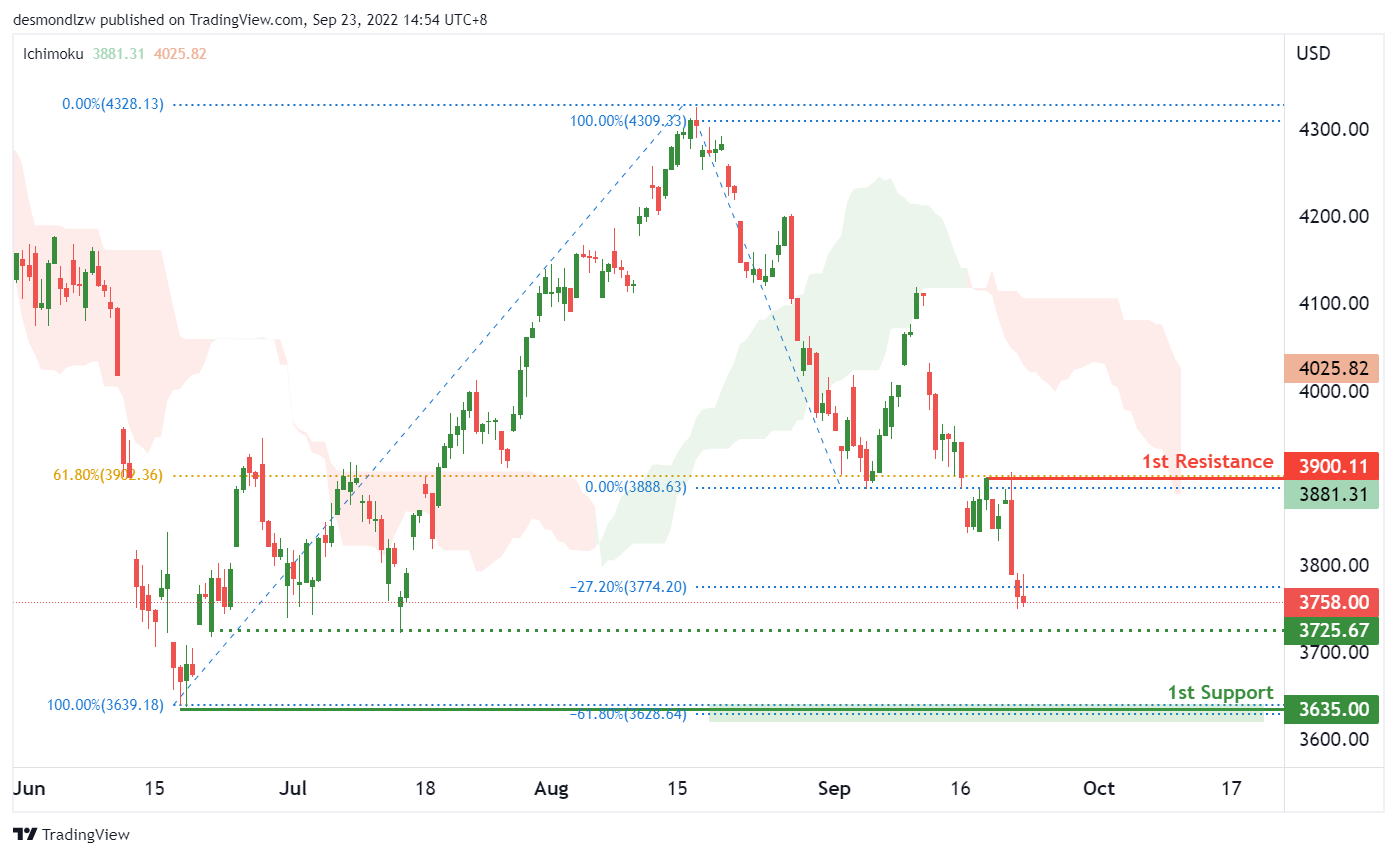
S&P 500:
On the H4, with the price on a strong bearish trend and below the ichimoku cloud, we have a bearish bias that price may drop to the 1st support of 3635, which is in line with the -61.80% fibonacci expansion and previous swing low of June 2022. There is a risk level at 3725 which is where our intermediate support is, this level needs to be broken to trigger the next move down to our support level.
Areas of consideration:
- H4 time frame, 1st resistance at 3900
- H4 time frame, 1st support at 3635
The accuracy, completeness and timeliness of the information contained on this site cannot be guaranteed. IC Markets does not warranty, guarantee or make any representations, or assume any liability regarding financial results based on the use of the information in the site.
News, views, opinions, recommendations and other information obtained from sources outside of www.icmarkets.com.au, used in this site are believed to be reliable, but we cannot guarantee their accuracy or completeness. All such information is subject to change at any time without notice. IC Markets assumes no responsibility for the content of any linked site.
The fact that such links may exist does not indicate approval or endorsement of any material contained on any linked site. IC Markets is not liable for any harm caused by the transmission, through accessing the services or information on this site, of a computer virus, or other computer code or programming device that might be used to access, delete, damage, disable, disrupt or otherwise impede in any manner, the operation of the site or of any user’s software, hardware, data or property.