
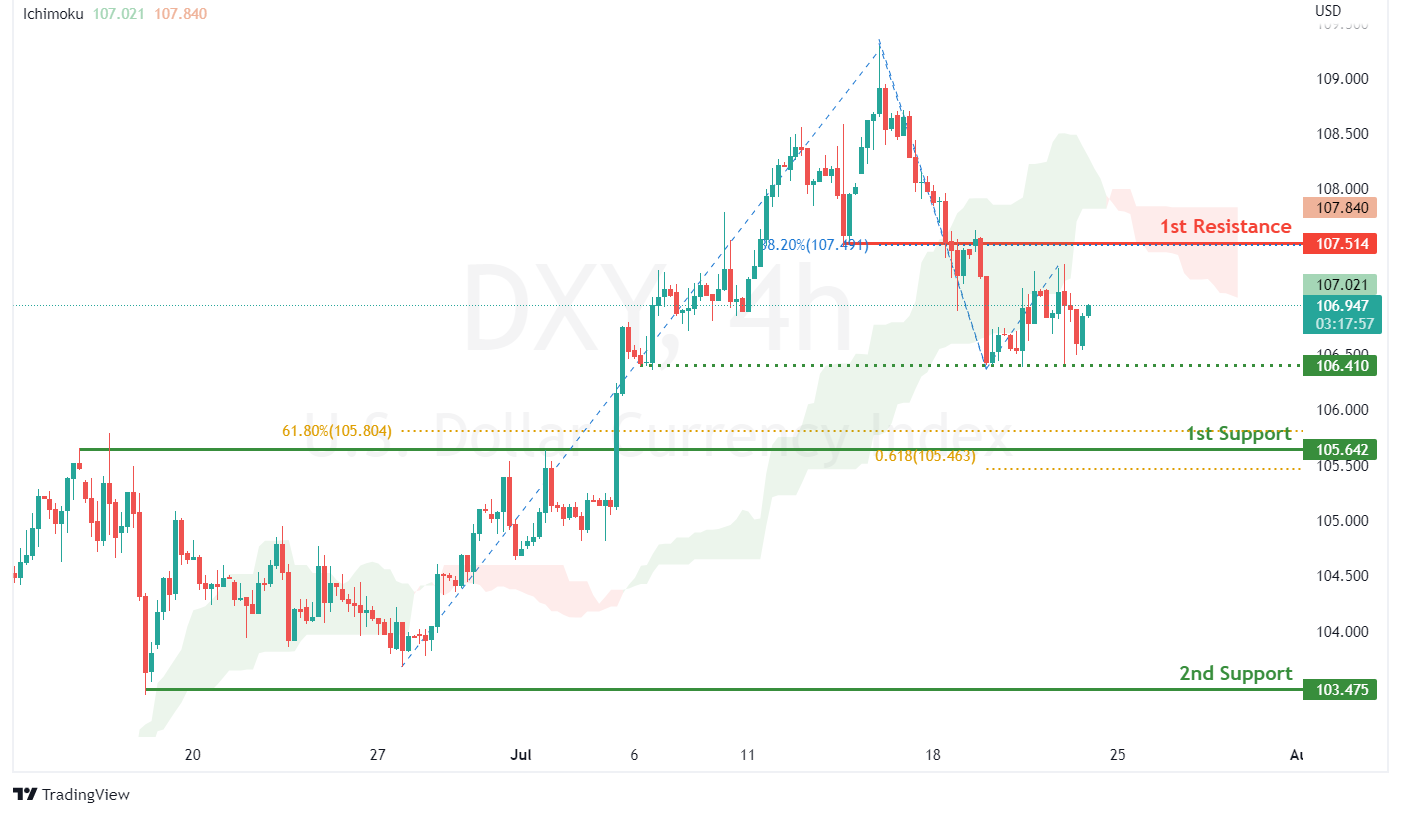
DXY:
On the H4, with prices moving below the ichimoku indicator, we have a bearish bias that prices will drop to the 1st support at 105.642 in line with overlap support, 61.8% fibonacci projection and 61.8% fibonacci retracement. Take note of intermediate support at 106.410 where the swing low support is. Once there is downside confirmation of price breaking 1st support structure, we would expect bearish momentum to carry price to 2nd support at 103.475 in line with swing low support. Alternatively, price could rise to 1st resistance at 107.514 where the pullback resistance and 38.2% fibonacci retracement are.
Areas of consideration:
- H4 time frame, 1st resistance at 107.514
- H4 time frame, 1st support at 105.642
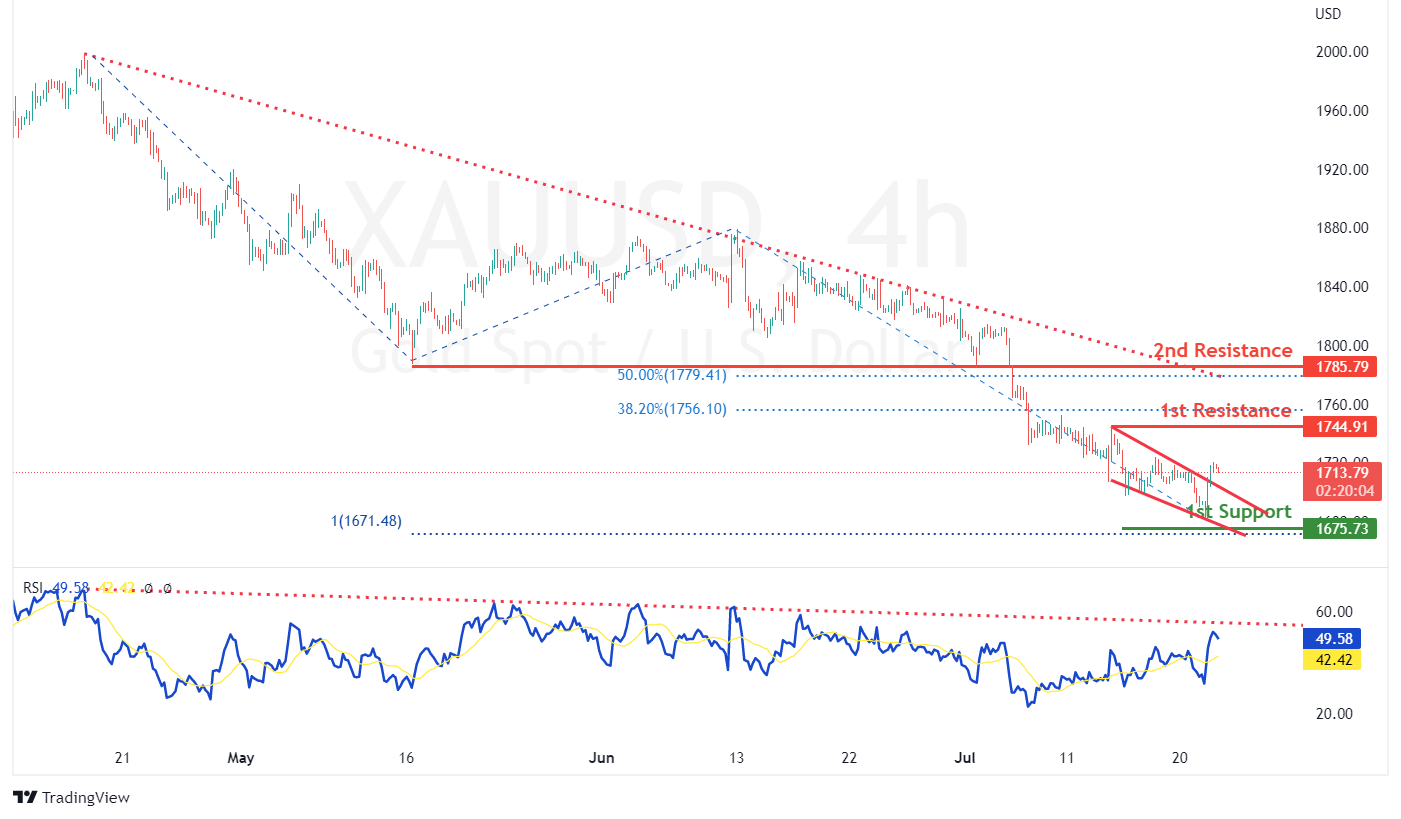
XAU/USD (GOLD):
On the H4, with price moving in a descending trendline and RSI moving in a descending trendline, we have a bearish bias that price will rise and drop from 1st resistance at 1744.91 where the swing high resistance and 38.2% fibonacci retracement are to 1st support at 1675.73 in line with 100% fibonacci projection and swing low support on the daily timeframe. Alternatively, price could break 1st resistance and rise to 2nd resistance at 1785.79 where the 50% fibonacci retracement and pullback resistance are. Take note of wedge formation.
Areas of consideration:
- H4 time frame, 1st Resistance at 1744.91
- H4 time frame, 1st Support at 1699.76
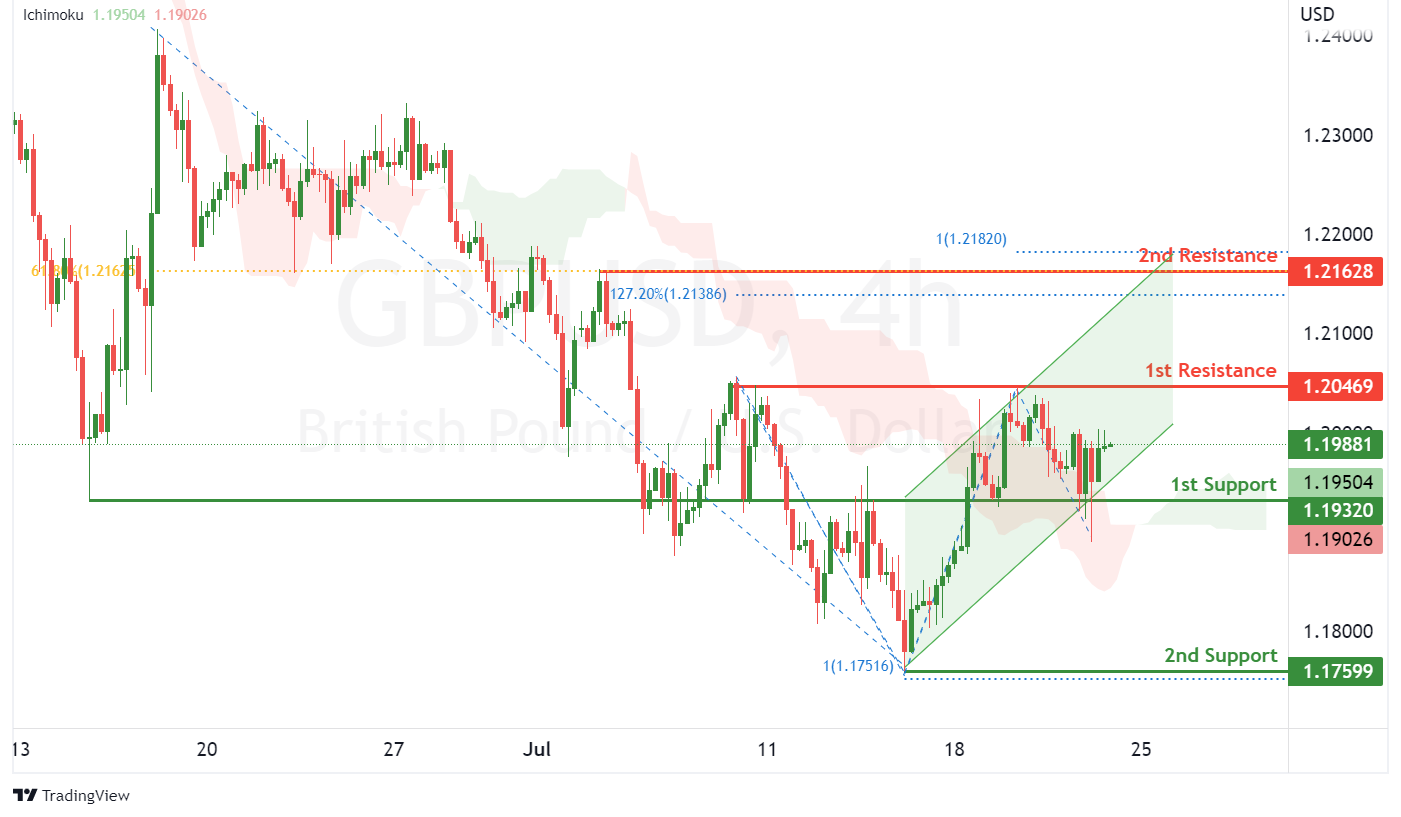
GBP/USD:
On the H4, with prices moving within an ascending channel and above the ichimoku indicator, we have a bullish bias that price will rise to the 1st resistance at 1.20469 where the swing high resistance is. Once there is upside confirmation that price has broken the 1st resistance, we would expect bullish momentum to carry prices to 2nd resistance at 1.21628 where the swing high resistance,61.8% fibonacci retracement, 100% fibonacci projection and 127.2% fibonacci extension are. Alternatively, price could drop to the 1st support at 1.19320 where the pullback support is. Should price break 1st support, we would have a bearish bias that price will drop to 2nd support at 1.17599 in line with swing low support and 100% fibonacci projection.
Areas of consideration:
- H4 1st resistance at 1.20469
- H4 1st support at 1.19320
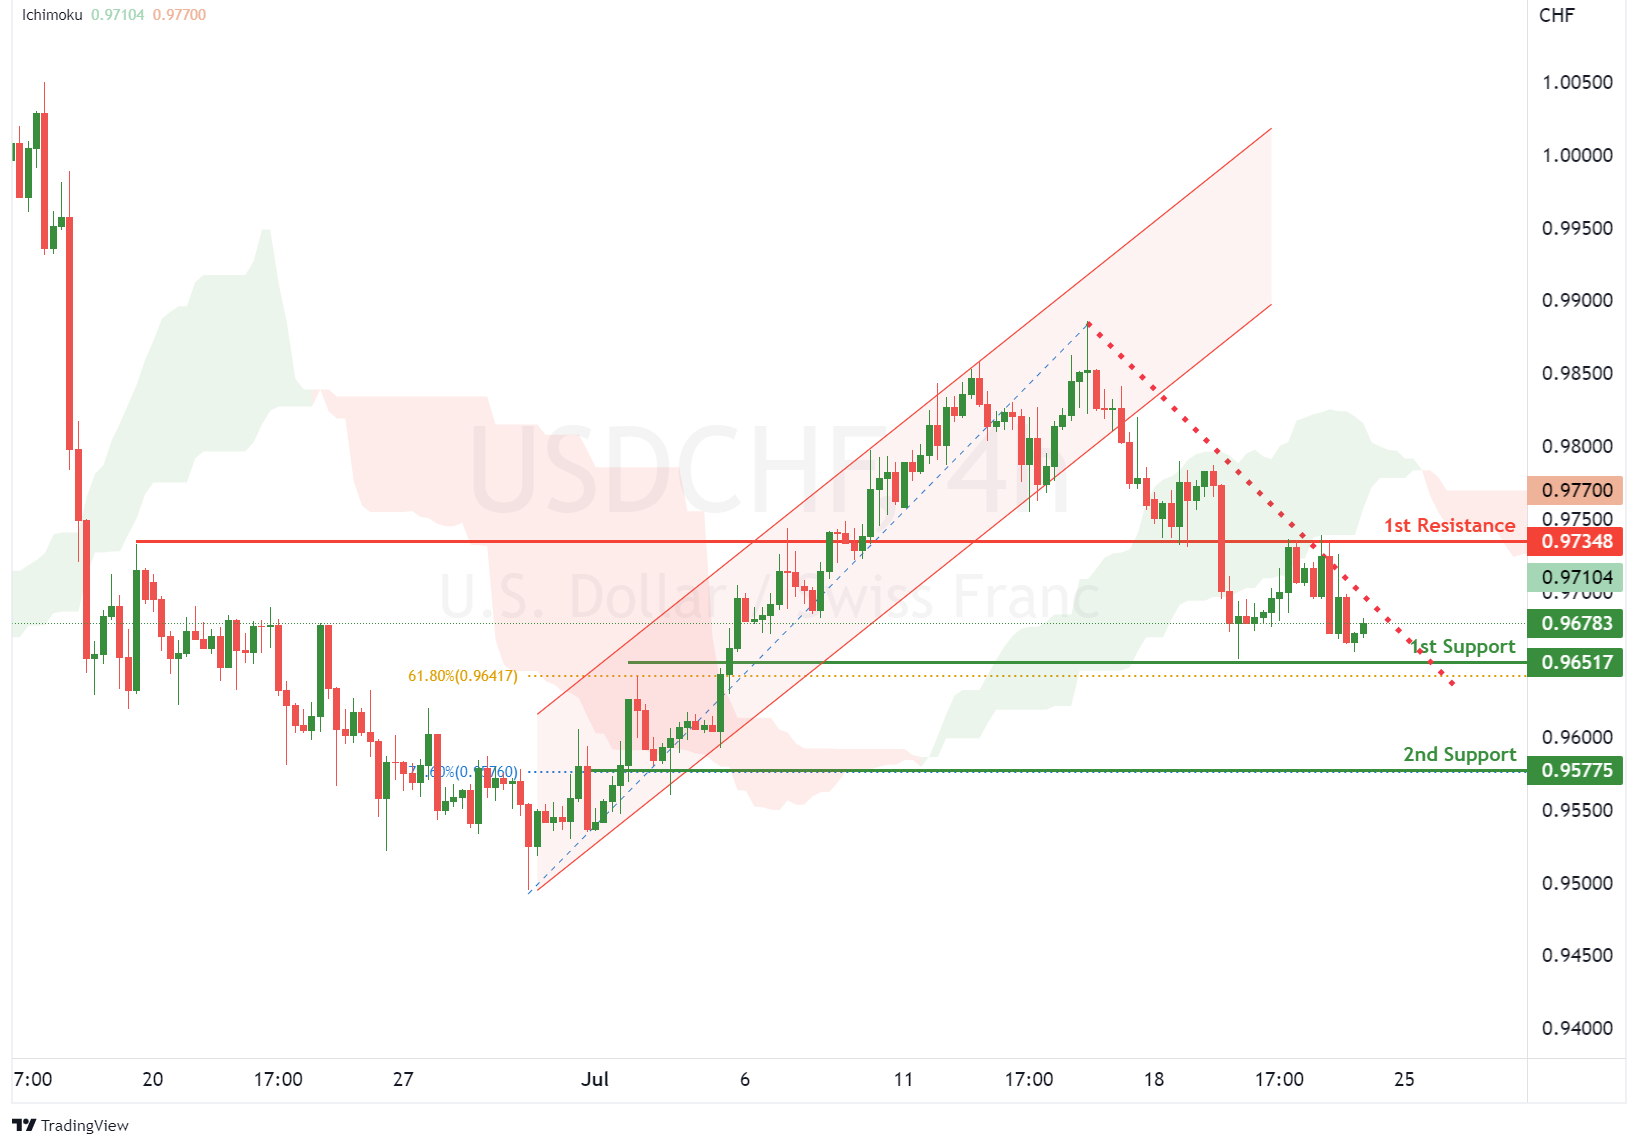
USD/CHF:
On the H4, with price breaking the bullish channel, moving along the descending channel and crossing over the the ichimoku indicator, we have a bearish bias that price might drop from our 1st resistance at 0.97348 where the pullback resistance is to our 1st support at 0.96780, which is in line with the close swing low. If the price continues going down, the price may drop to our 2nd support at 0.96434, which is in line with 61.8% fibonacci retracement. Alternatively, price may break 1st resistance and head for 2nd resistance at 0.97923 where the close swing high is.
Areas of consideration
- 1st resistance level at 0.97348
- 1st support level at 0.96780
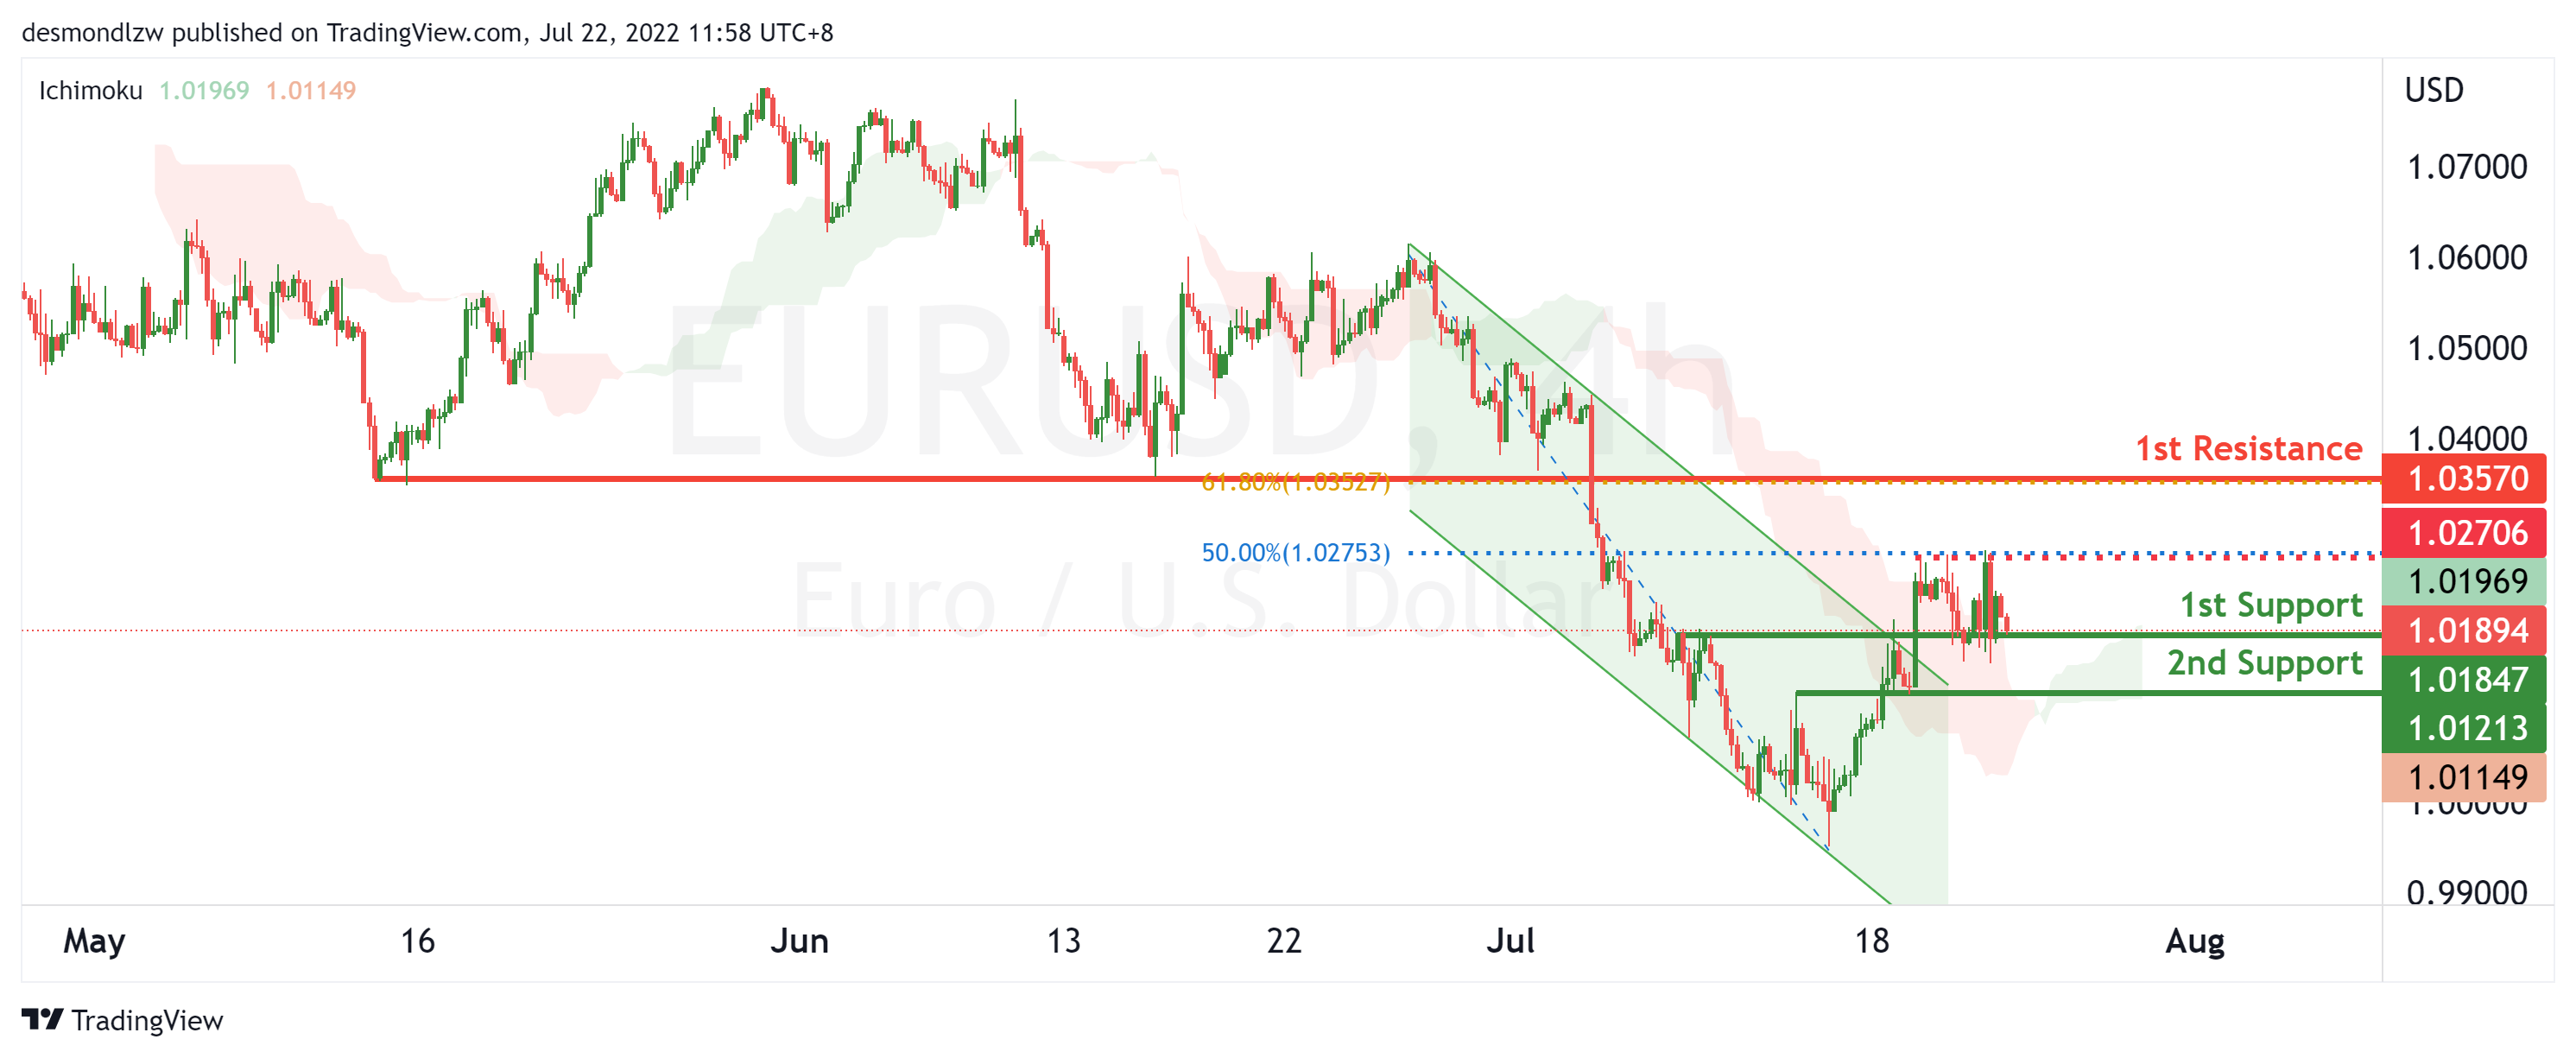
EUR/USD :
On the H4, with price moving above the ichimoku cloud and breaking out of the descending trend channel, we have a bullish bias that price will continue to rise from the 1st support at 1.01847 at the overlap support. If price breaks above the intermediary resistance at 1.02487 in line with the 100% fibonacci projection, we have upside confirmation that price will continue to rise to the 1st resistance at 1.03570 at the pullback resistance in line with the 61.8% fibonacci retracement. Alternatively, price may reverse off the 1st support and drop to the 2nd support at 1.01213 at the overlap support.
Areas of consideration :
- H4 1st resistance at 1.03570
- H4 1st support at 1.01920
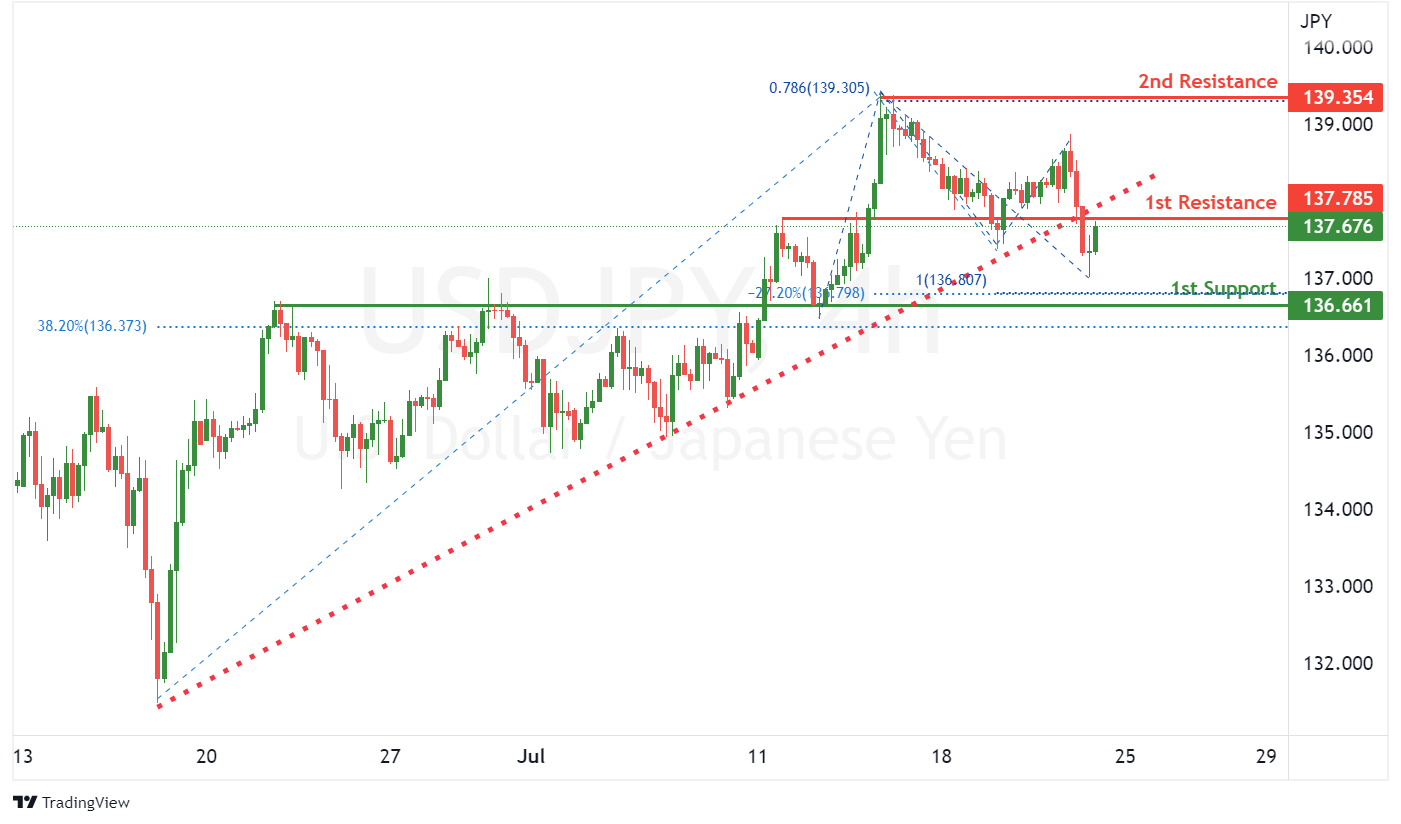
USD/JPY:
On the H4, with price breaking out of the ascending trendline, we have a bearish bias that price will rise and drop from our 1st resistance at 137.785 where the pullback resistance is to the 1st support at 136.661 where the overlap support, 100% fibonacci projection, -27.2% fibonacci expansion and 38.2% fibonacci retracement are. Alternatively, price could break 1st resistance structure and head for 2nd resistance at 139.354 where the swing high resistance and 78.6% fibonacci projection are.
Areas of consideration:
- H4 time frame, 1st resistance at 137.785
- H4 time frame, 1st support at 136.661
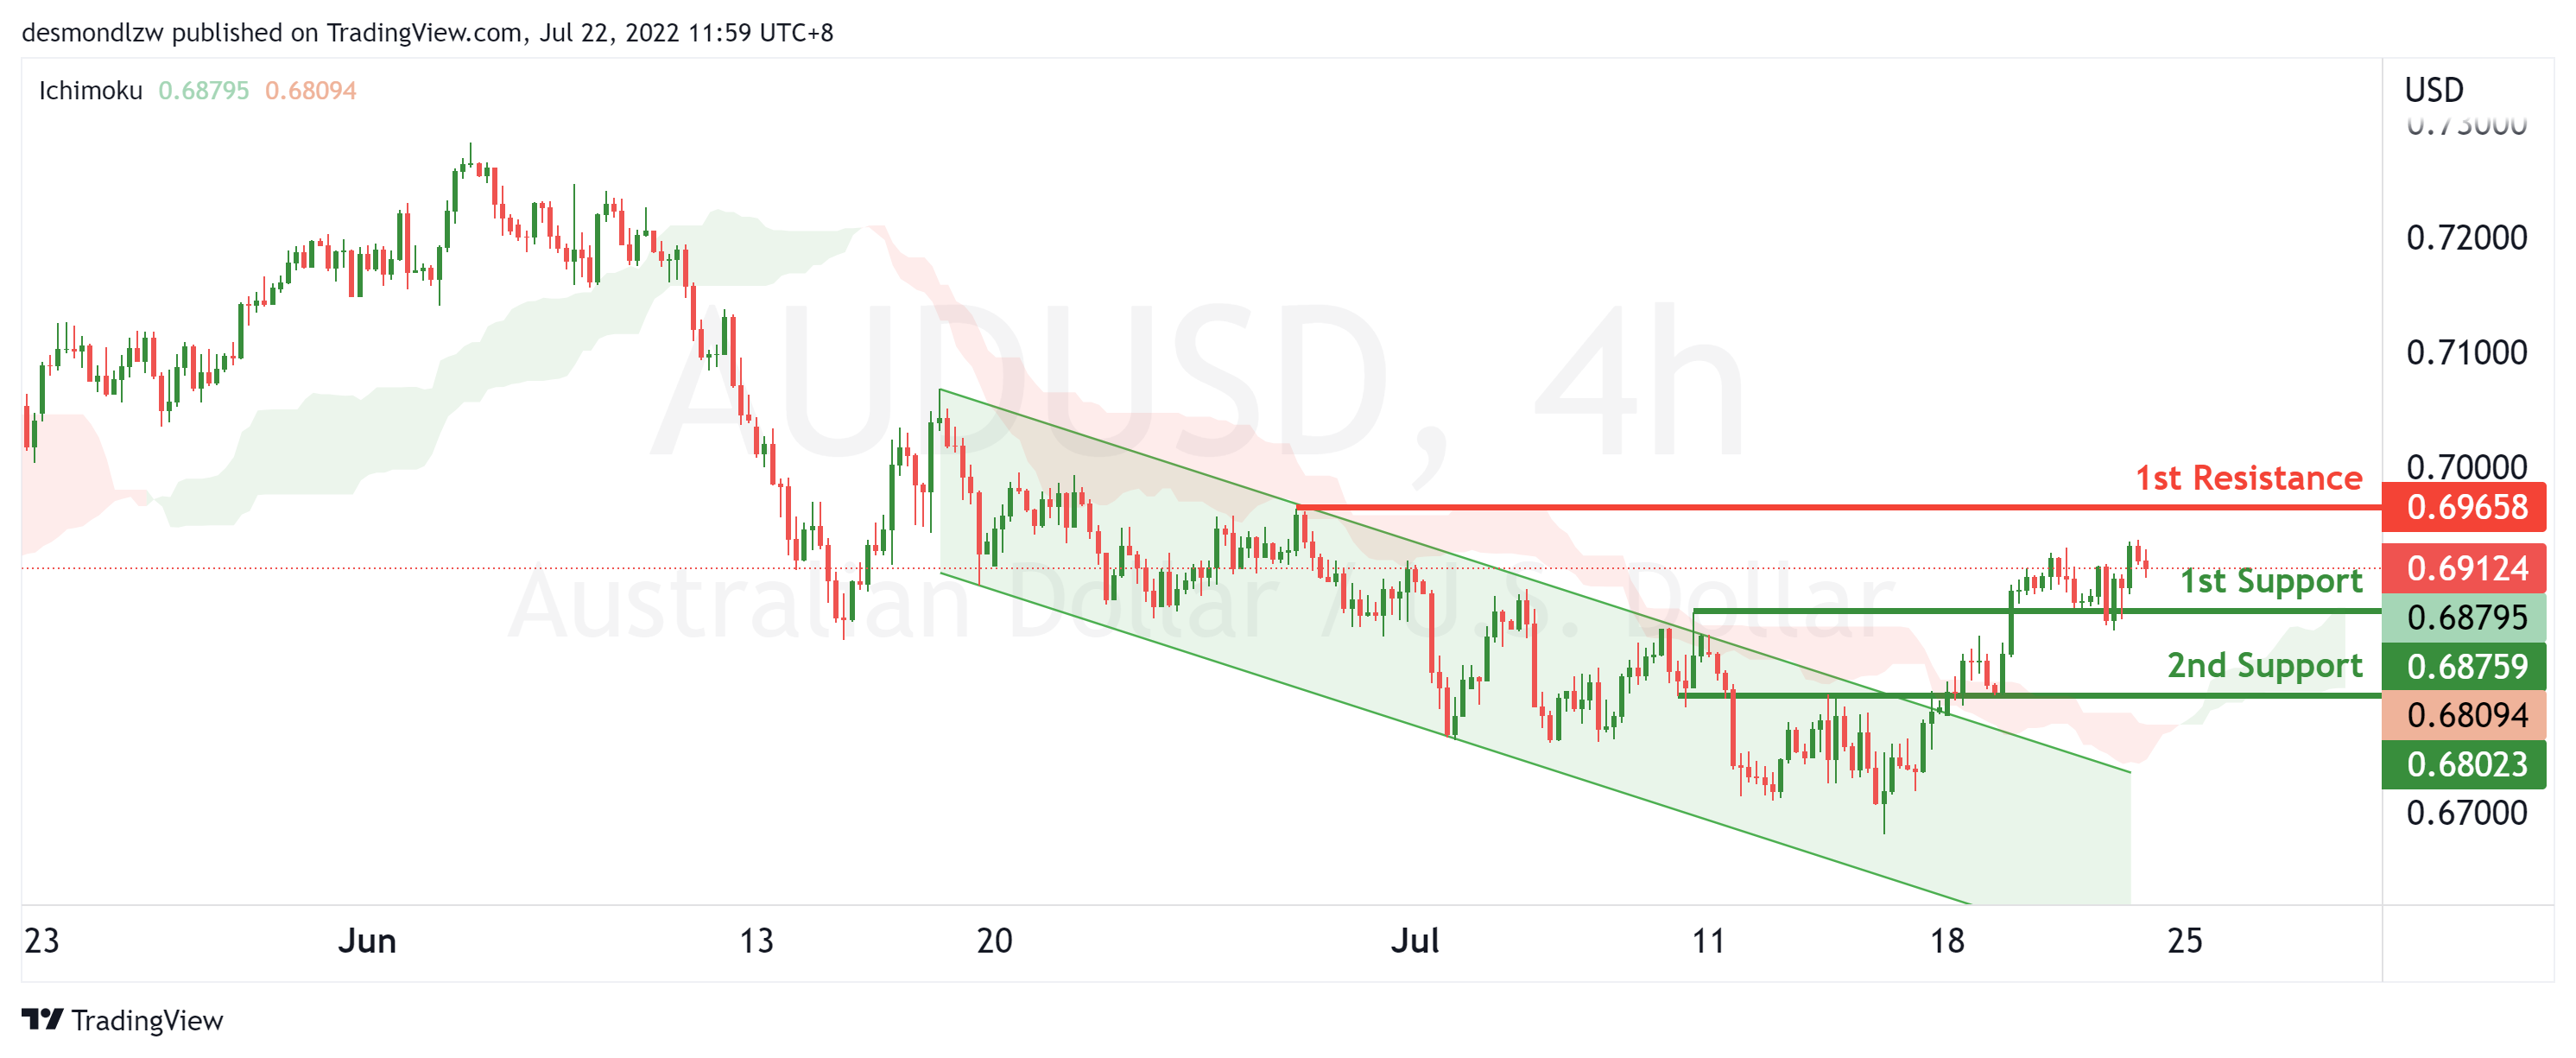
AUD/USD:
On the H4, with price moving above the ichimoku cloud and breaking out of the descending trend channel, we have a bullish bias that price will rise from the 1st resistance at 0.68759 at the overlap resistance. If price rises and breaks the intermediary resistance at 0.69213 in line with the 61.8% fibonacci retracement, we will have upside confirmation that price will continue to rise to the 2nd resistance at 0.69658 at the swing high. Alternatively, price may reverse off the 1st resistance and drop to the 1st support at 0.68023 at the overlap support.
Areas of consideration
- H4 1st resistance at 0.68759
- H4 1st support at 0.68023
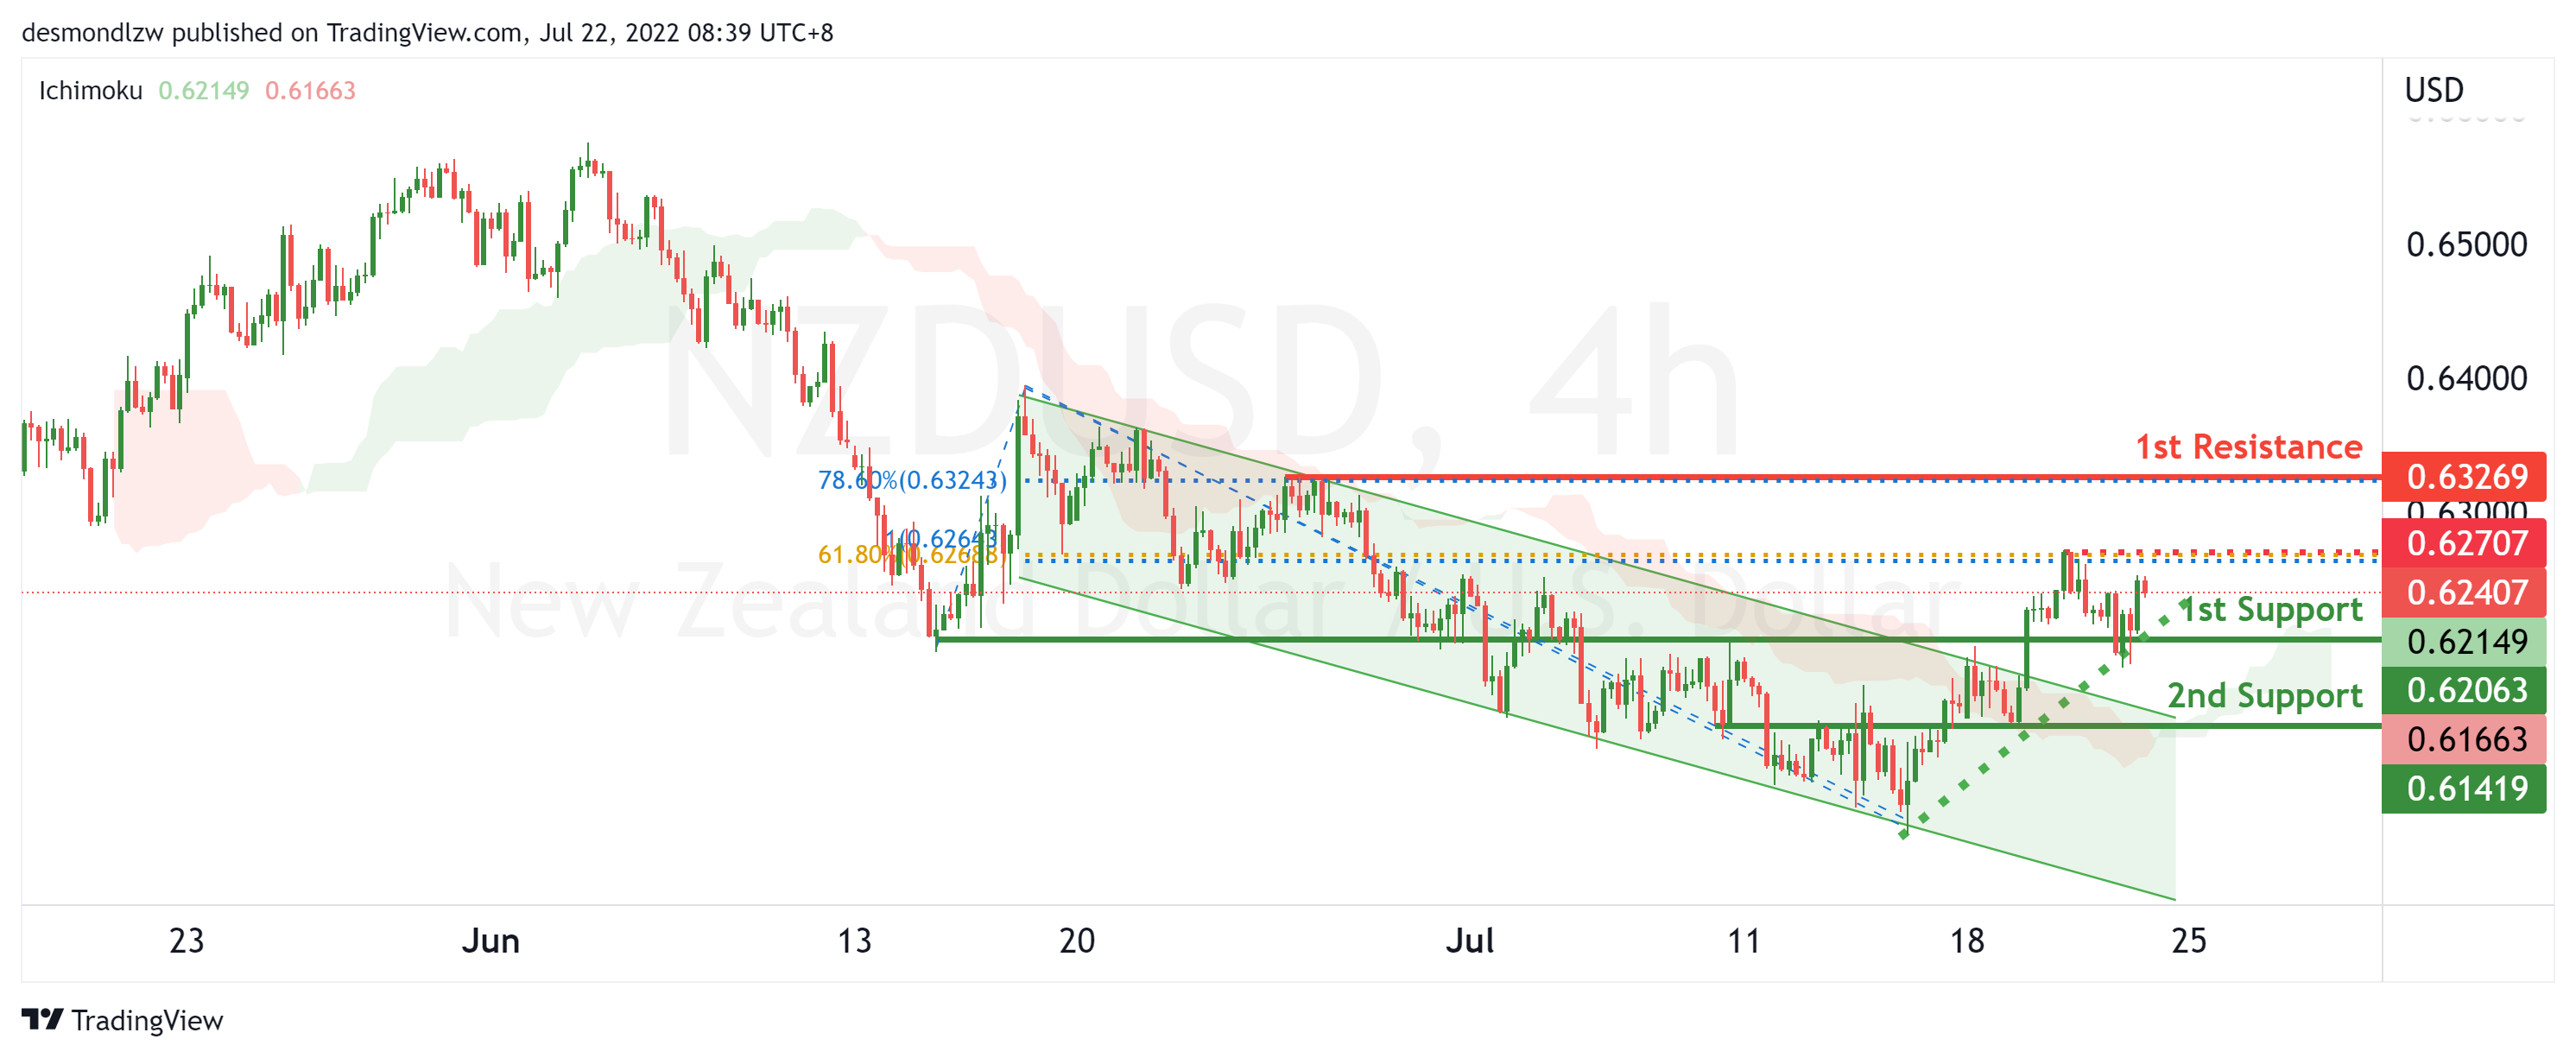
NZD/USD:
On the H4, with price recently breaking the descending trend channel, short term ascending support and moving above the ichimoku cloud, we have a bullish bias that price will rise from the 1st support at 0.62177 at the overlap support. If price breaks the intermediary resistance at 0.62707 at the swing high in line with the 61.8% fibonacci retracement and 100% fiboancci projection, we will have upside confirmation that price will rise to the 1st resistance at 0.63269 at the swing high in line with the 78.6% fibonacci retracement. Alternatively, price may break the support structure at the 1st support and drop to the 2nd support at 0.61419 at the pullback support.
Areas of consideration:
- H4 time frame, 1st support at 0.62177
- H4 time frame, 1st resistance at 0.63269
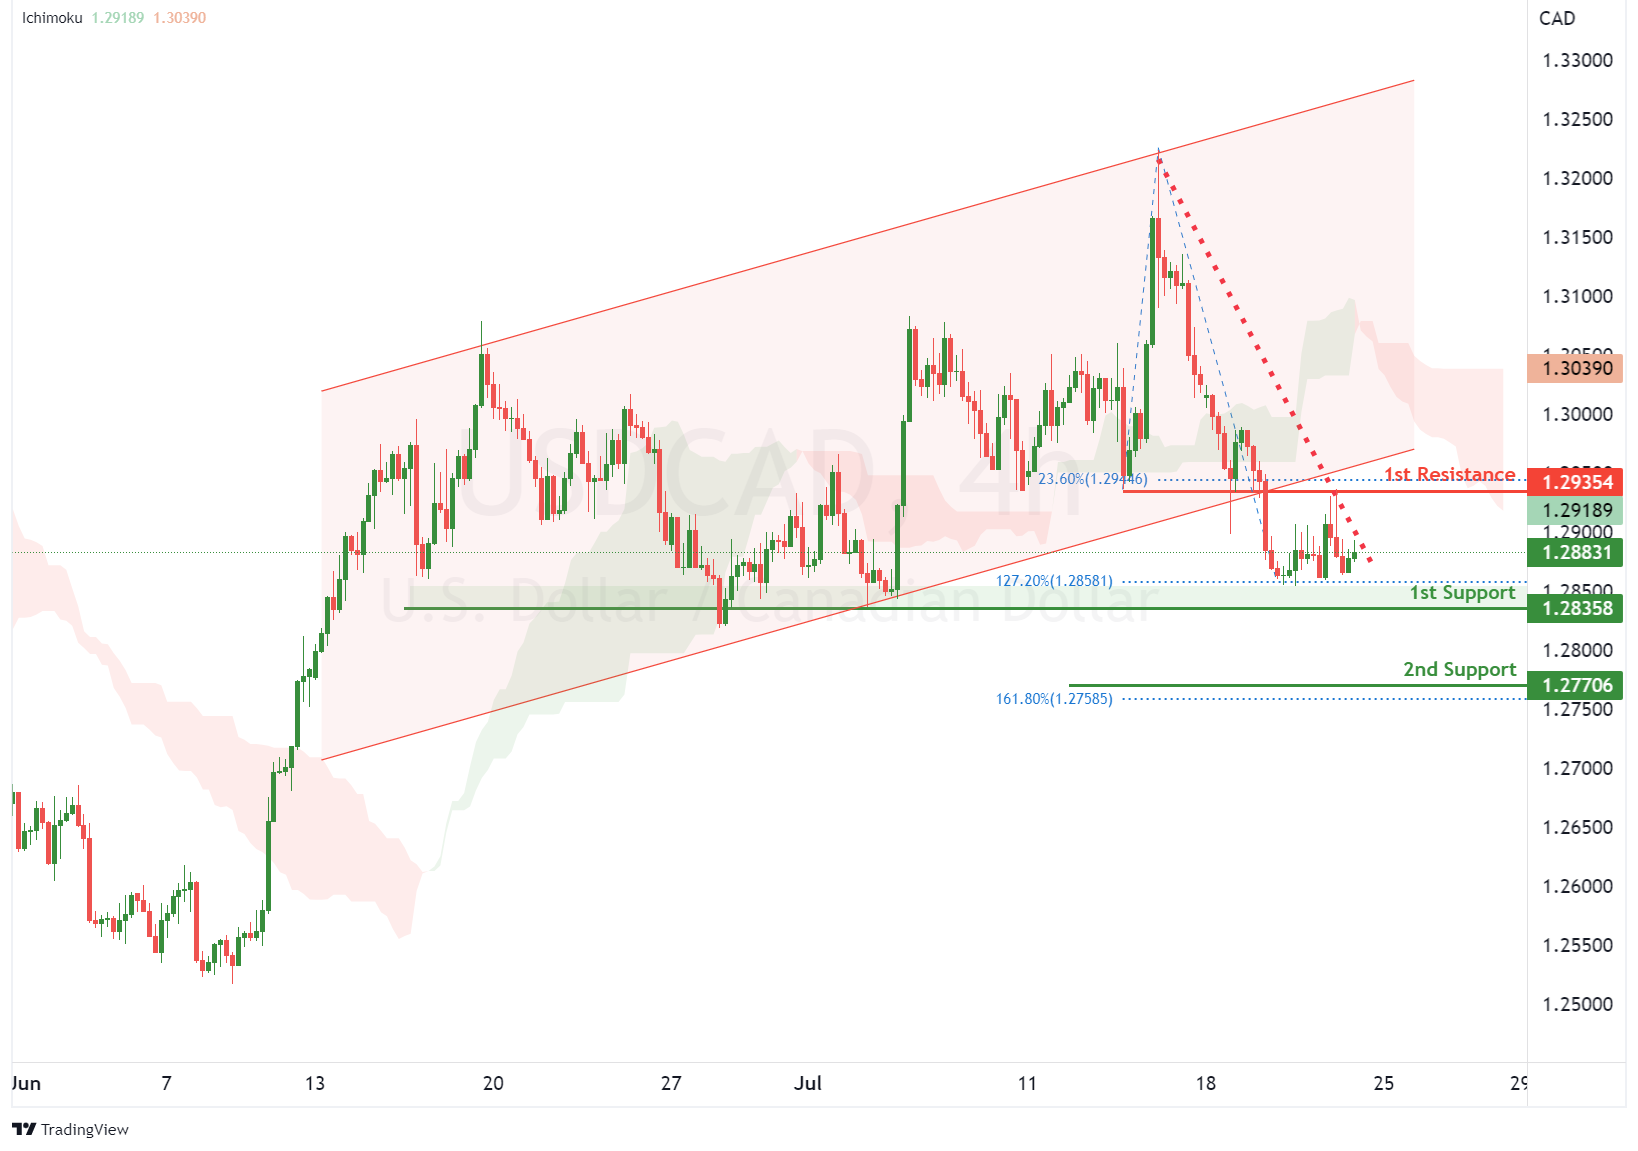
USD/CAD:
On the H4, with the price breaking the ascending trendline, the price may drop from our 1st support at 1.28639, which is in line with 127.2% fibonacci retracement to our 2nd support at 1.27706, which is in line with 161.8% fibonacci retracement. Alternatively, the price may rise to the 1st resistance at 1.29354, which is in line with the 23.6% fibonacci retracement and pullback resistance.
Areas of consideration:
- H4 time frame, 1st support at 1.28639
- H4 time frame, 2nd support at 1.27706
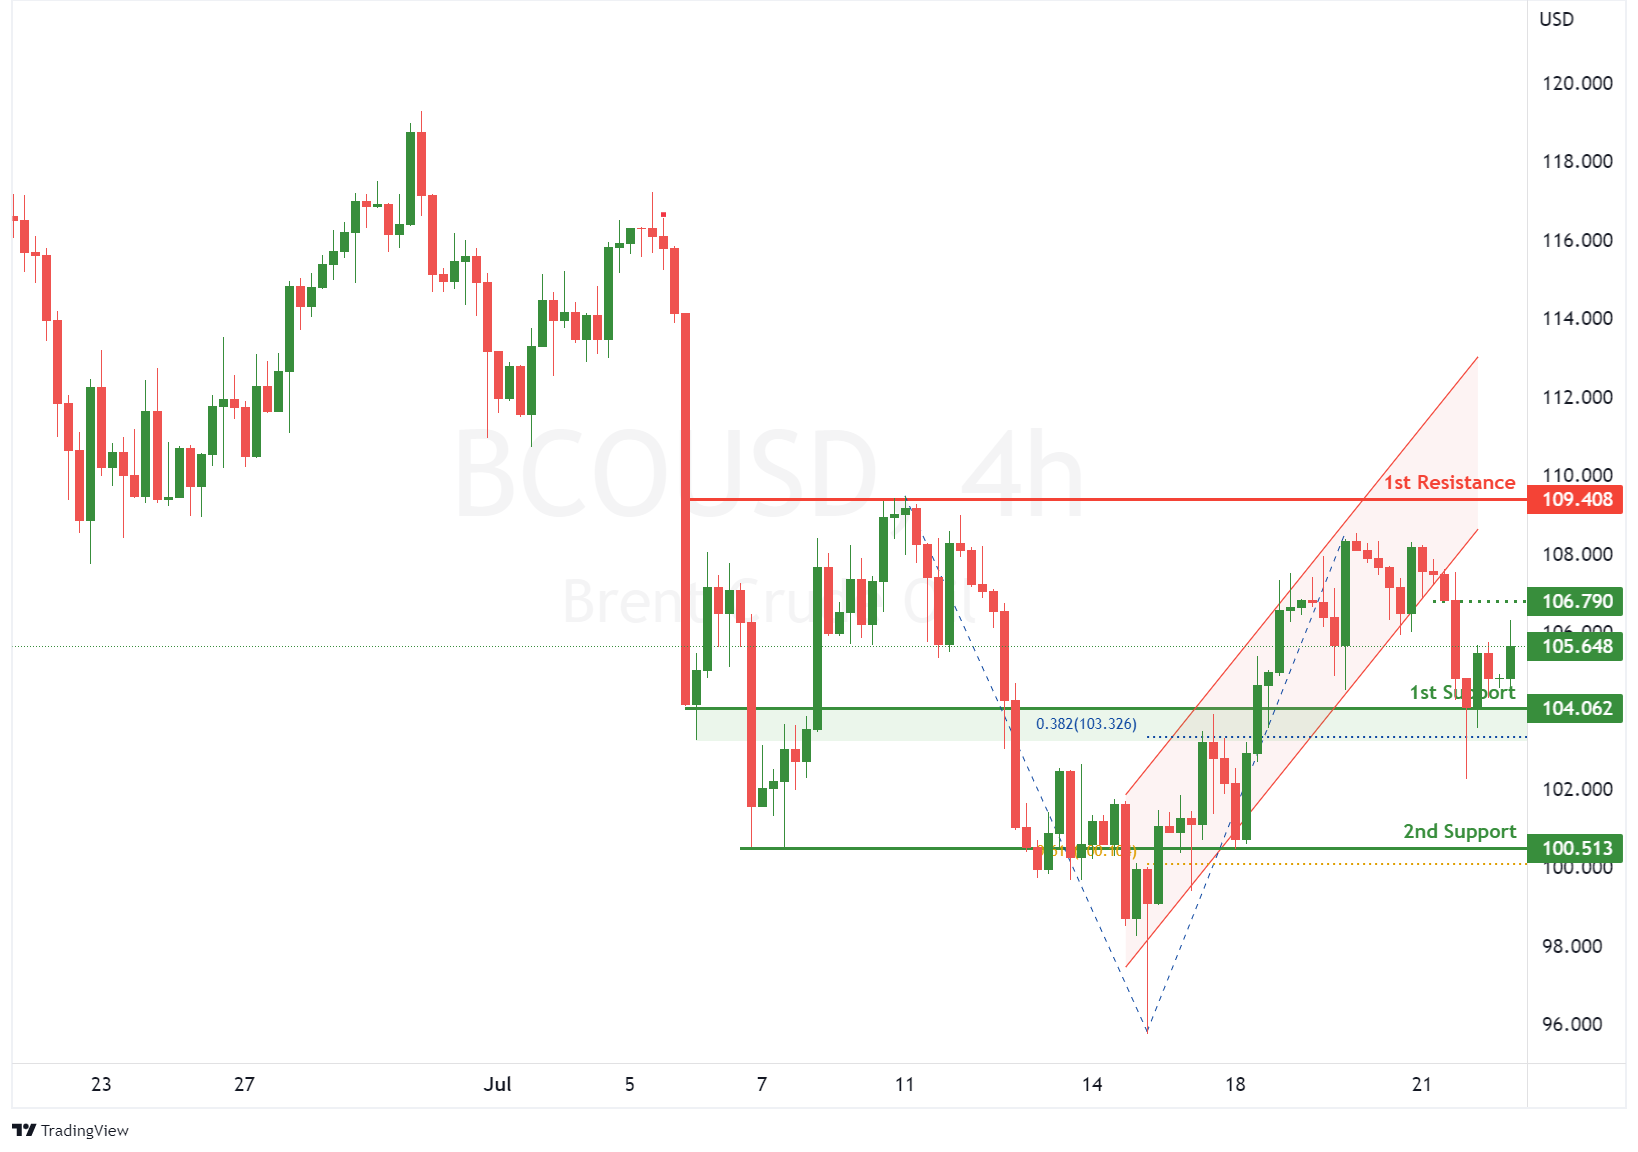
OIL:
On the H4, with price moving along the bullish channel and having a bearish breakout, we have a bearish bias that price might drop to our 1st support at 104.062, which is in line with 61.8% retracement. If the price keeps going down, it may drop to our 2nd support, which is the swing low. Alternatively, price may rise to 1st resistance at 109.408, which in line with 61.8% fibonacci retracement and overlap resistance.
Areas of consideration:
- H4 time frame, 1st support of 104.602
- H4 time frame, 2nd support of 95.871
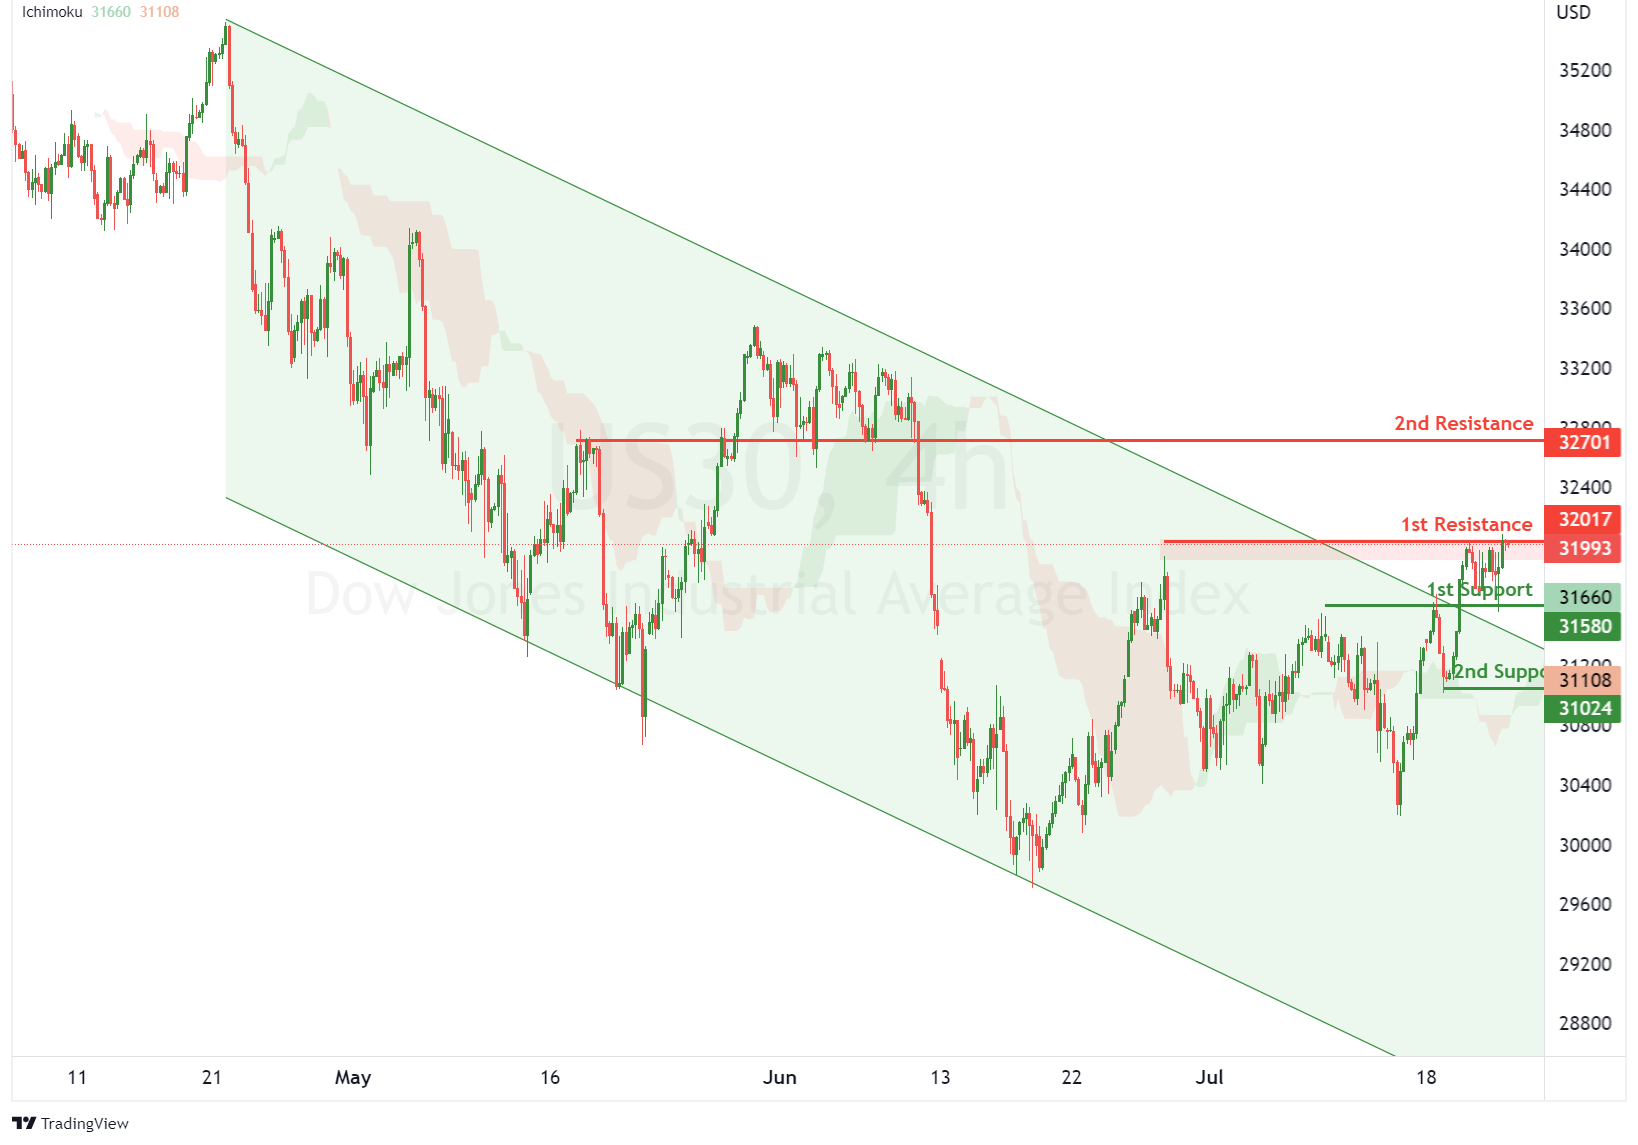
Dow Jones Industrial Average:
On the H4, with price moving with a bearish channel and having a bullish break, we have a bullish bias that price might rise from our 1st resistance at 32011, which is in line with the swing highs to our 2nd resistance at 32775, which is in line with swing high. Alternatively, price may reverse off the 1st resistance and drop to the 1st support at 31570, which is in line with the overlap support, if the price keeps going down, it may drop to our 2nd support at 30971.
Areas of consideration:
- H4 time frame, 1st resistance of 32011
- H4 time frame, 2nd resistance at 32775
The accuracy, completeness and timeliness of the information contained on this site cannot be guaranteed. IC Markets does not warranty, guarantee or make any representations, or assume any liability regarding financial results based on the use of the information in the site.
News, views, opinions, recommendations and other information obtained from sources outside of www.icmarkets.com.au, used in this site are believed to be reliable, but we cannot guarantee their accuracy or completeness. All such information is subject to change at any time without notice. IC Markets assumes no responsibility for the content of any linked site.
The fact that such links may exist does not indicate approval or endorsement of any material contained on any linked site. IC Markets is not liable for any harm caused by the transmission, through accessing the services or information on this site, of a computer virus, or other computer code or programming device that might be used to access, delete, damage, disable, disrupt or otherwise impede in any manner, the operation of the site or of any user’s software, hardware, data or property.