
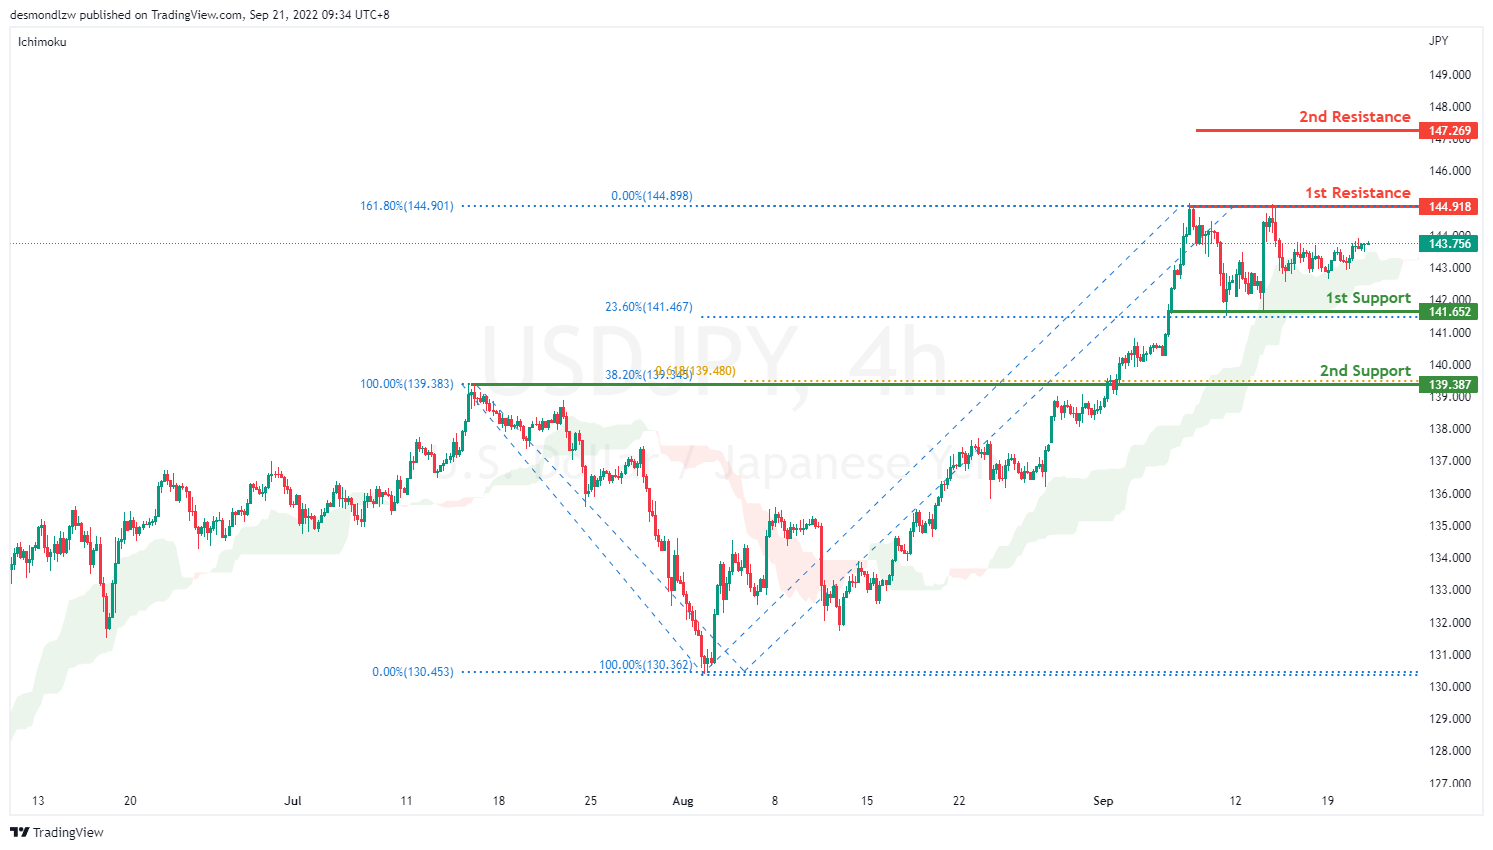
USD/JPY:
On the H4 chart, price is still respecting the ascending momentum. We are still bullish bias- Price is testing above the previous low and if bullish momentum continues, it should bring price to first resistance at 144.918 where the 161.8% extension sits. If it breaks this level, it should bring price to 147.269 where the previous swing high sits. Alternatively it could pull back to the first support at 141.652 where the 23.6% retracement and 100% projection sits then to the second support at 139.387 where the 38.2% retracement, 61.8% projection and overlapping support sits.
Areas of consideration:
- H4 time frame, 1st resistance at 144.918
- H4 time frame, 1st support at 141.652
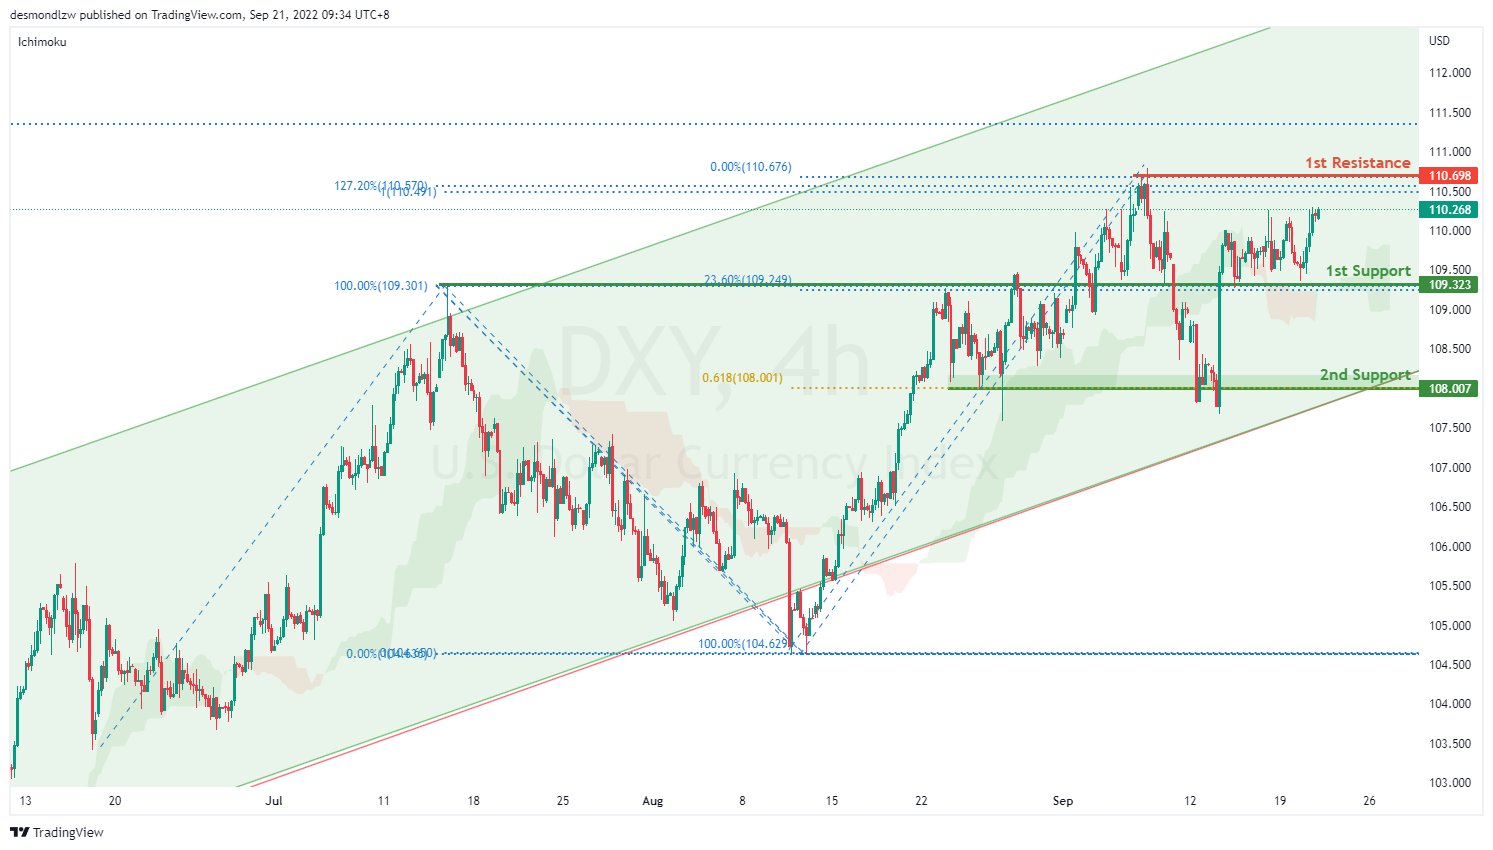
DXY:
On the H4, price is still respecting the bullish channel and has failed to break the first support- we are bullish bias. Price has bounced off the first support at 109.323 where the 23.6% retracement sits. If bullish momentum continues, it should bring price toward the first resistance at 110.698 levels where the 127.2% extension and previous swing high sits. Alternatively, it could break the first support to bring price to the second support at 108.007 where the 61.8% projection, 50% retracement and previous swing low sits
Areas of consideration:
- H4 time frame, 1st resistance at 110.698
- H4 time frame, 1st support at 109.323
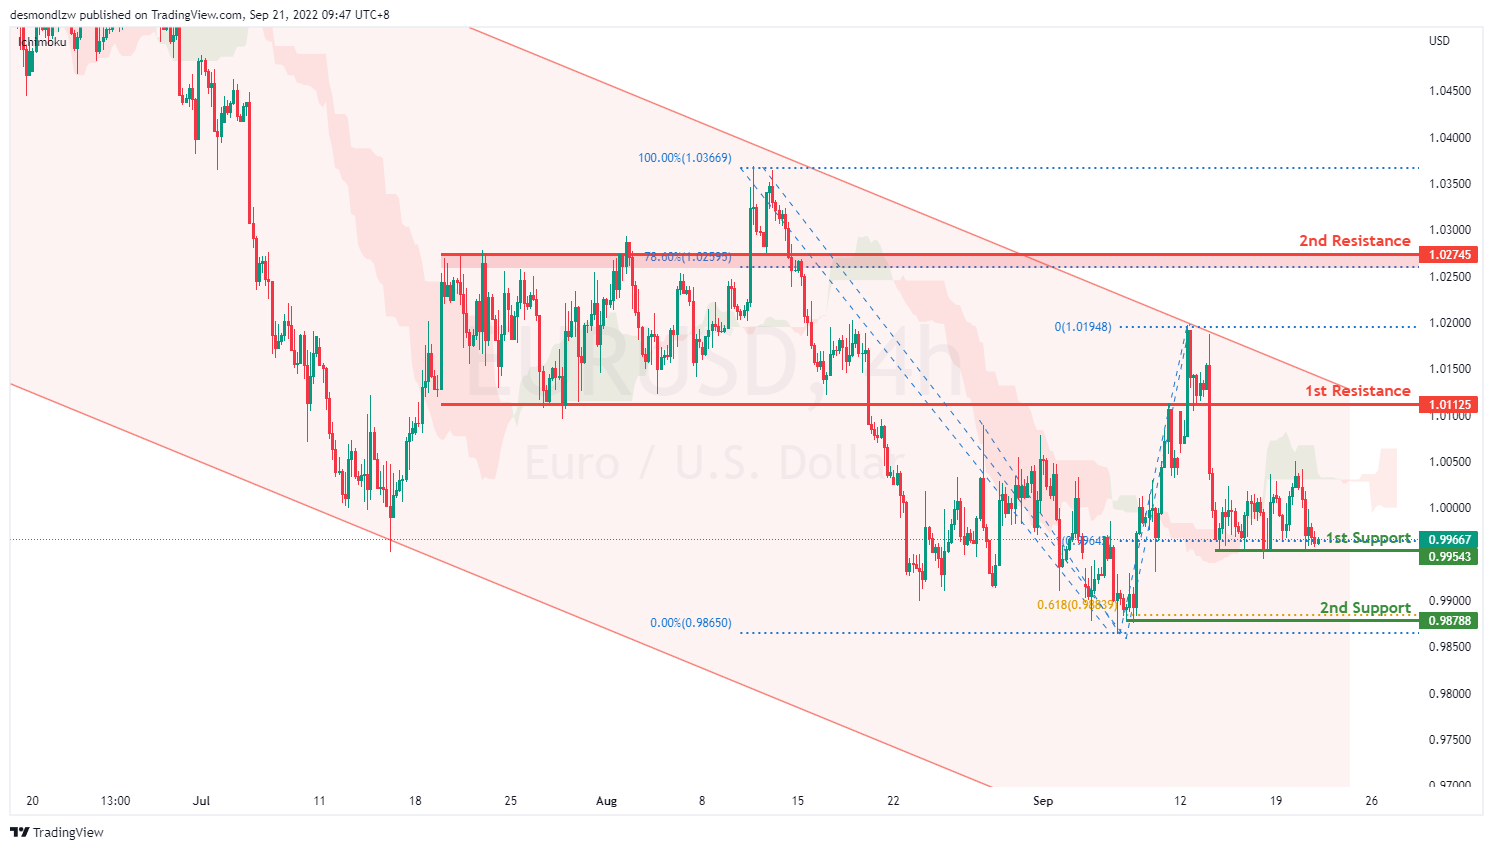
EUR/USD:
On the H4, price is moving within the channel, we are currently bullish bias as price fails to break the first support. Price is currently testing the first support at 0.9954 where the 100% projection and previous swing low sits. If price breaks this level, it will bring prices to the second support at 0.9878 where the 61.8% projection sits. Alternatively if bullish momentum continues, it should bring price to first resistance at 1.0112 level where the 50% retracement and previous swing low sits then to the second resistance at 1.0274 where the 78.6% retracement and previous swing high sits.
Areas of consideration :
- H4 1st resistance at 1.0112
- H4 1st support at 0.9954
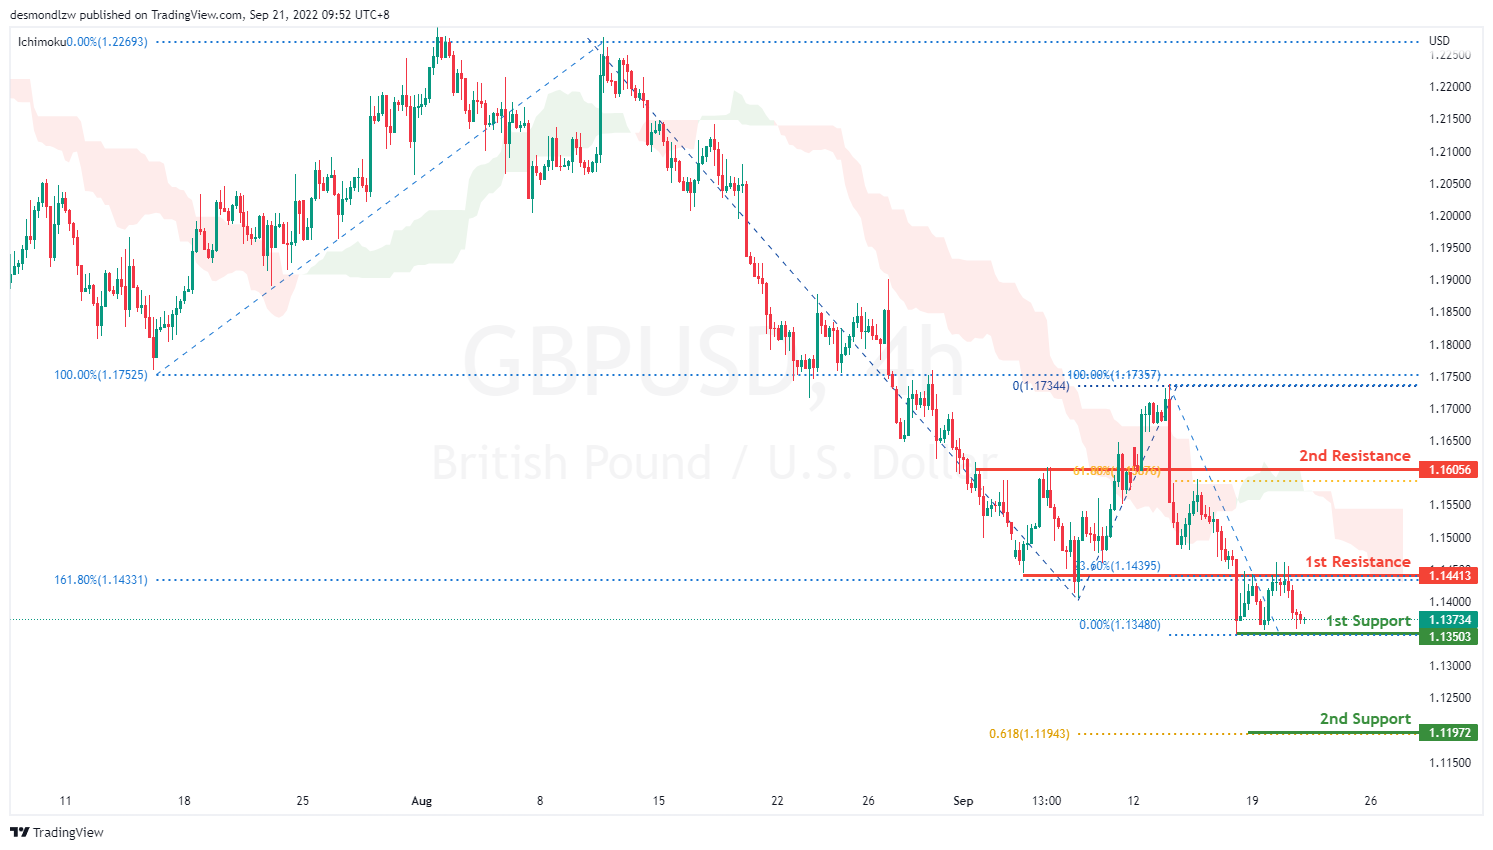
GBP/USD:
On the H4, prices are still moving in a bearish momentum hence we are bearish biassed. Prices have pulled back slightly but if bearish momentum continues, it should test the first support again at 1.1350 levels where the previous swing low sits then the second support at 1.1197 where the 161.8% extension and 61.8% projection sits. Alternatively, price could pull back to test the first resistance at 1.1441 where the 23.6% retracement and overlapping support sits then the second resistance at 1.1605 where the 61.8% retracement and previous swing high sits
Areas of consideration:
- H4 1st resistance at 1.1441
- H4 1st support at 1.1350
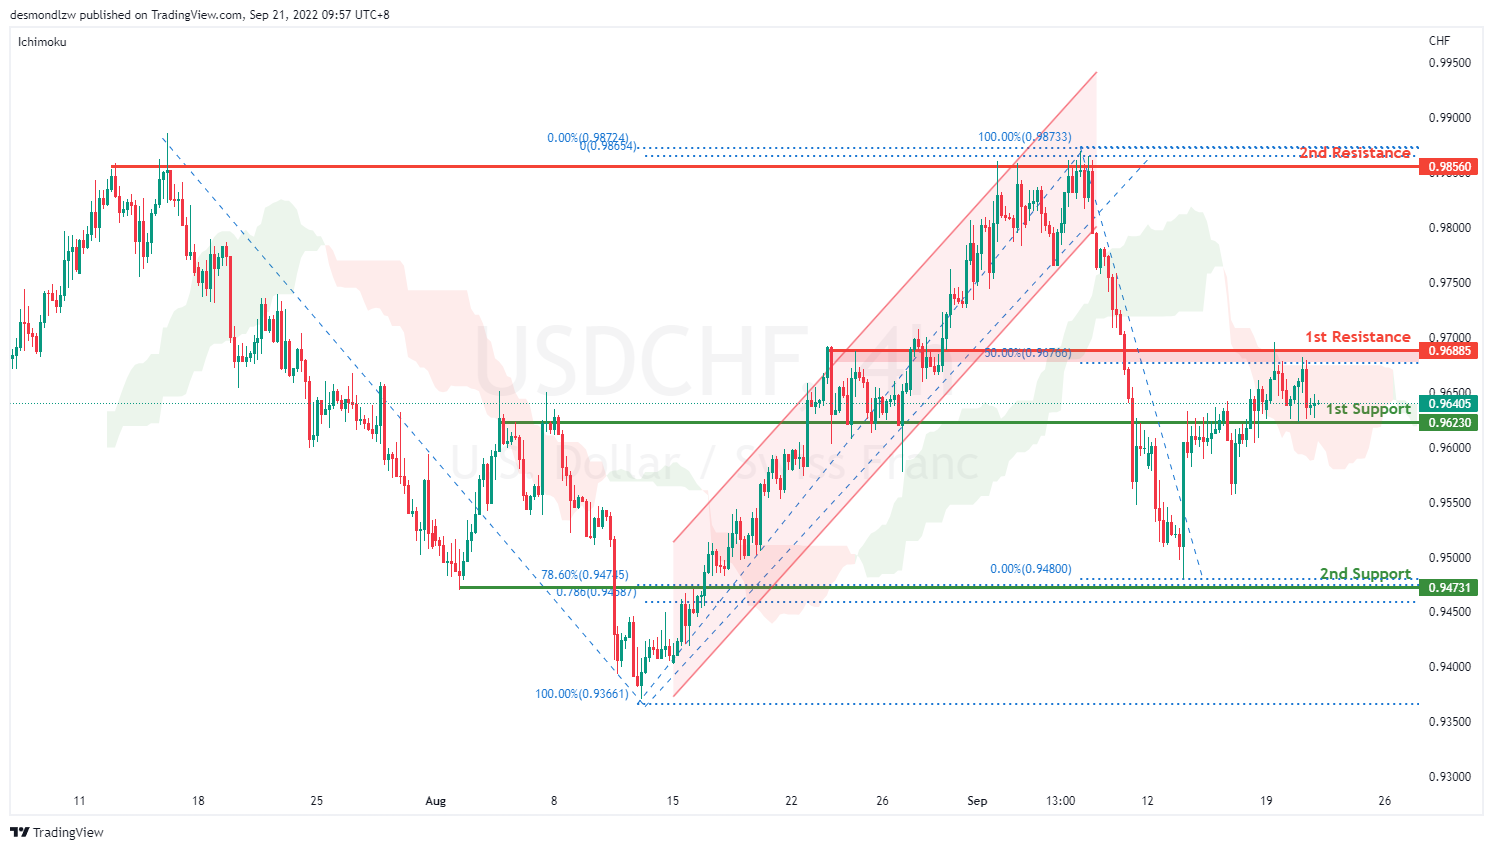
USD/CHF:
On the H4, prices have broken the ascending channel and we are currently bearish bias. Price is currently ranging and testing around the first support at 0.9623 where the overlapping resistance sits. If price continues with the bearish momentum, it should bring price to the second support at 0.9473 where the 78.6% projection and 78.6% retracement sits. Alternatively, price could pull back to test the first resistance at 0.9688 where the 50% retracement sits then the second support at 0.9856 where the swing high sits
Areas of consideration
- H4 1st support at 0.9623
- H4 1st resistance at 0.9688
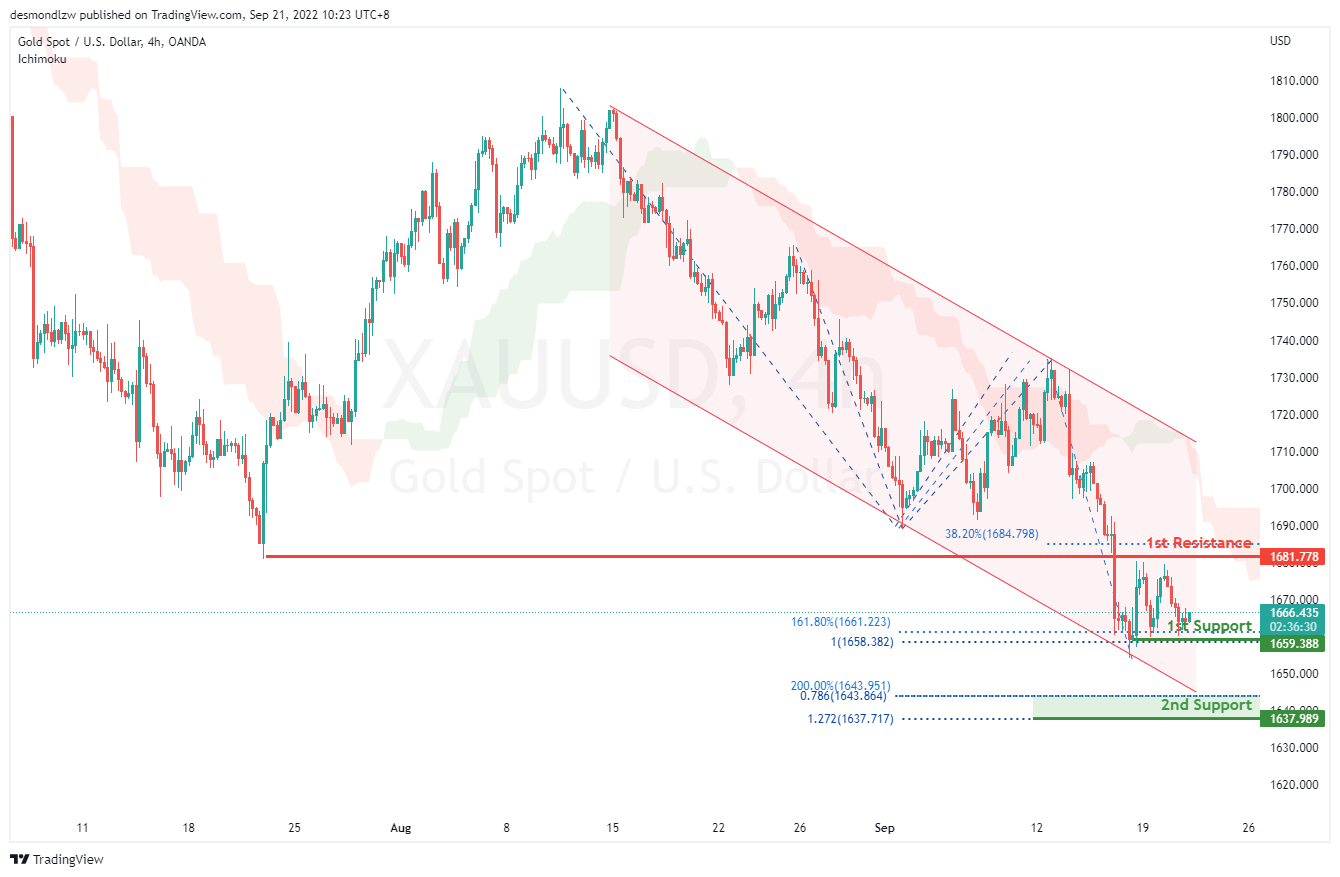
XAU/USD (GOLD):
On the H4, with the price moving within the descending channel and below ichimoku cloud, we have a bearish bias that the price may drop to the 1st support at 1659.388, which is in line with the 161.8% fibonacci extension and 100% fibonacci projection. If the 1st support is broken, we can expect the price to drop to the 2nd support at 1637.989, which is in line with the 78.6% fibonacci projection, 127.2% fibonacci extension and 200% fibonacci extension. Alternatively, the price may test the 1st resistance at 1681.778, which is in line with the overlap resistance and 38.2% fibonacci retracement.
Areas of consideration:
- H4 time frame, 1st support at 1659.388
- H4 time frame, 2nd support at 1637.989
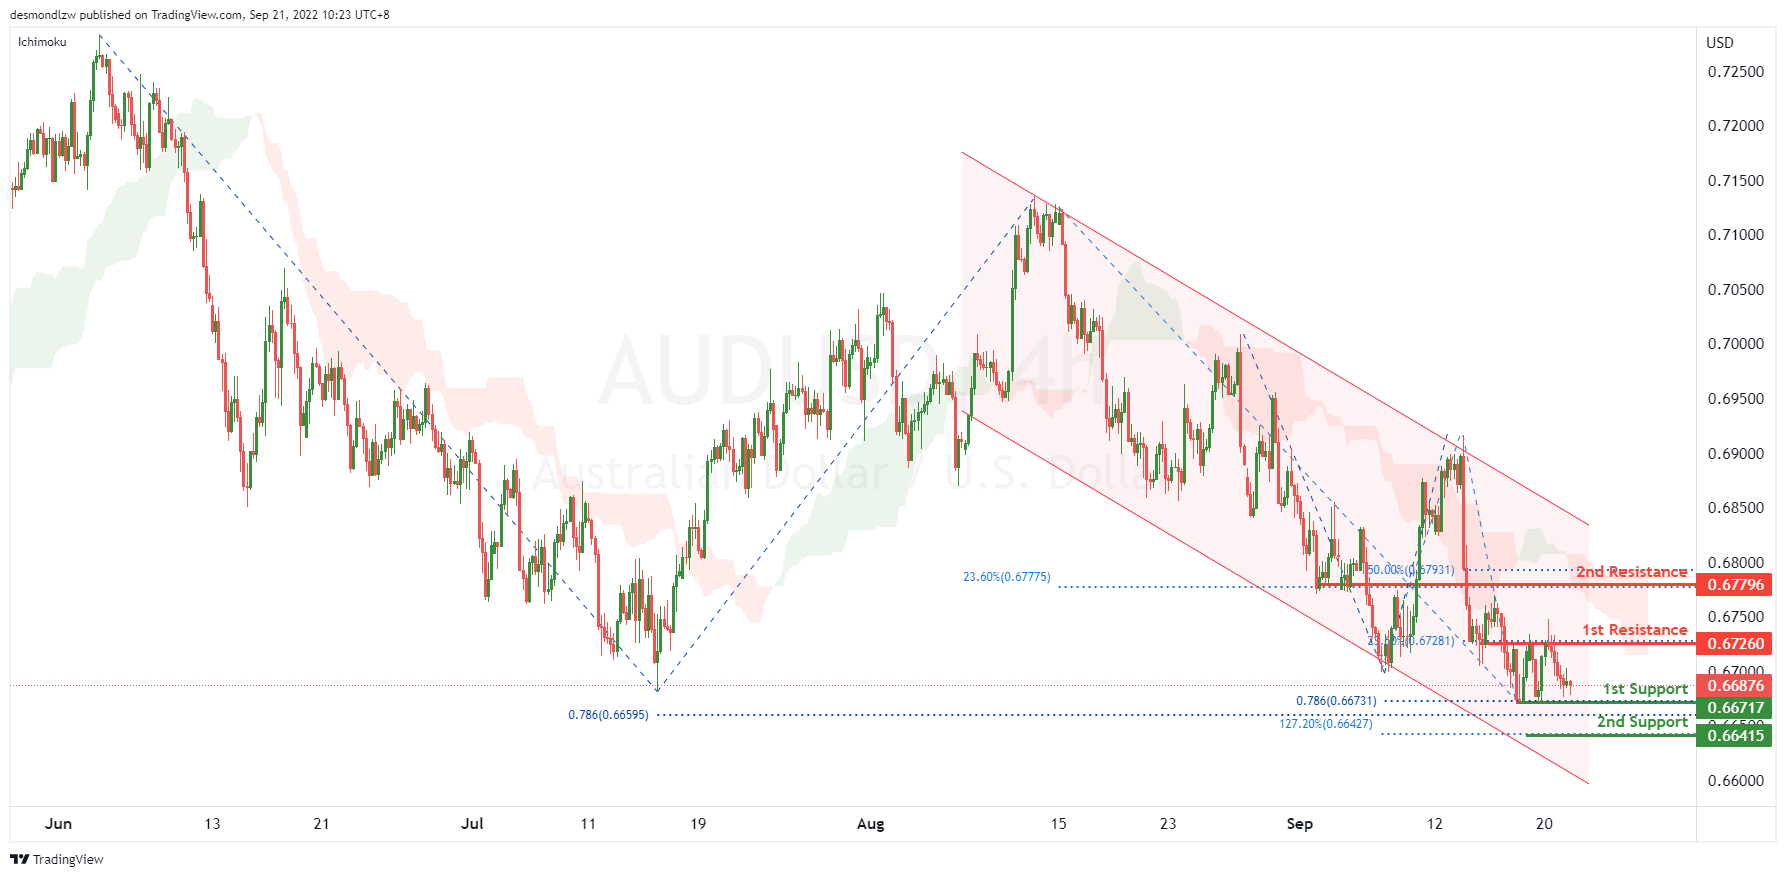
AUD/USD:
On the H4, with the price moving within the descending trendline and below ichimoku cloud, we have a bearish bias that the price may drop to the 1st support at 0.66717, which is in line with the swing low, 78.6% fibonacci projections. If the 1st support is broken, the 2nd support could be at 0.66415, where the 127.2% fibonacci extension. Alternatively, the price may rise to the 1st resistance at 0.67260, where the 23.6% fibonacci retracement is. If the 1st resistance is broken, the 2nd resistance could be at 0.67796, where the 50% fibonacci retracement and 23.6% fibonacci retracement are.
Areas of consideration
- H4, 1st support at 0.66717
- H4, 2nd support be at 0.66415
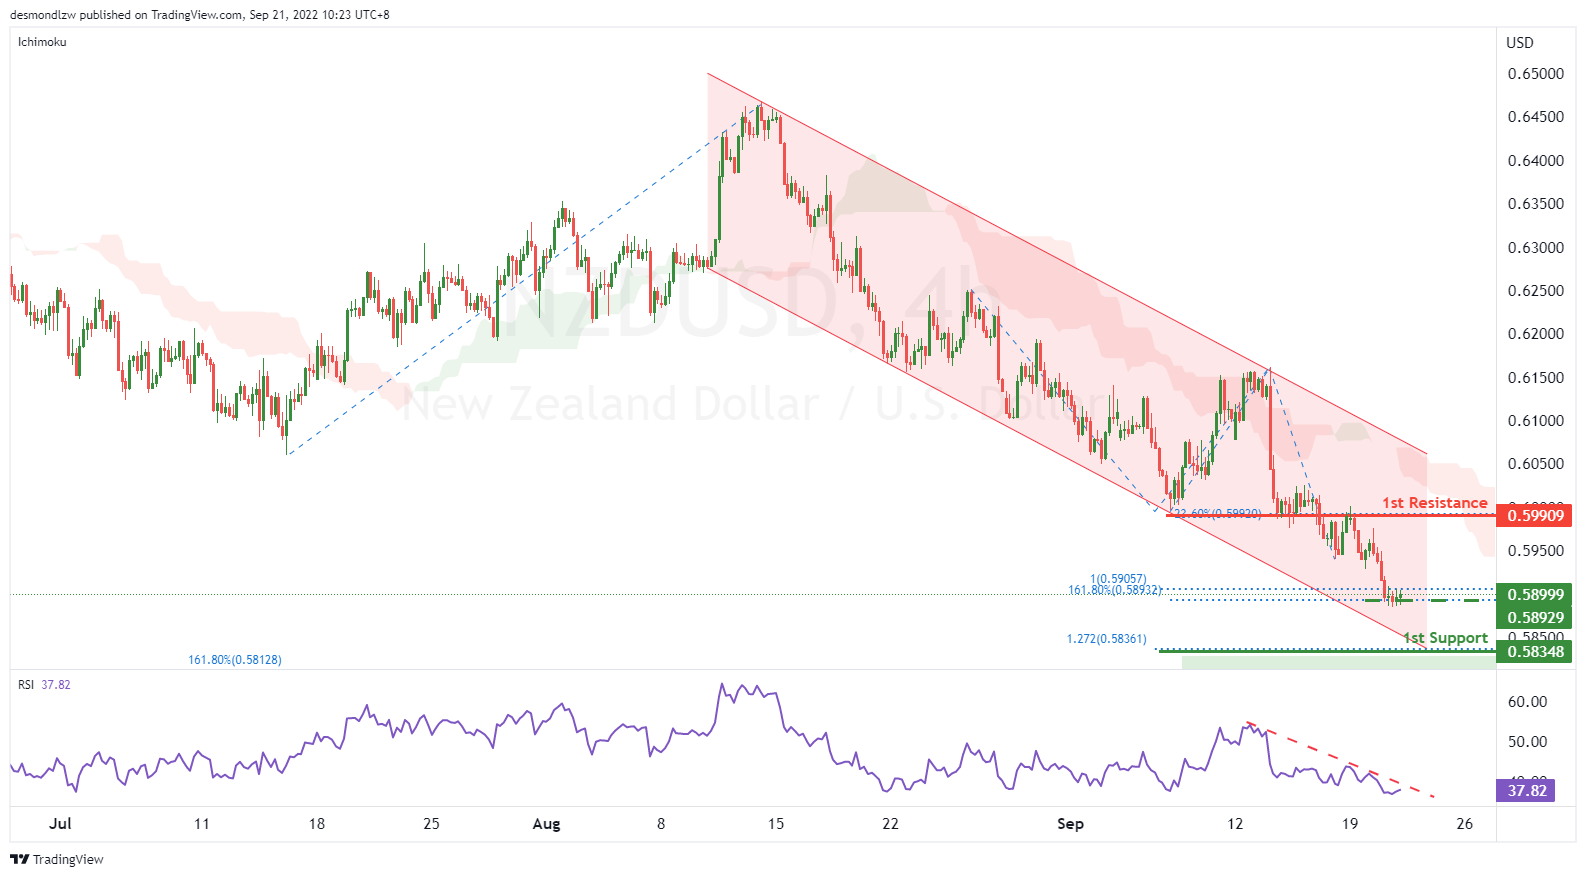
NZD/USD:
On the H4, with the price moving within the descending channel, below ichimoku cloud, RSI is showing a descending trendline. If the price can break the previous key support level at 0.58929, which is in line with the 100% fibonacci projection and 161.8% fibonacci retracement successfully, we can expect the price drop to the 1st support at 0.58348, which is in line with the 127.2% fibonacci extension and 161.8% fibonacci retracement. Alternatively, the price may pull back to the 1st resistance at 0.59909, where the 23.6% fibonacci retracement and overlap resistance are.
Areas of consideration:
- H4 time frame, current price
- H4 time frame, 1st support at 0.58348
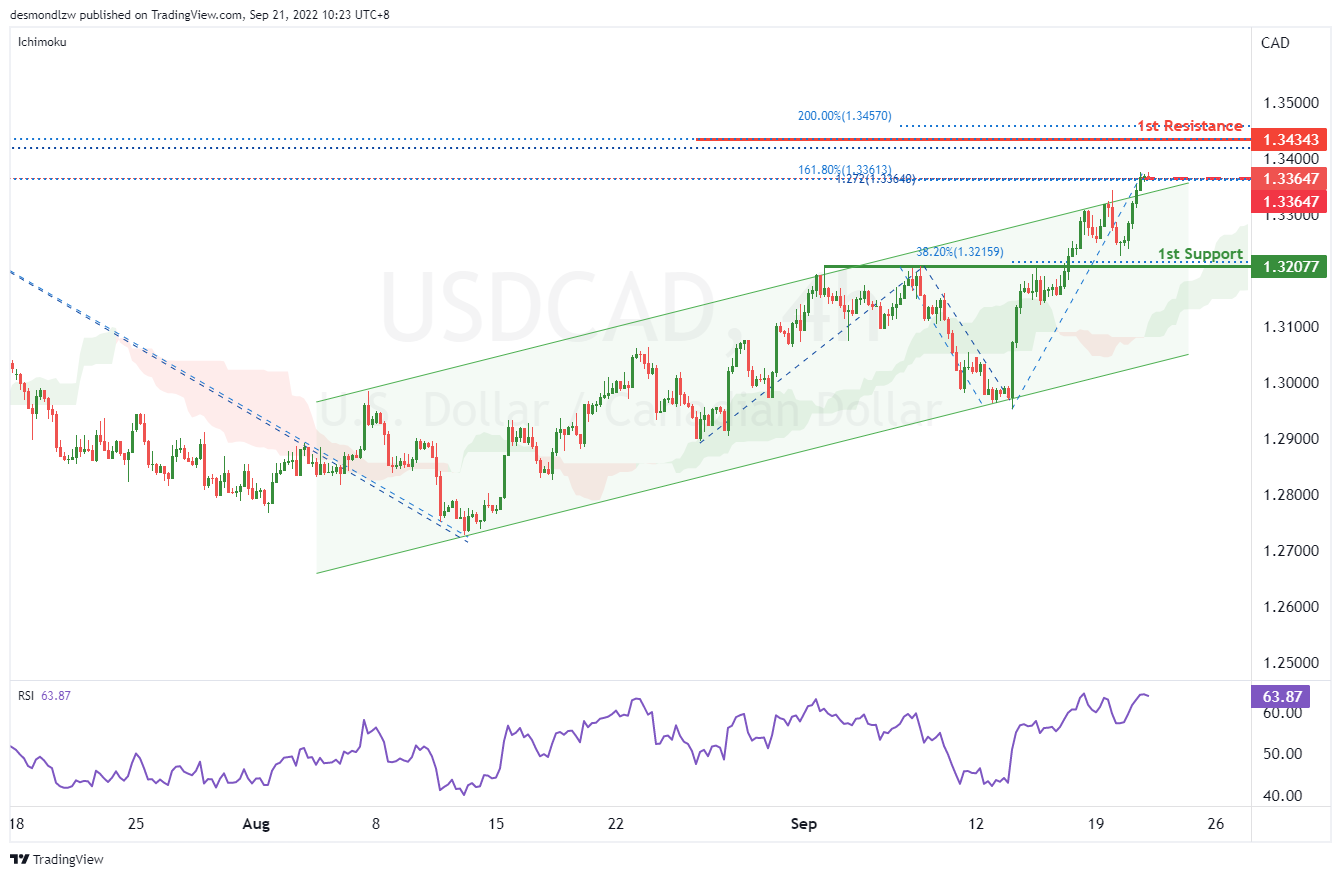
USD/CAD:
On the H4, with the price breaking the ascending channel and testing the previous key resistance at 1.33640, which is in line with the 127.2% fibonacci extension and 161.8% fibonacci projection. If the price can break this level successfully, we can expect the price to rise to the 1st resistance at 1.34343, where the 100% fibonacci projection, 127.2% fibonacci extension and 141.4% fibonacci extension are. Alternatively, as the price may pull back from the key resistance level and drop to the 1st support at 1.32077, which is in line with the 38.2% fibonacci retracement.
Areas of consideration:
- H4 time frame, current price
- H4 time frame, 1st resistance at 1.34343
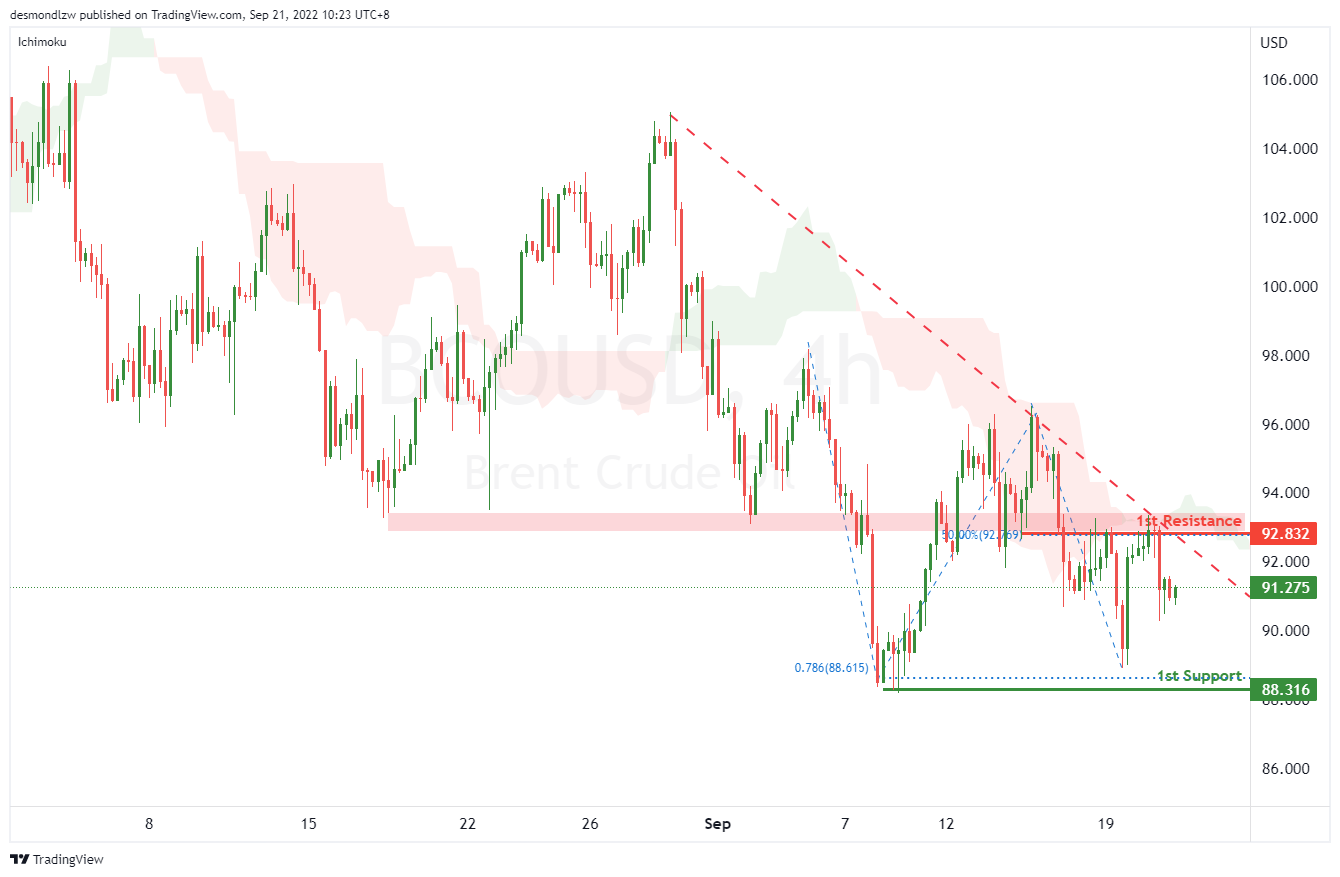
OIL:
On the H4, with the price moving within the descending trendline and below ichimoku cloud, we have a bearish bias that the price may drop to the 1st support at 88.316, where the 78.6% fibonacci projection and swing low are. Alternatively, the price may pull back and rise to test the 1st resistance at 92.832, which is in line with the 50% fibonacci retracement and overlap resistance.
Areas of consideration:
- H4 time frame, current price
- H4 time frame, 1st support at 88.316
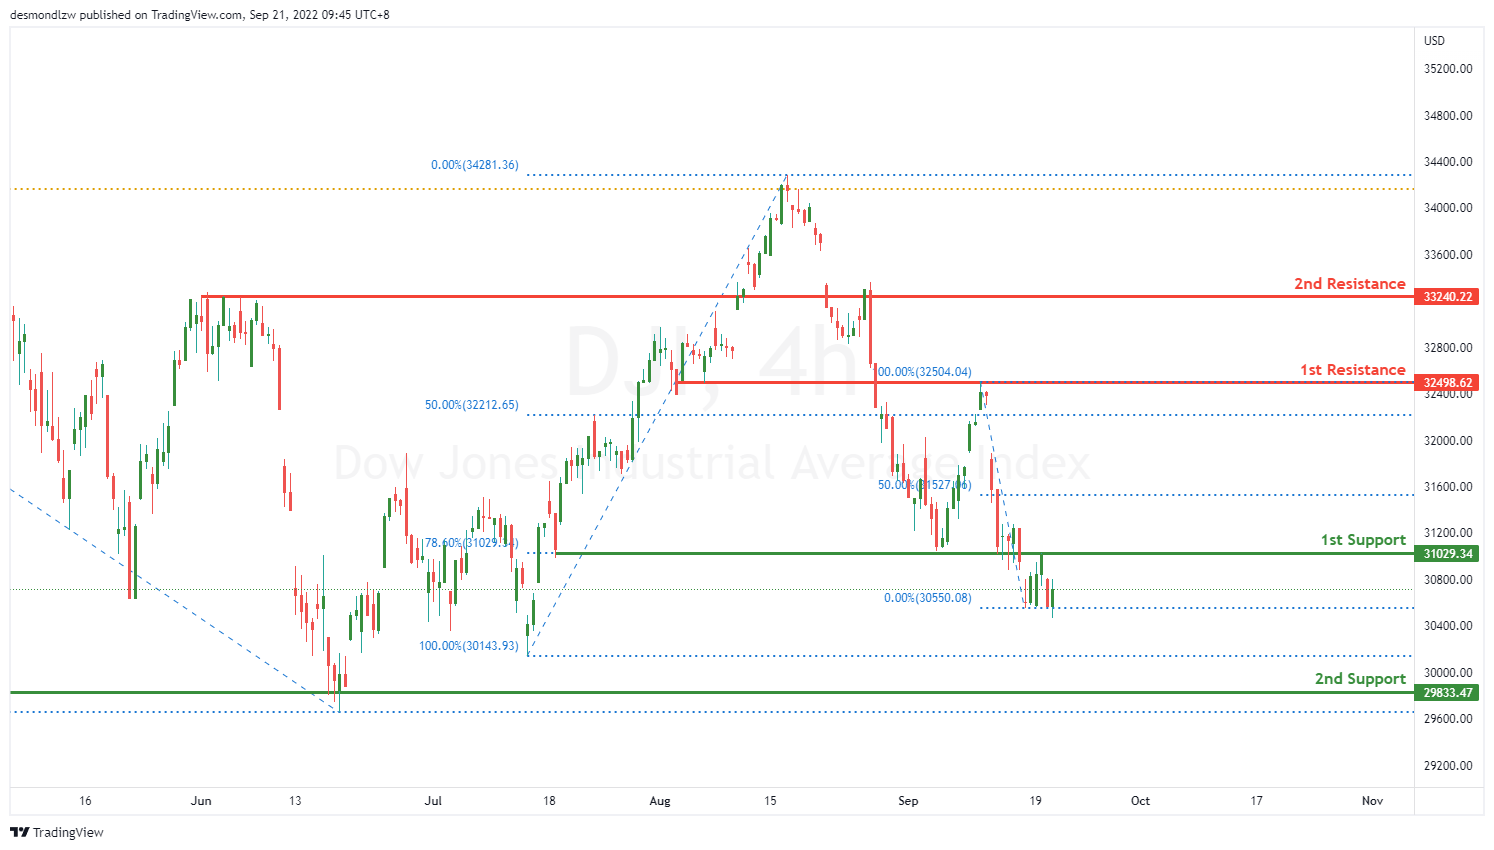
Dow Jones Industrial Average:
On the H4, price is reflected off nicely at the first resistance at 32500.85 where the 50% Fibonacci retracement is and broke right through the first support at 31029.34 where the 78.6% Fibonacci retracement is. Price might continue heading downwards towards the second support at 29833.47 where the previous swing low is.
Areas of consideration:
- H4 time frame, 1st support at 31029.34
- H4 time frame, 2nd support at 29833.47
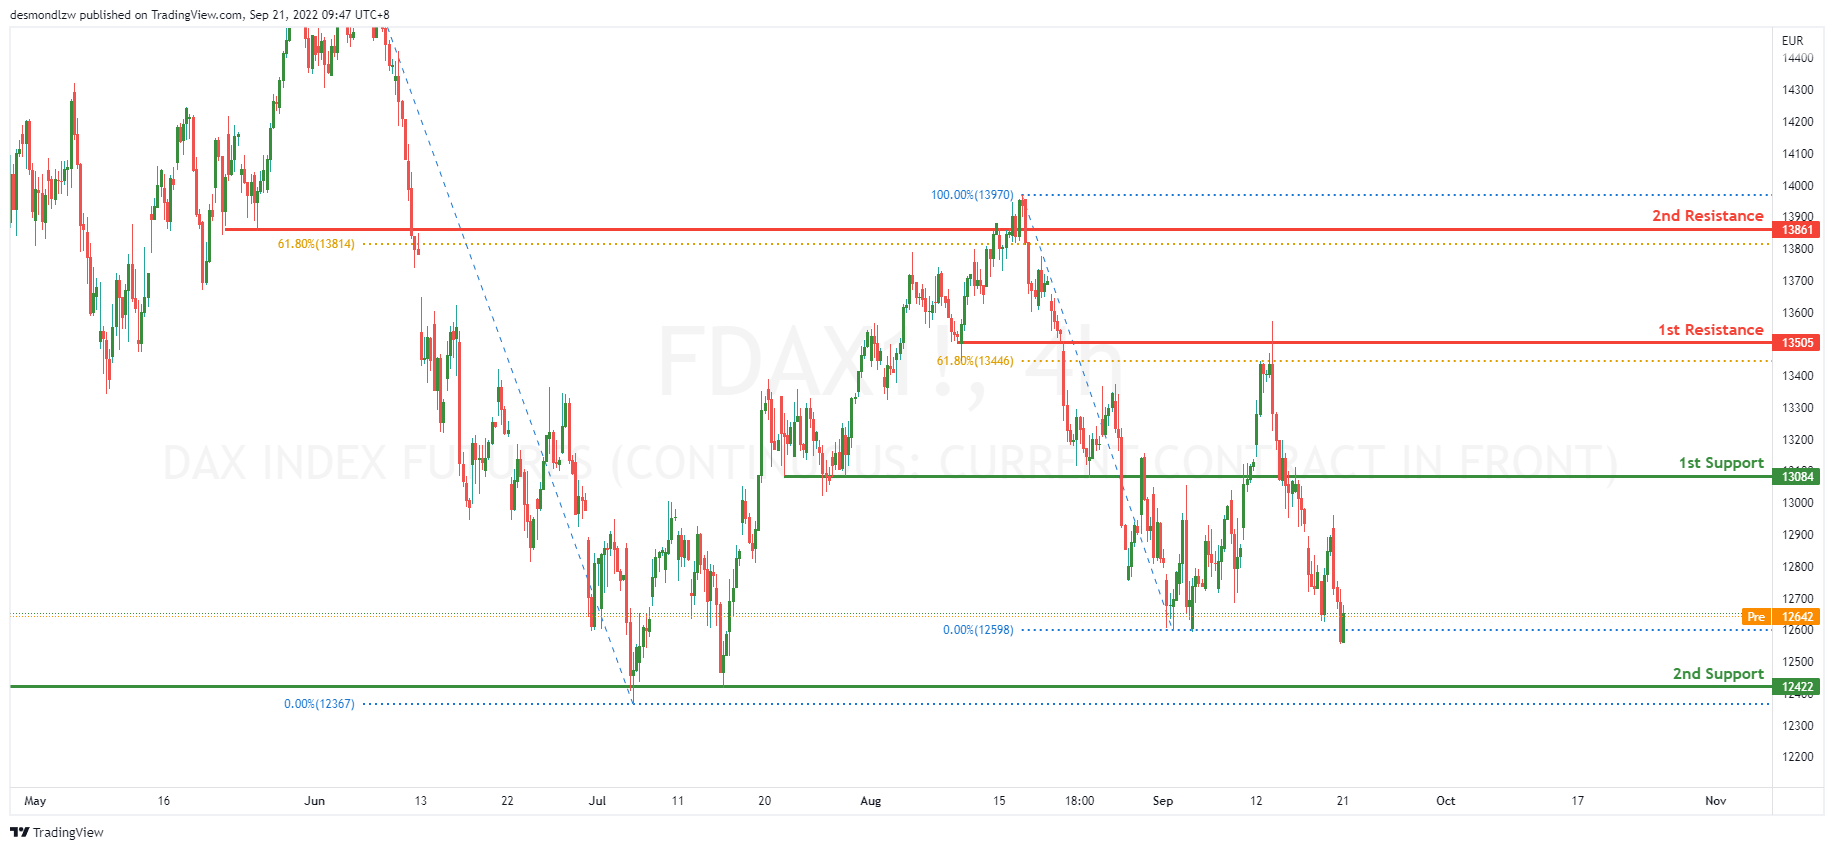
DAX:
On the H4, price has reflected of the first resistance at 13505 where the 61.8% retracement is and got a big reaction breaking through the first support at 13084. Price might continue going down towards the second support at 12422 where the swing low is.
Areas of consideration:
- H4 time frame, 1st support at 13084
- H4 time frame, 2nd support at 12422
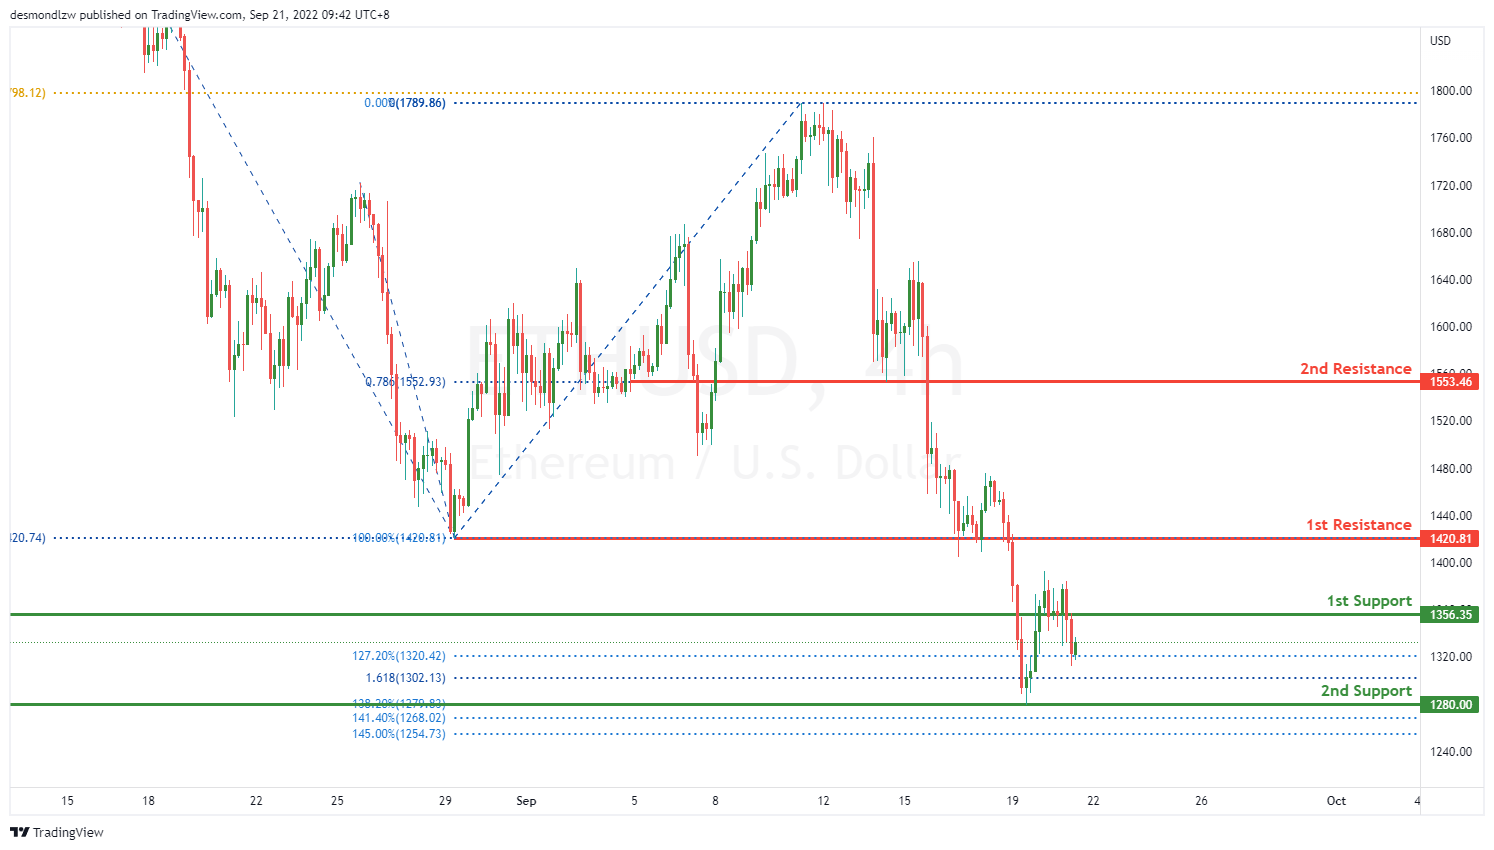
ETHUSD:
On the H4, price has pushed through the 1st Resistance at 1420.81 where the previous swing low sat. Price has also pushed through the 1st support at 1356.35 where the 127.2% Fibonacci extension lies and reflected off the second support at 1281.37 where the 138.2% Fibonacci Extension lies. Price could possible head back down below the second support and head lower.
Areas of consideration:
- H4 time frame, 1st resistance of 1420.81
- H4 time frame, 1st support at 1356.35
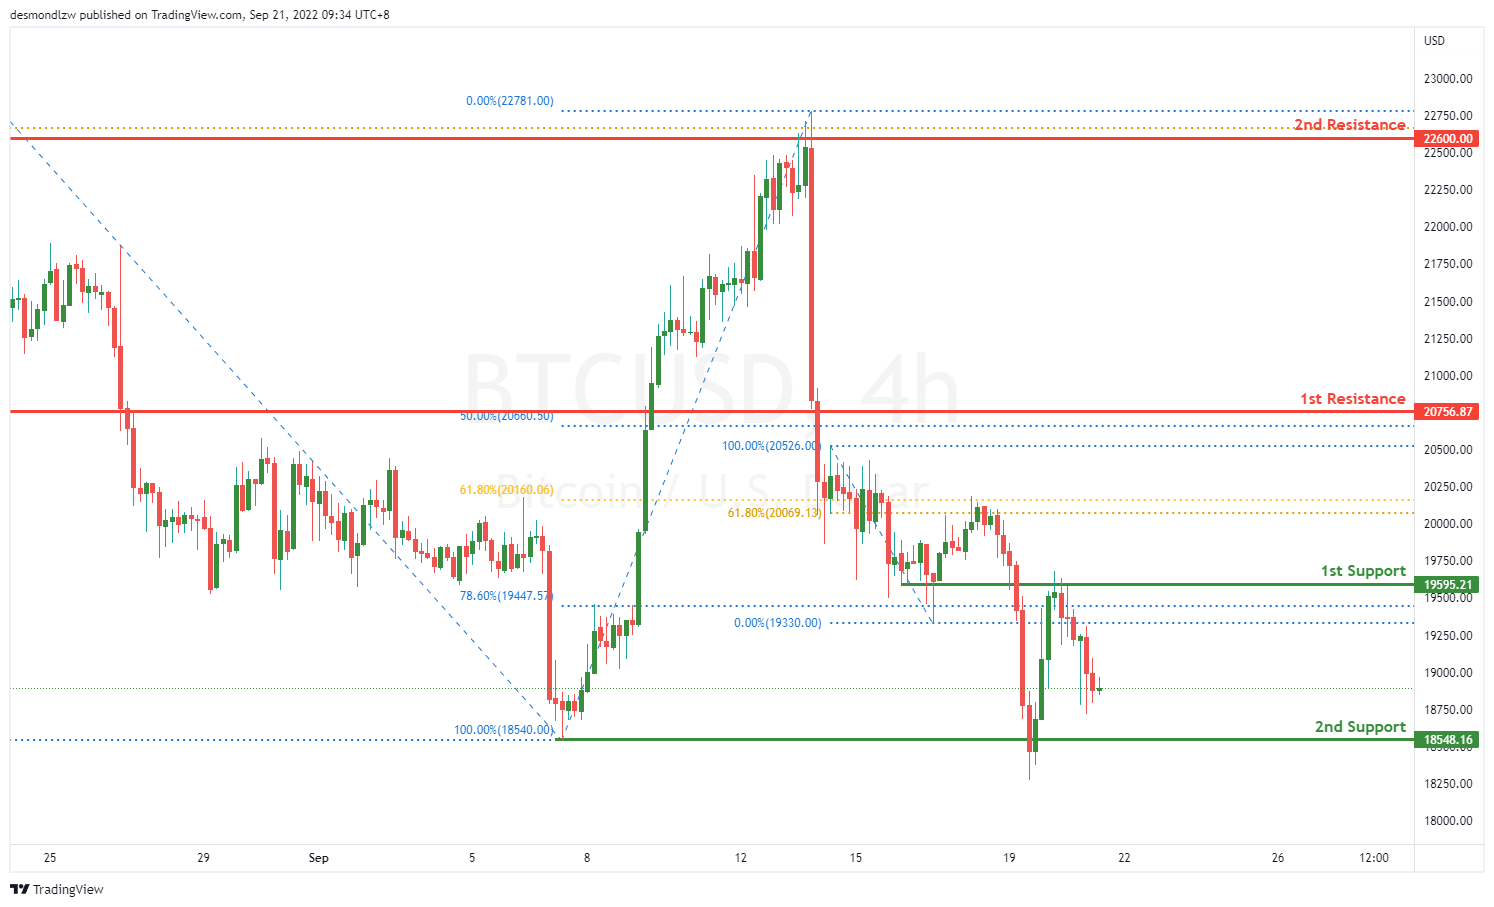
BTCUSD:
On the H4, price has broke through the second support 18540.00 where the previous swing low sits and reflected back up above the first support at 19557.00 where the 78.6% Fibonacci retracement sits. Price could possibly head back back to the second support area where the previous swing low is.
Areas of consideration:
- H4 time frame, 1st resistance of 22600.00
- H4 time frame, 1st support at 19557.00
S&P 500:
On the H4, the price reversed from the 4100 price area forming a bearish channel, with the price falling towards the 1st support are of 3900. With our bearish bias still valid, as price trades back towards the 61.8% Fibonacci retracement, look for price to test the 1st support area. Price has broken below the 1st support level, the price could fall towards the 78.6% Fibonacci retracement level of 3784.19. As the price falls towards the 2nd support, it could find some pullback towards the 78.6% Fibonacci retracement pullback support area.
Areas of consideration:
- H4 time frame, 1st support at 3900
- H4 time frame, 2nd support at 3636.87

The accuracy, completeness and timeliness of the information contained on this site cannot be guaranteed. IC Markets does not warranty, guarantee or make any representations, or assume any liability regarding financial results based on the use of the information in the site.
News, views, opinions, recommendations and other information obtained from sources outside of www.icmarkets.com.au, used in this site are believed to be reliable, but we cannot guarantee their accuracy or completeness. All such information is subject to change at any time without notice. IC Markets assumes no responsibility for the content of any linked site.
The fact that such links may exist does not indicate approval or endorsement of any material contained on any linked site. IC Markets is not liable for any harm caused by the transmission, through accessing the services or information on this site, of a computer virus, or other computer code or programming device that might be used to access, delete, damage, disable, disrupt or otherwise impede in any manner, the operation of the site or of any user’s software, hardware, data or property.