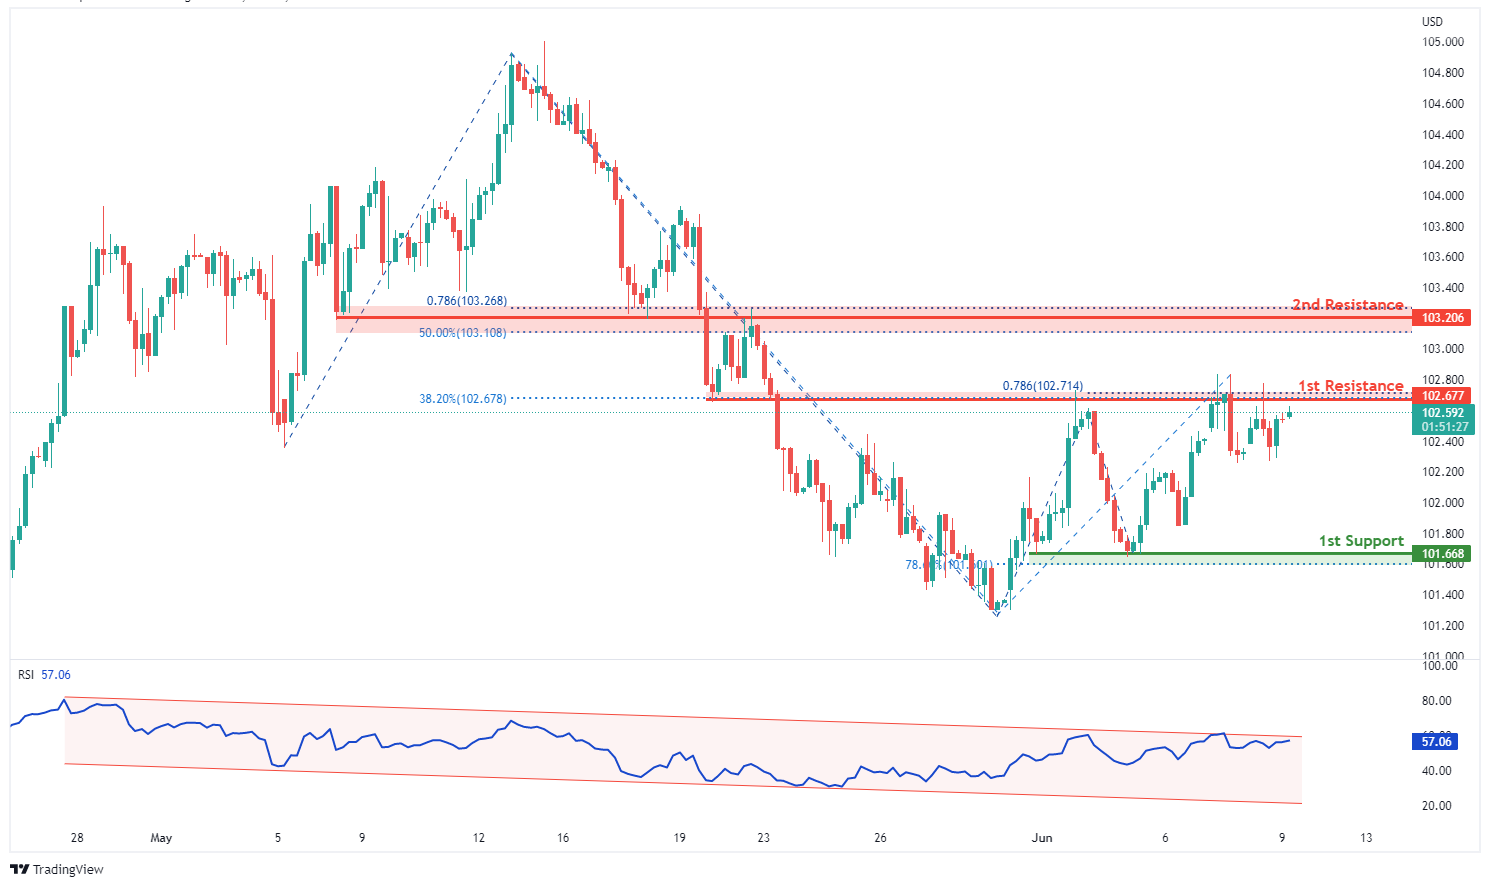
DXY:
On the H4, with RSI moving in a descending channel, we have a bearish bias that price will drop to our 1st support at 101.668 where the horizontal swing low support and 78.6% fibonacci retracement are from our 1st resistance at 102.677 in line with the horizontal overlap resistance, 38.2% fibonacci retracement and 78.6% fibonacci projection. Alternatively, price may break 1st resistance structure and head for 2nd resistance at 103.206 where the horizontal overlap resistance, 78.6% fibonacci projection and 50% fibonacci retracement are.
Areas of consideration:
- H4 time frame, 1st resistance at 102.677
- H4 time frame, 1st support at 101.668
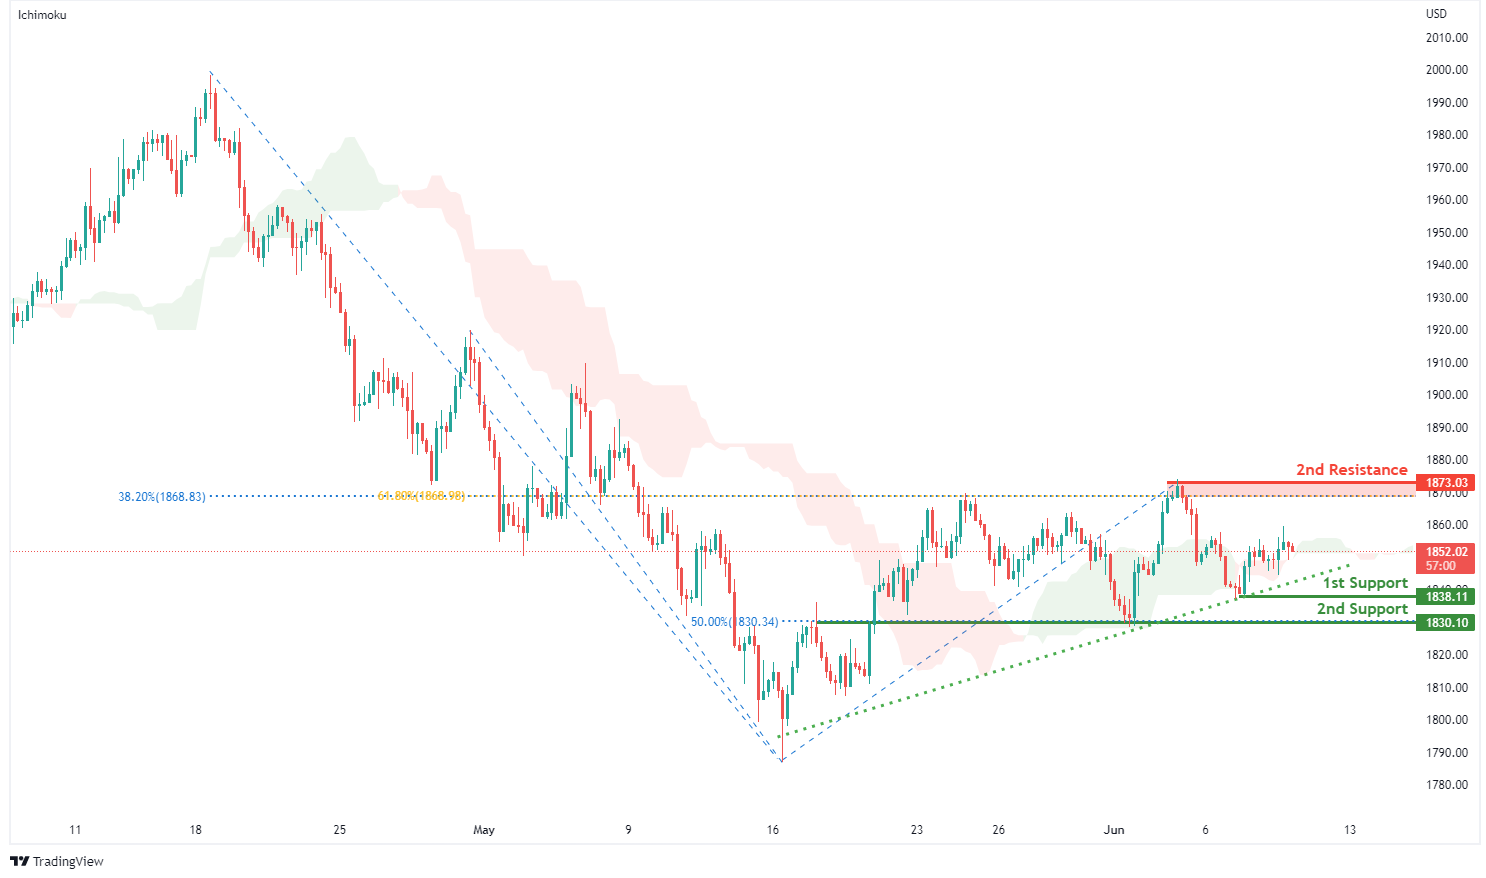
XAU/USD (GOLD):
On the H4, with prices bouncing off ichimoku indicator, we have a bullish bias that price will rise from our 1st support at 1838.11 where the horizontal swing low support is to our 1st resistance at 1873.03 in line with swing high resistance, 61.8% fibonacci retracement and 38.2% fibonacci retracement. Alternatively, price may break 1st support structure and head for 2nd support at 1830.10 in line with overlap support and 50% fibonacci retracement.
Areas of consideration:
- H4 time frame, 1st Resistance at 1873.03
- H4 time frame, 1st Support at 1838.11
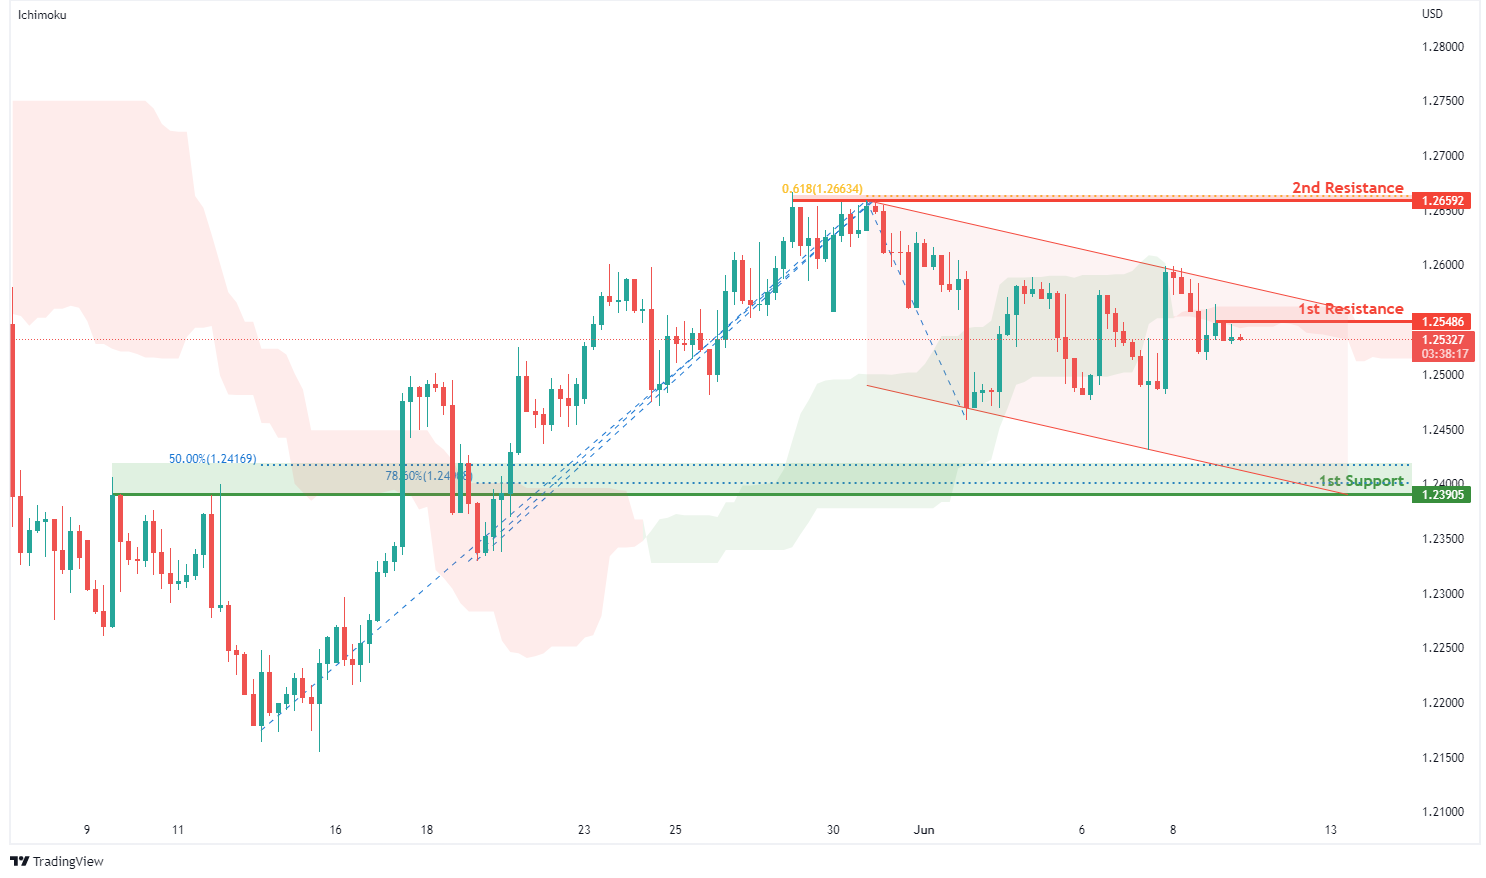
GBP/USD:
On the H4, with prices moving below the ichimoku indicator, we have a bearish bias that price will drop from our 1st resistance at 1.25486 where the horizontal swing high resistance is to our 1st support at 1.23905 in line with the 50% Fibonacci retracement, 78.6% fibonacci retracement and overlap support. Alternatively, price may break 1st resistance structure and head for 2nd resistance at 1.26592 where the horizontal swing high resistance and 61.8% fibonacci projection are.
Areas of consideration:
- H4 1st resistance at 1.25486
- H4 1st support at 1.23905
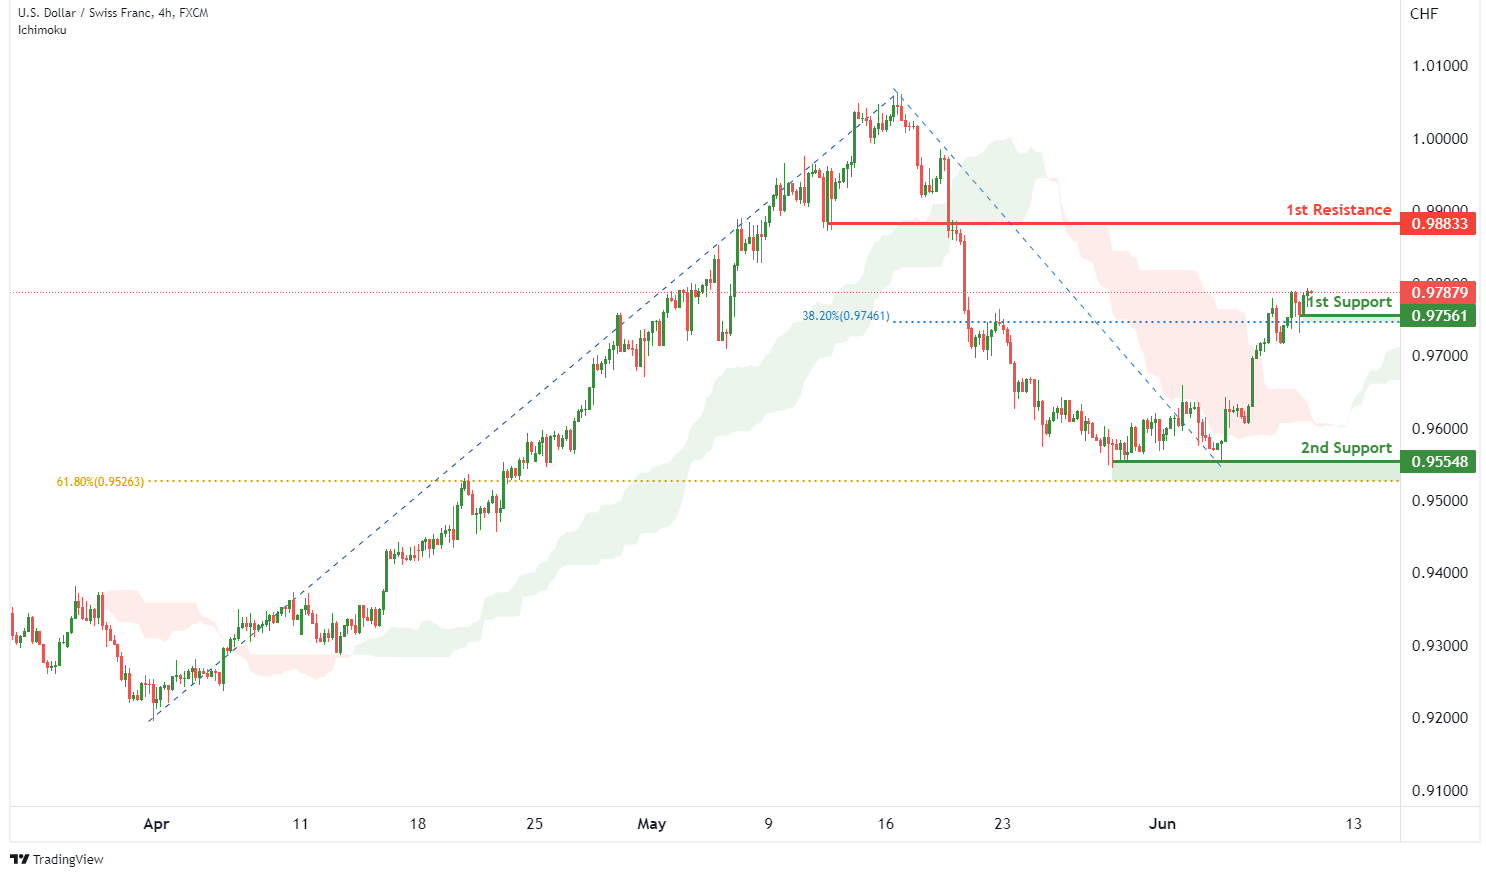
USD/CHF:
On the H4, with price moving above the ichimoku cloud, we have a bullish bias that price will rise to our 1st resistance at 0.98833 where the pullback resistance is from our 1st support at 0.97561 in line with the swing low support and 38.2% Fibonacci retracement. Alternatively, price may break 1st support structure and head for 2nd support at 0.95548 where the swing low support and 61.8% fibonacci retracement are..
Areas of consideration
- 1st support level at 0.97561
- 1st resistance level at 0.98833
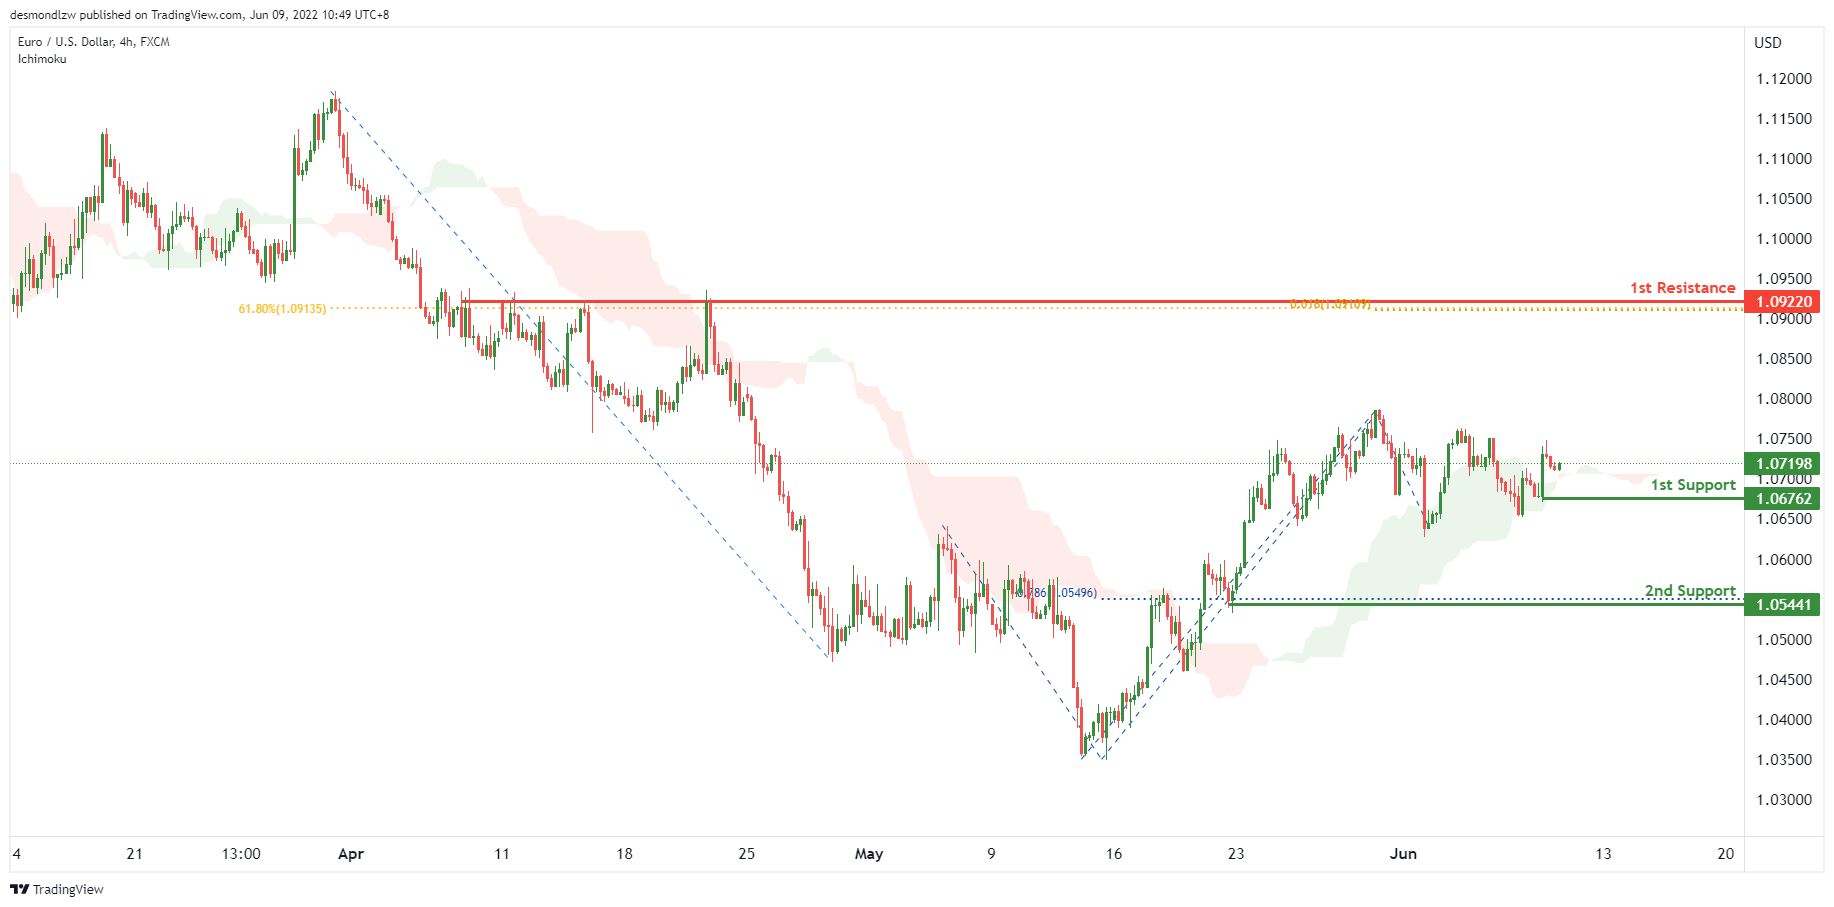
EUR/USD :
On the H4, with price bouncing off the ichimoku cloud, we have a bullish bias that price will rise from the 1st support at 1.06762 in line with the to the pullback support to the 1st resistance at 1.09220 in line with the 61.8% fibonacci retracement and 61.8% fibonacci projection. Alternatively, price may break support structure at the 1st support and drop to the 2nd support at 1.05441 at the swing low in line with the 78.6% fibonacci retracement.
Areas of consideration :
- H4 1st resistance at 1.09220
- H4 1st support at 1.06762
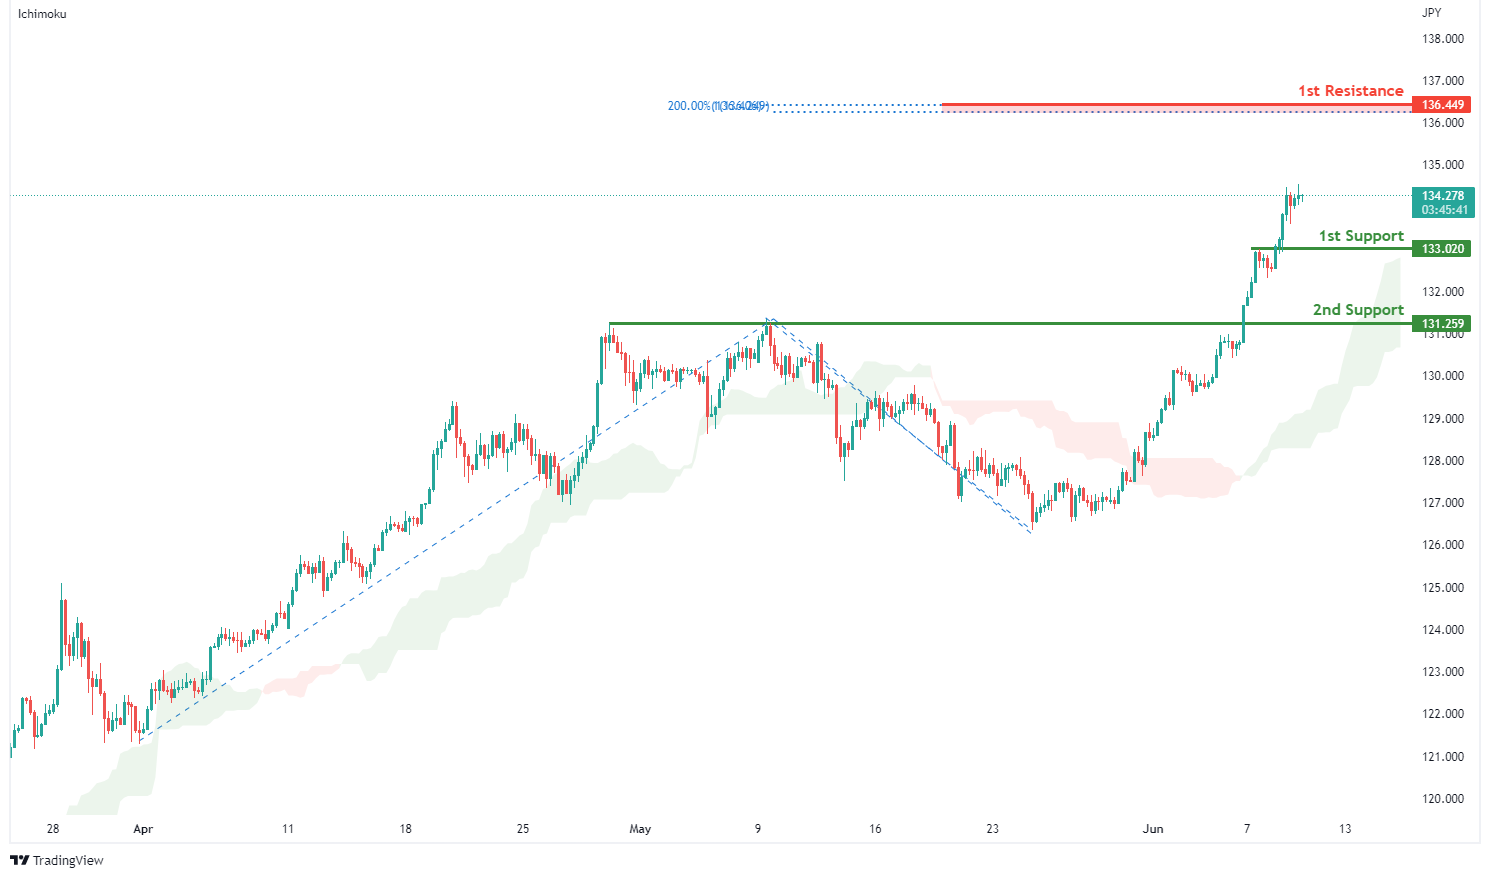
USD/JPY:
On the H4, with prices moving above the ichimoku indicator, we have a bullish bias that price will rise from our 1st support at 133.020 where the horizontal pullback support is to our 1st resistance at 136.449 in line with the 200% fibonacci extension and 100% fibonacci projection. Alternatively, price may break 1st support structure and head for 2nd support at 131.259 where the horizontal overlap support is.
Areas of consideration:
- H4 time frame, 1st resistance at 136.449
- H4 time frame, 1st support at 133.020
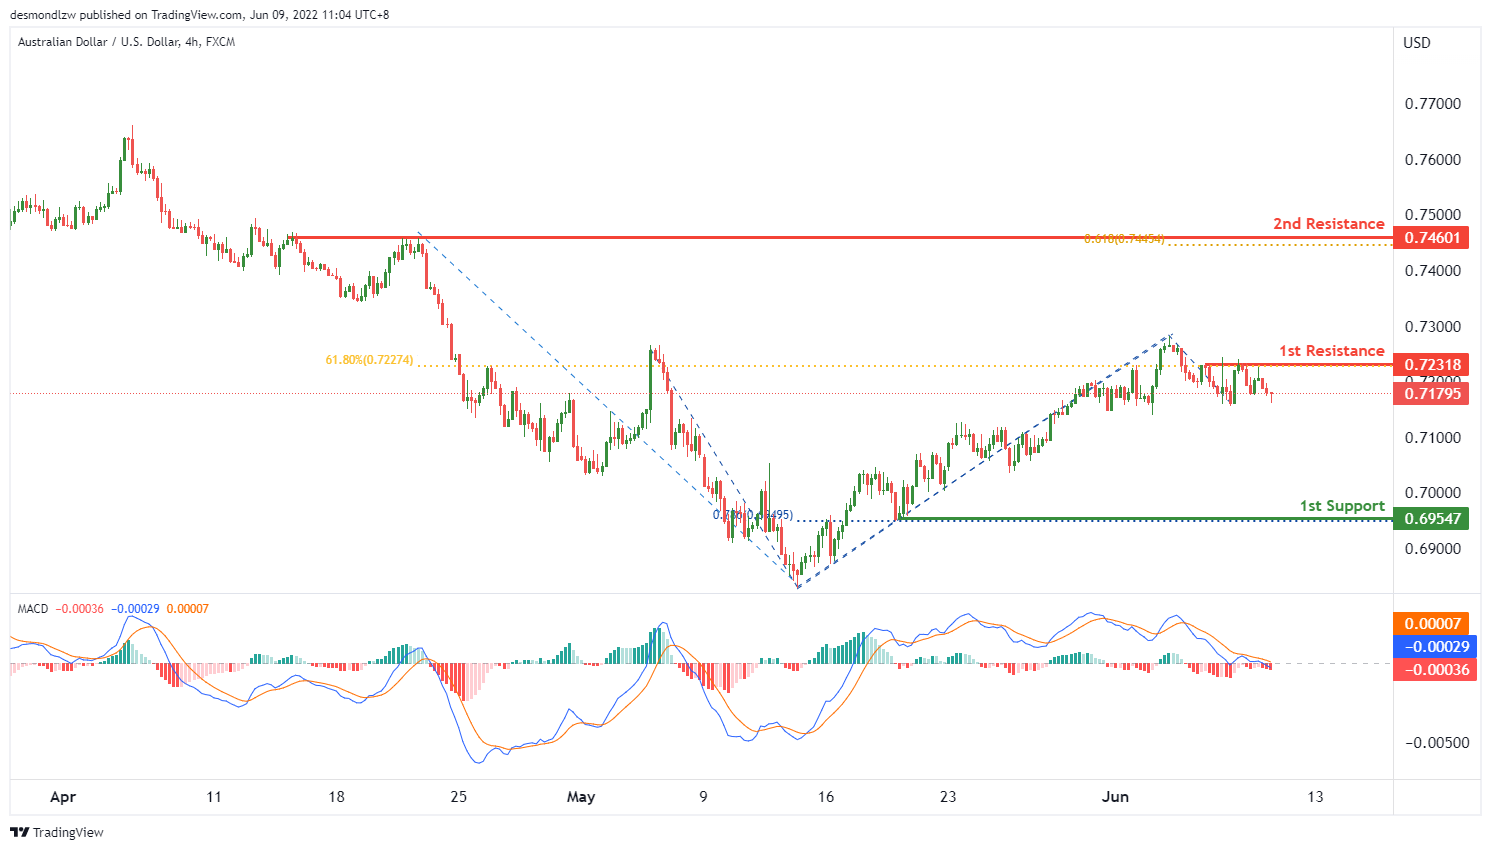
AUD/USD:
On the H4, with price moving into a bearish pressure area on the MACD indicator, we have a bearish bias that price will drop from the 1st resistance at 0.72318 at the multiple swing highs in line with the 61.8% fibonacci retracement to the 1st support at 0.69547 at the swing low in line with the 78.6% fibonacci projection. Alternatively, price may rise from the 1st resistance to the 2nd resistance at 0.74601 in line with the 61.8% fibonacci projection and multiple swing highs.
Areas of consideration
- H4 1st resistance at 0.72318
- H4 1st support at 0.69547
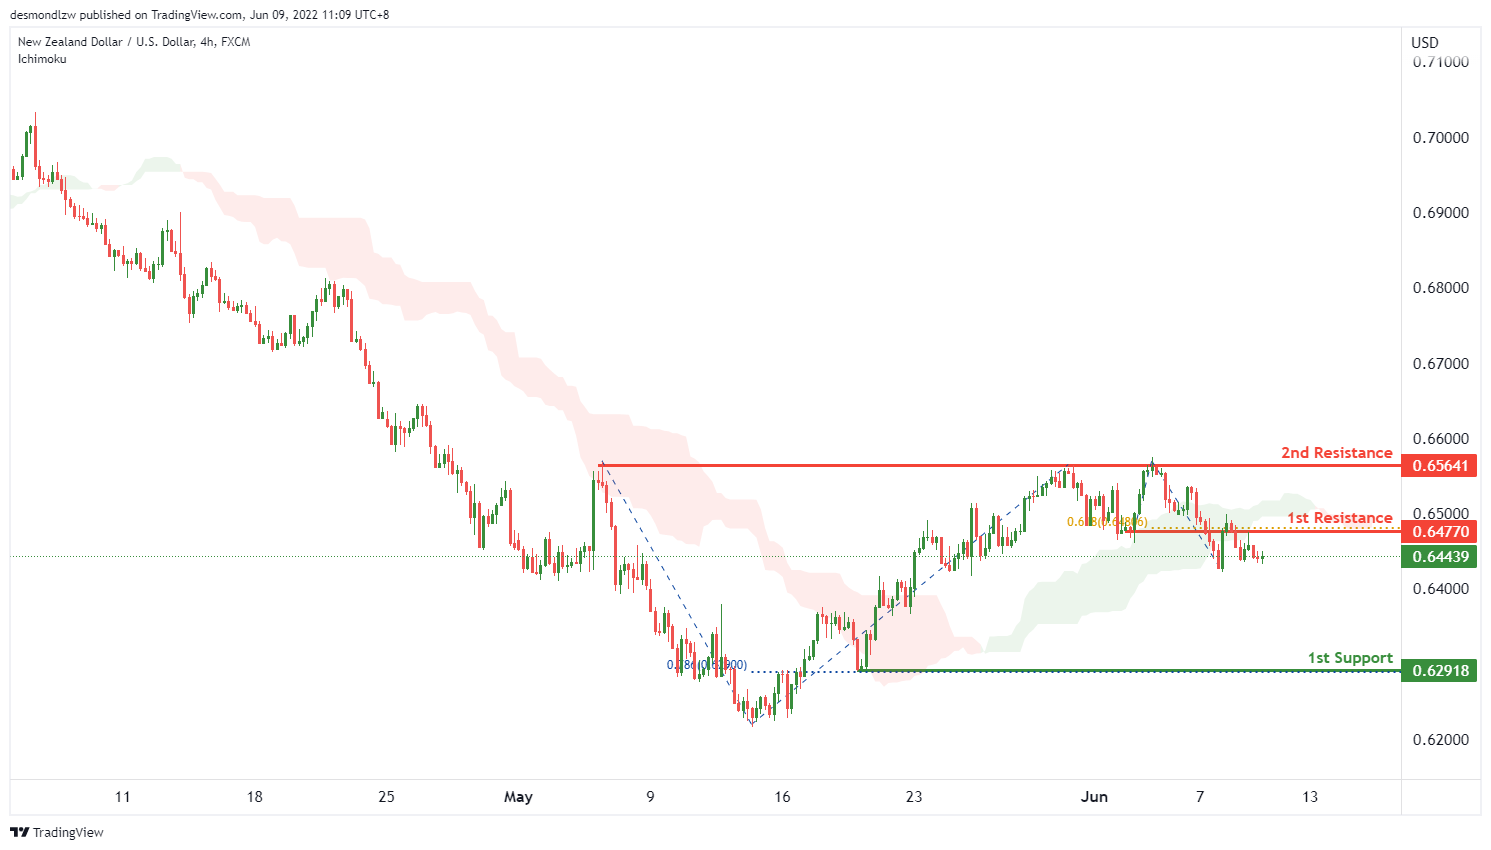
NZD/USD:
On the H4, with price moving below the ichimoku cloud, we have a bearish bias that price will drop from the 1st resistance at 0.64770 in line with the 61.8% fibonacci projection to the 1st support at 0.62918 in line with the 78.6% fibonacci retracement. Alternatively, price may bounce off the 1st resistance and rise to the 2nd resistance at 0.65641 in line with the overlap swing high.
Areas of consideration:
- H4 time frame, 1st support at 0.62918
- H4 time frame, 1st resistance at 0.64770
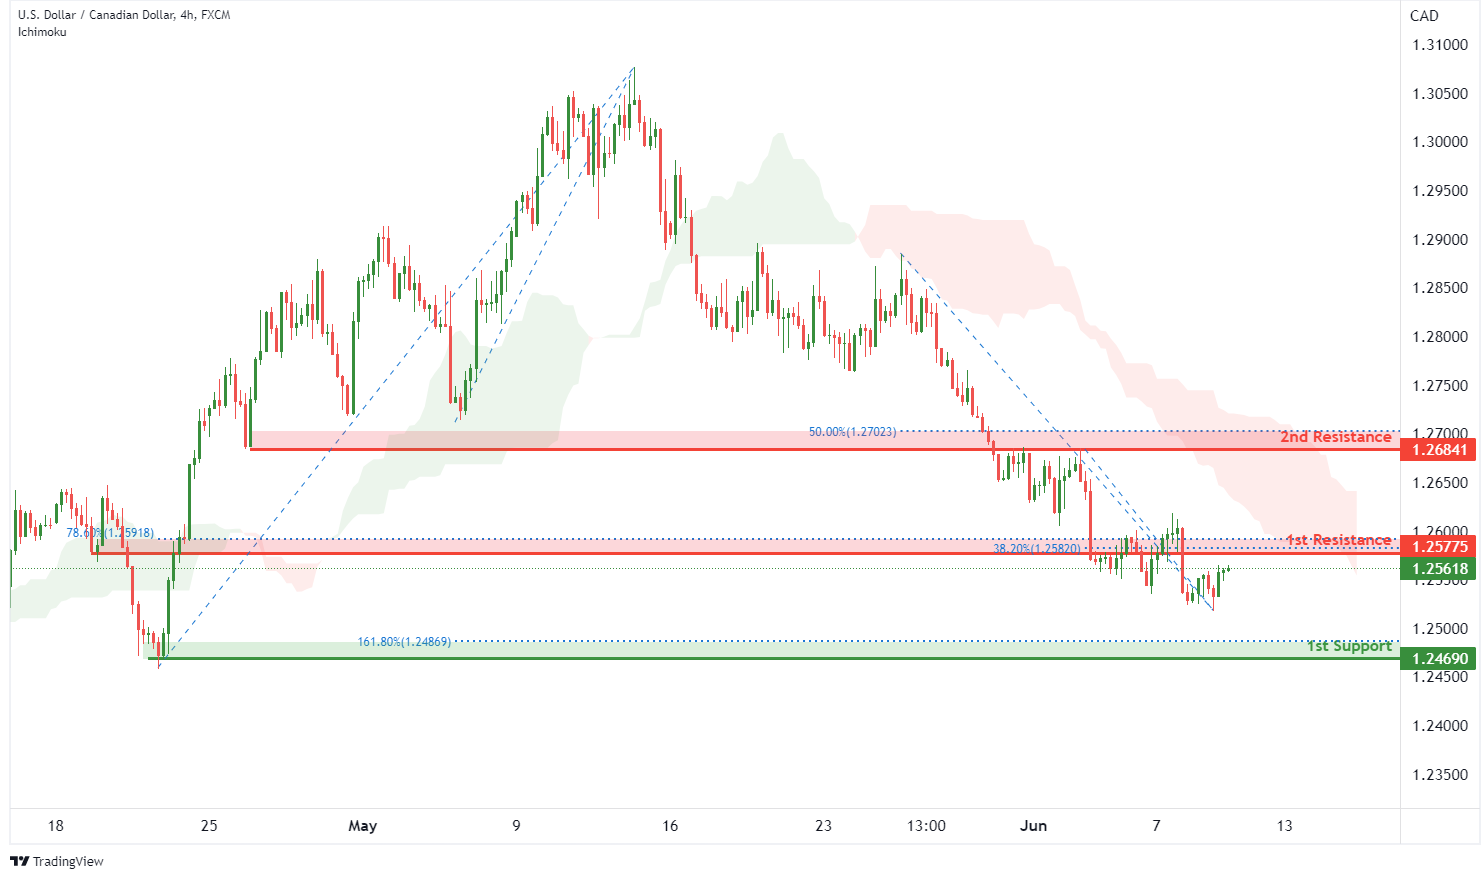
USD/CAD:
On the H4, with price moving below our ichimoku cloud, we have a bearish bias that price will drop to our 1st support at 1.24690 in line with the horizontal swing low support and the 161.8% Fibonacci extension from our 1st resistance at 1.25775 where the pullback resistance, 78.6% fibonacci retracement and 38.2% fibonacci retracement are. Alternatively, price may break structure and head for our 2nd resistance at 1.26841 in line with overlap resistance and 50% fibonacci retracement.
Areas of consideration:
- H4 time frame, 1st resistance at 1.25775
- H4 time frame, 1st support at 1.24690
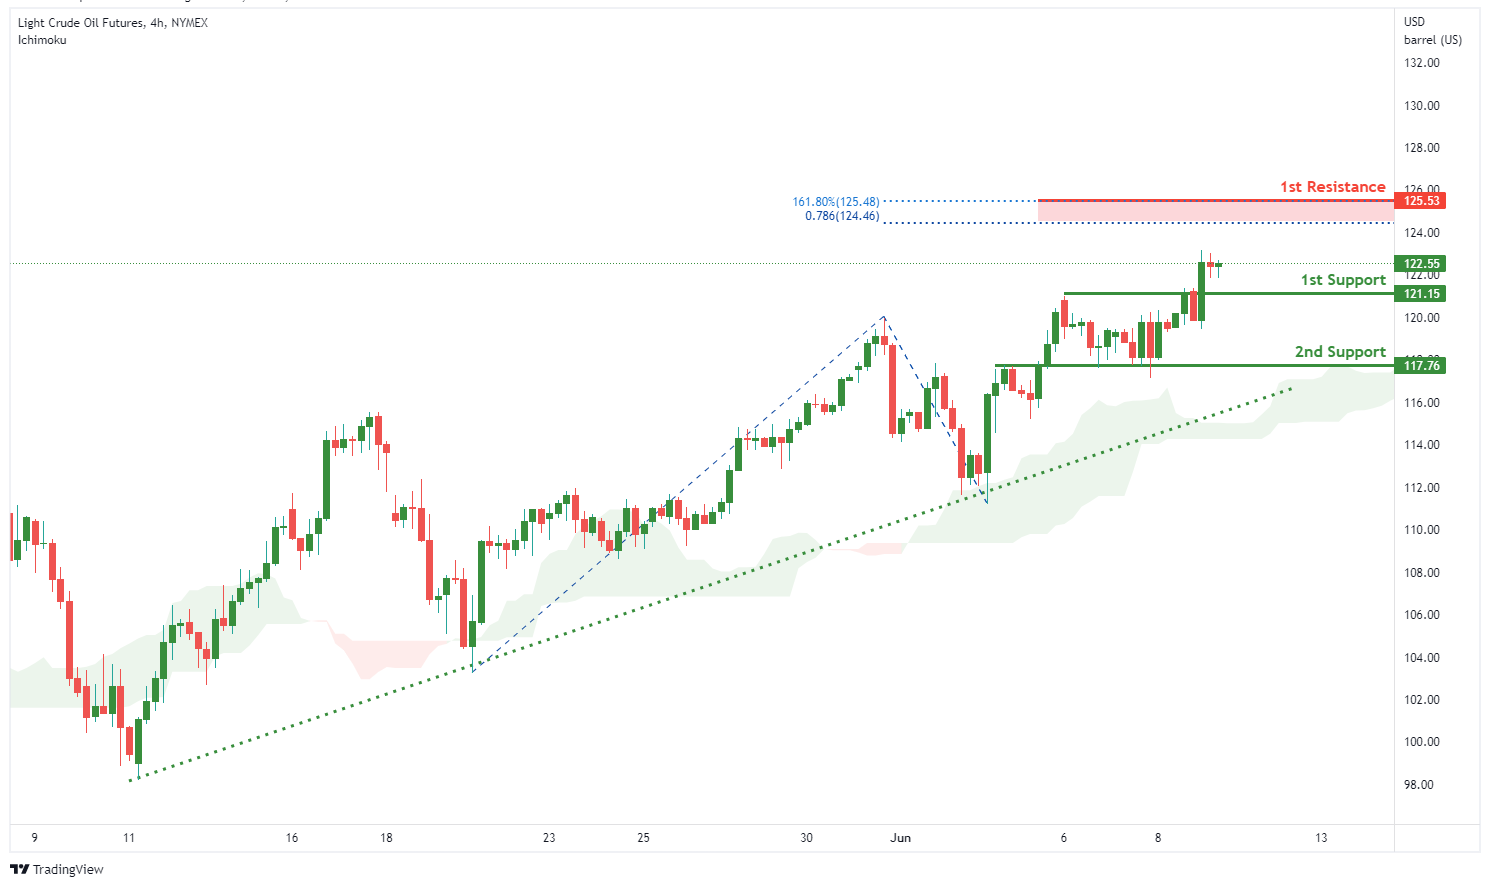
OIL:
On the H4, with price moving above the ichimoku cloud, we have a bullish bias that price will rise from our 1st support at 121.15 where the horizontal pullback support is to our 1st resistance at 125.53 in line with the 78.6% fibonacci projection and 161.8% Fibonacci extension. Alternatively, price may break structure and head for 2nd support at 117.76.
Areas of consideration:
- H4 time frame, 1st resistance of 125.53
- H4 time frame, 1st support of 121.15
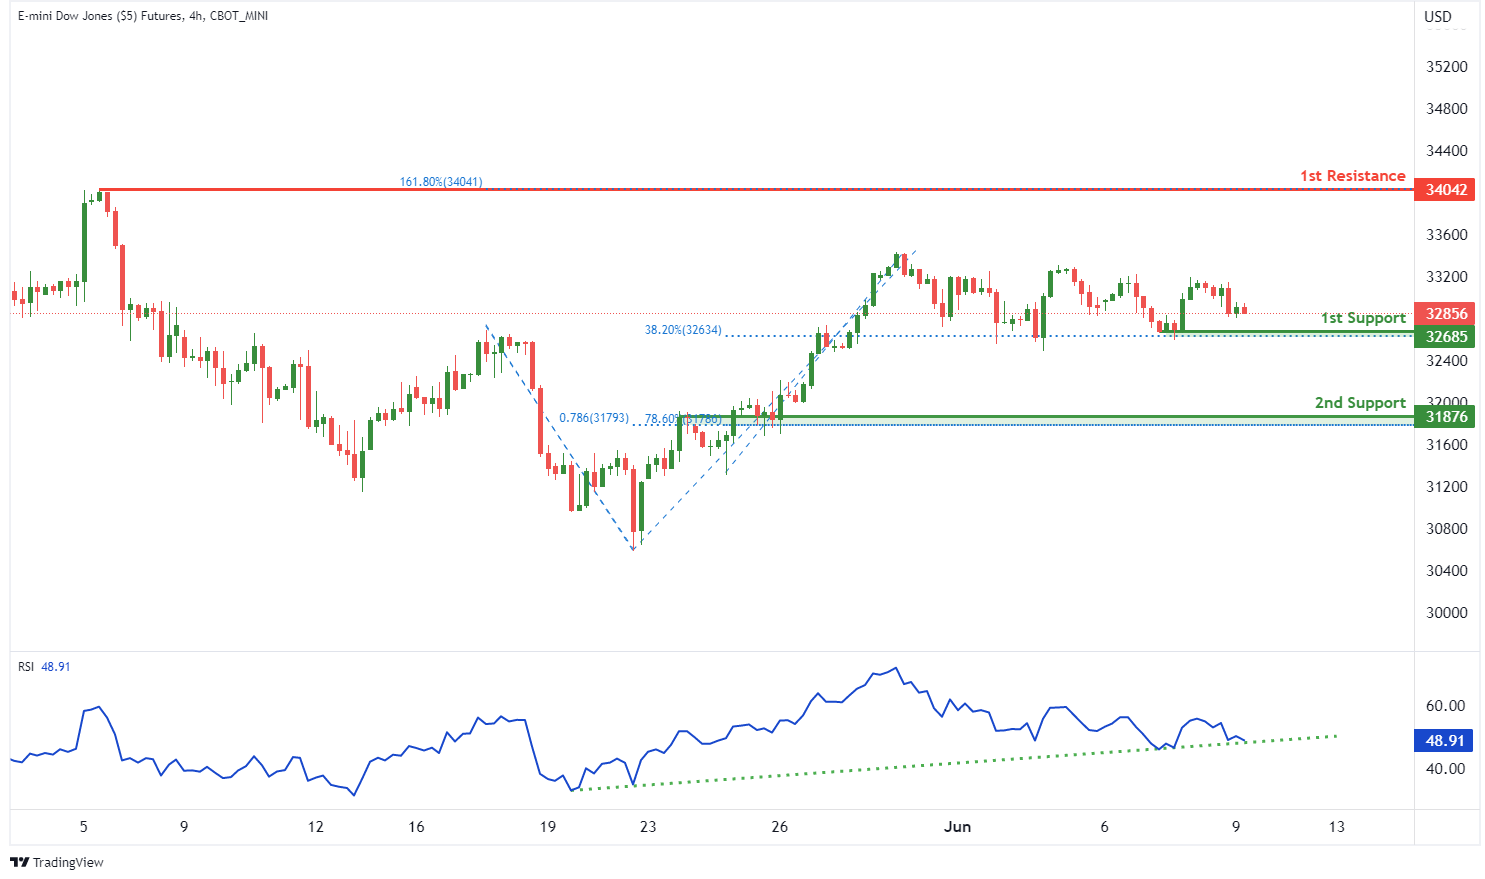
Dow Jones Industrial Average:
On the H4, with RSI moving in an ascending trendline, we have a bullish bias that price will rise from our 1st support at 32685 where the horizontal swing low support and 38.2% fibonacci retracement are to our 1st resistance at 34042 in line with the swing high resistance and 161.8% Fibonacci extension. Alternatively, price may break structure and head for 2nd support at 31876 where the pullback support, 78.6% fibonacci projection and 78.6% fibonacci retracement are.
Areas of consideration :
- H4 time frame, 1st resistance at 34042
- H4 time frame, 1st support at 32685
The accuracy, completeness and timeliness of the information contained on this site cannot be guaranteed. IC Markets does not warranty, guarantee or make any representations, or assume any liability regarding financial results based on the use of the information in the site.
News, views, opinions, recommendations and other information obtained from sources outside of www.icmarkets.com.au, used in this site are believed to be reliable, but we cannot guarantee their accuracy or completeness. All such information is subject to change at any time without notice. IC Markets assumes no responsibility for the content of any linked site.
The fact that such links may exist does not indicate approval or endorsement of any material contained on any linked site. IC Markets is not liable for any harm caused by the transmission, through accessing the services or information on this site, of a computer virus, or other computer code or programming device that might be used to access, delete, damage, disable, disrupt or otherwise impede in any manner, the operation of the site or of any user’s software, hardware, data or property.
