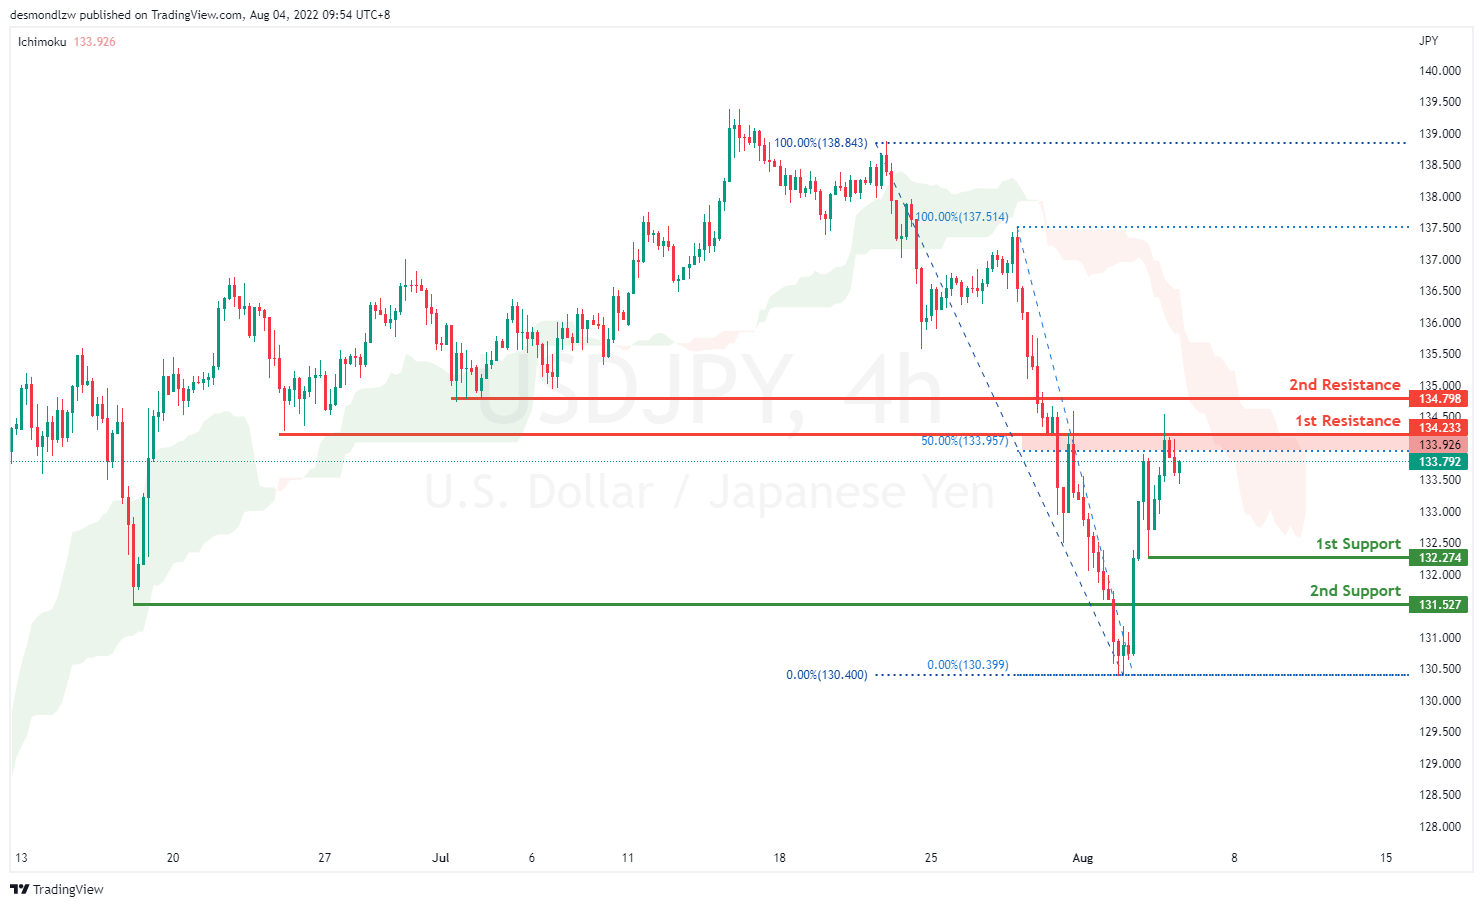
USD/JPY:
On the H4, price is bearish biased and moving strongly in an ascending trendline. It is still respecting the Ichimoku indicator, and has confirmed a strong downside momentum. It is now going to test at the first support at 132.256 which the previous swing low sits at. If prices were to break first support it will go to the second support at 131.527. Alternatively, price could bounce back up to test at the first resistance, 50% retracement at 134.213
Areas of consideration:
- H4 time frame, 1st resistance at 134.233
- H4 time frame, 1st support at 131.543
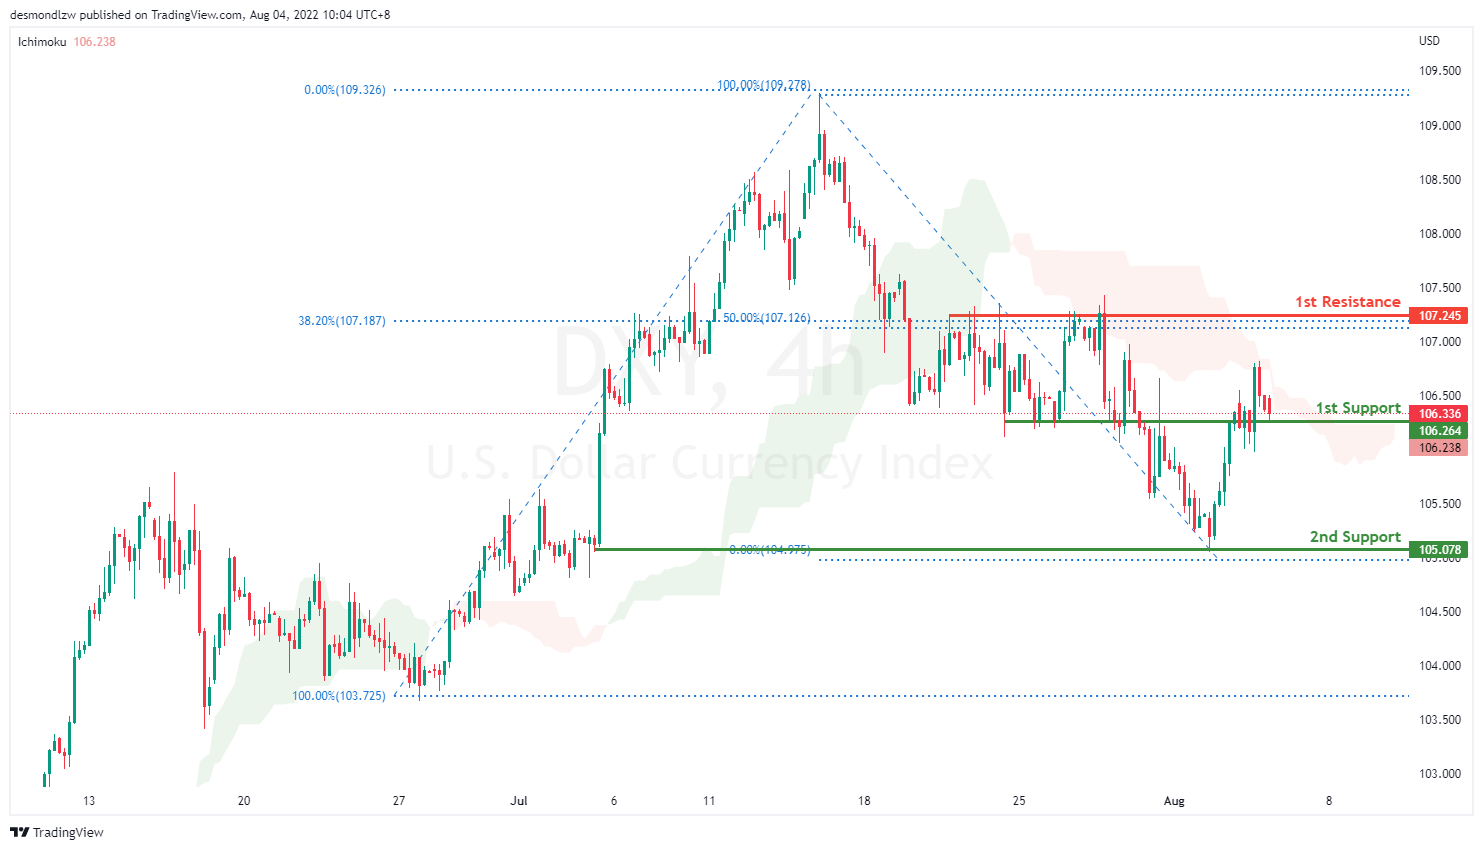
DXY:
On the H4, prices have broken the ascending trend into an overall bearish biased trend. Prices has confirmed descending momentum, still respecting the Ichimoku cloud. It is now testing first support at 106.264 which is the previous swing low. If price were to break this key level, it will pull back further to test at second support 105.078. Alternatively, price could bounce back and test at 107.245 which coincides with 38.2% Fibonacci retracement
Areas of consideration:
- H4 time frame, 1st resistance at 107.245
- H4 time frame, 1st support at 106.264
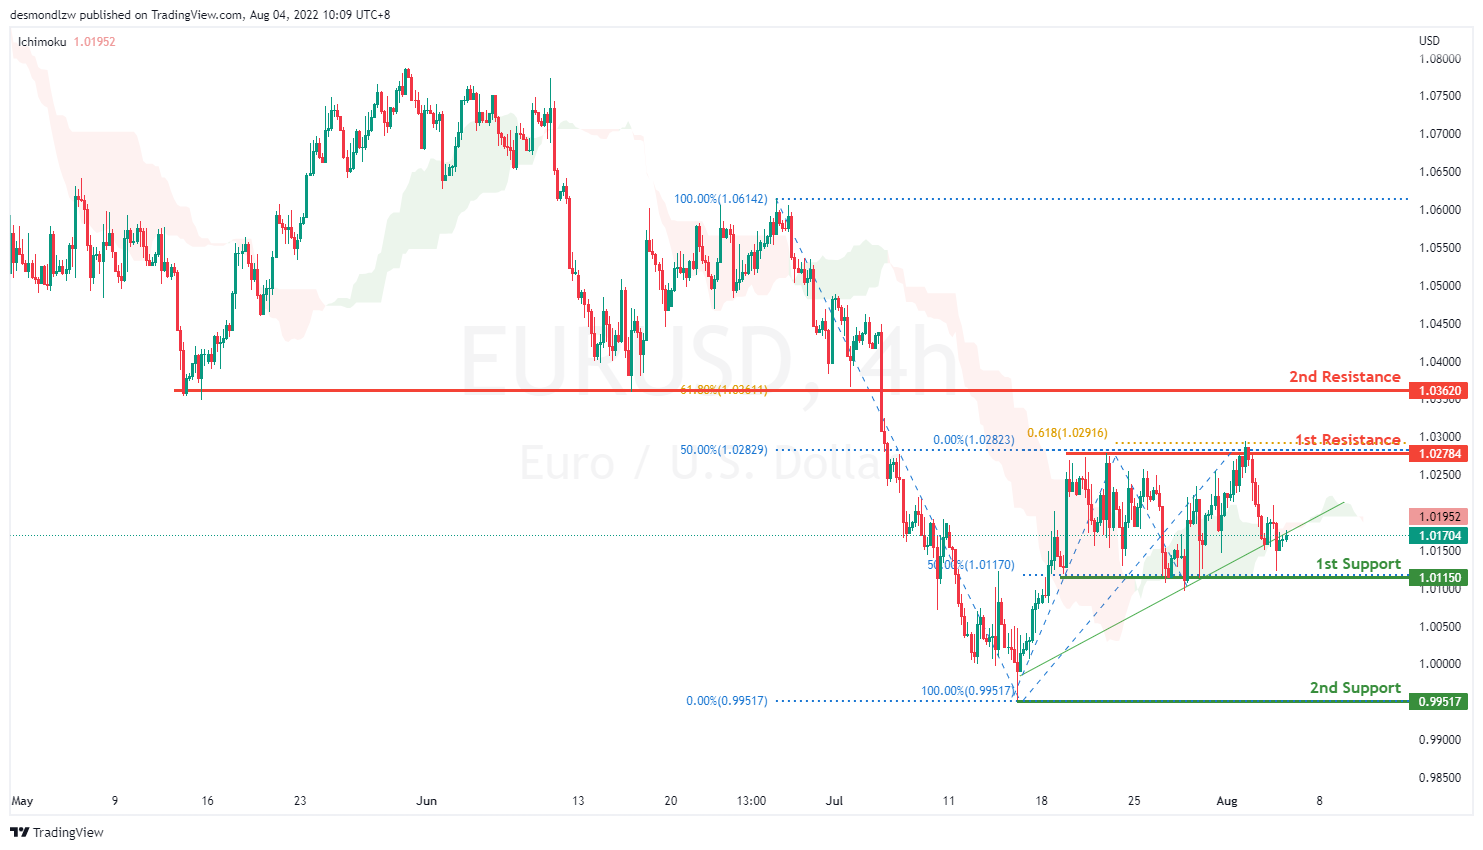
EUR/USD :
On the H4, prices have broken the bearish trend moving into a bullish biased trend. Price has rejected the 1.027 level, 50% retracement. It might pull back to test the previous swing low at 1.011, first support level. If prices break 1st support it will pull back further to test at 2nd support 0.995. Alternatively, If price fails to break the first support it might bounce off the first support to test at 1.027, 50% resistance level
Areas of consideration :
- H4 1st resistance at 1.027
- H4 1st support at 1.011
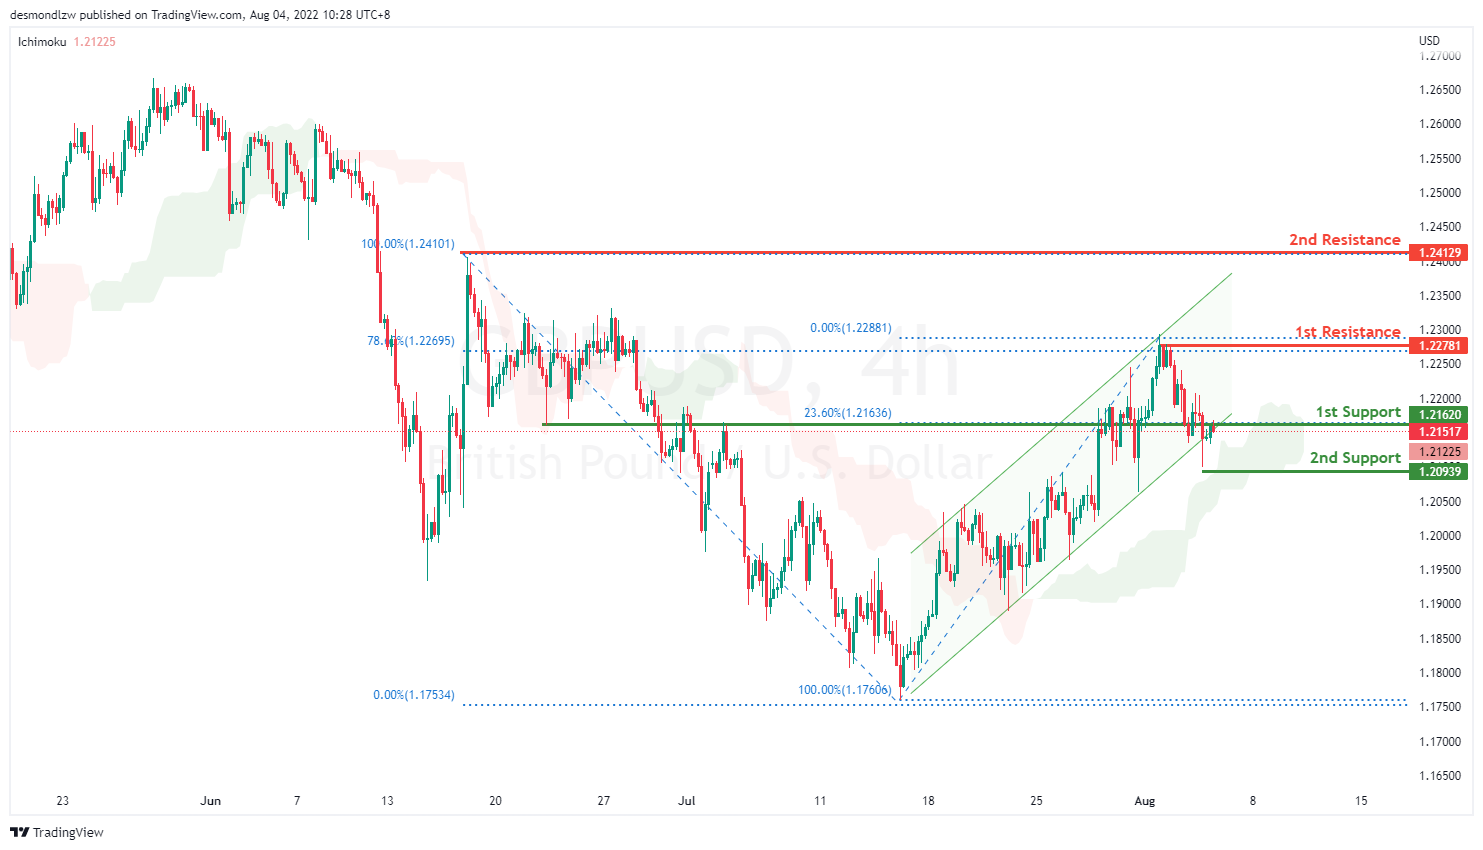
GBP/USD:
On the H4, with prices moving in an ascending channel and respecting the Ichimoku cloud, we are bullish biased. Price is now testing the first support at 1.216 which coincides with 23.6% Fibonacci retracement. If price fails to break support, and confirm an upside trend, we would expect bullish momentum to carry price to 1st resistance at 1.227 78.6% Fibonacci retracement then second resistance at 1.24129
Areas of consideration:
- H4 1st resistance at 1.227
- H4 1st support at 1.216
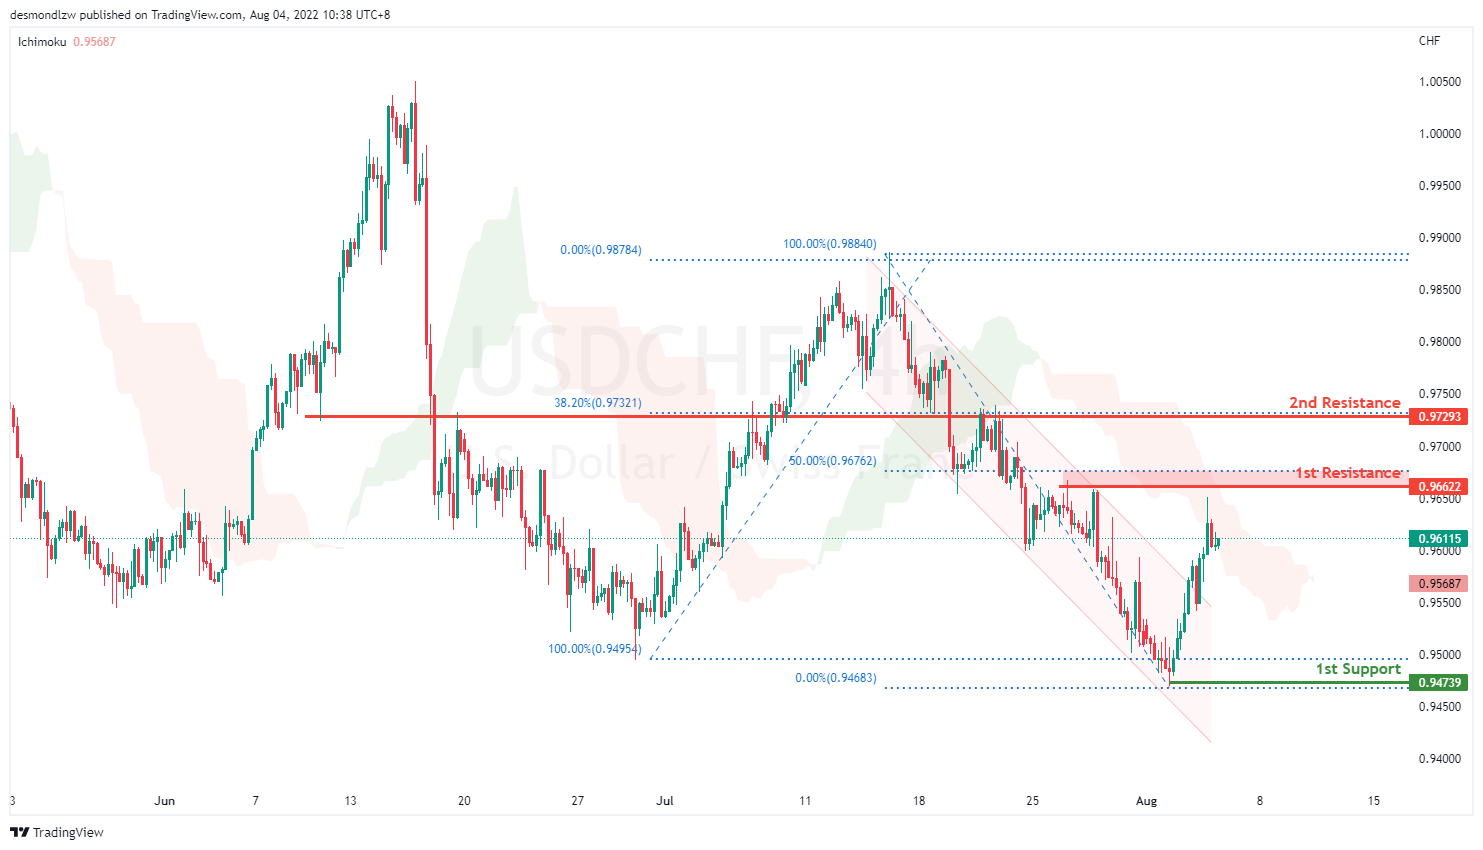
USD/CHF:
On the H4, prices have broken the descending channel and move into a slightly bullish momentum. It is moving towards the 1st resistance at 0.966 which is also the 50% Fibonacci retracement. If prices break this key level, it will pull back further to test at the second resistance 0.977 which is also the 38.2% retracement level. Alternatively if price rejects, it will test the support level 0.947
Areas of consideration
- H4 1st resistance at 0.966
- H4 1st support at 0.947
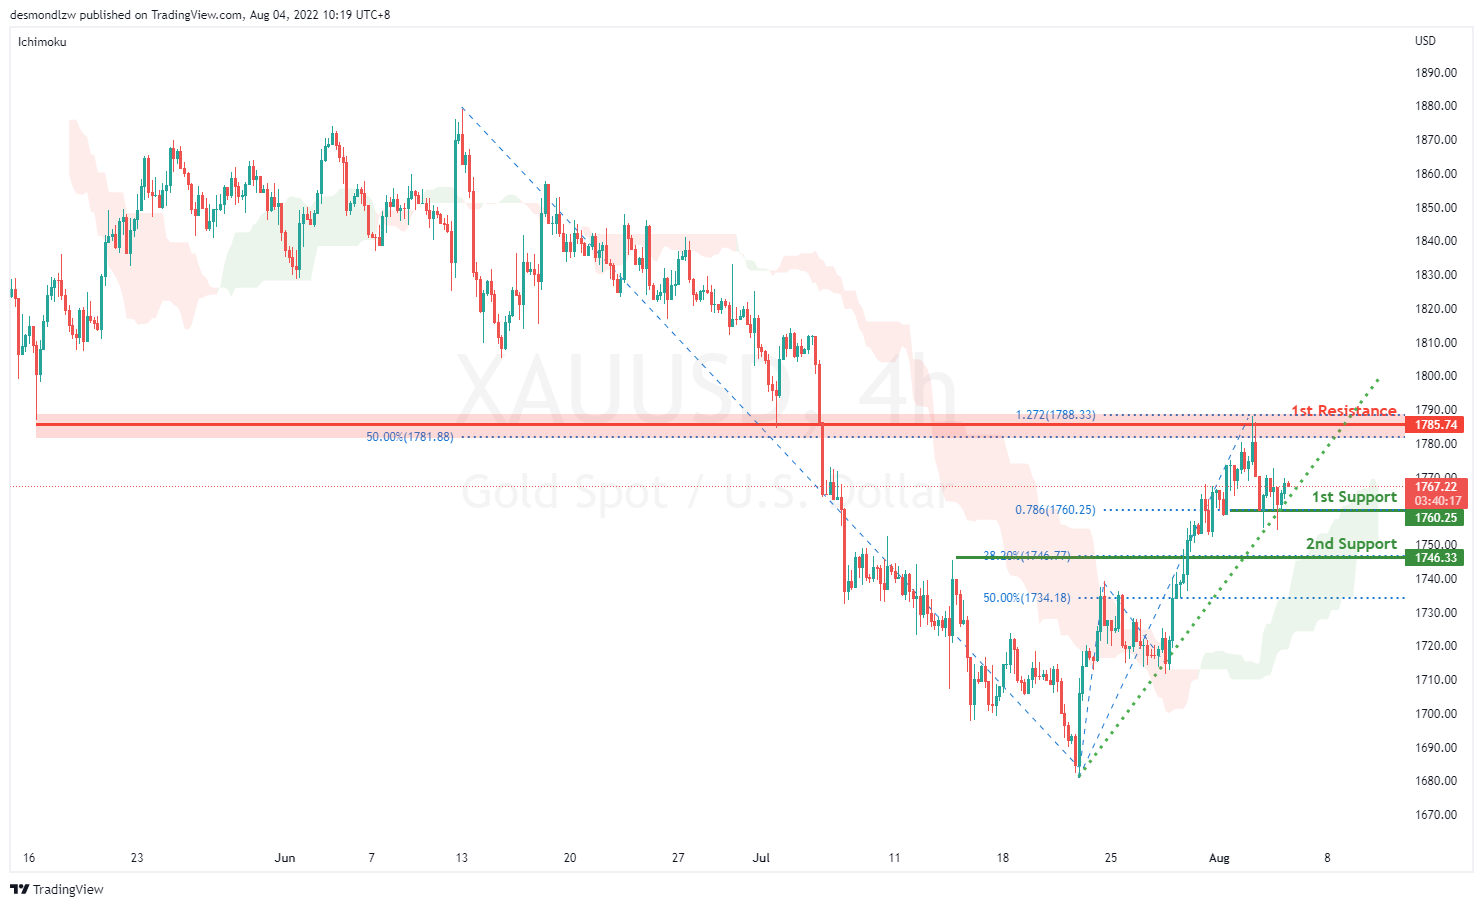
XAU/USD (GOLD):
On the H4, with prices going along the ascending trendline and moving above ichimoku cloud, we have a bullish bias that price may rise from the 1st support at 1760.25, which is in line with the 78.6% fibonacci projection to 1st resistance at 1785.74 where the the swing high, 127.2% projection and 50% fibonacci retracement are. Alternatively, prices may drop to 2nd support at 1746.33,which is in line with 38.2% fibonacci retracement.
Areas of consideration:
- H4 time frame, 1st support at 1760.25
- H4 time frame, 1st resistance at 1785.74
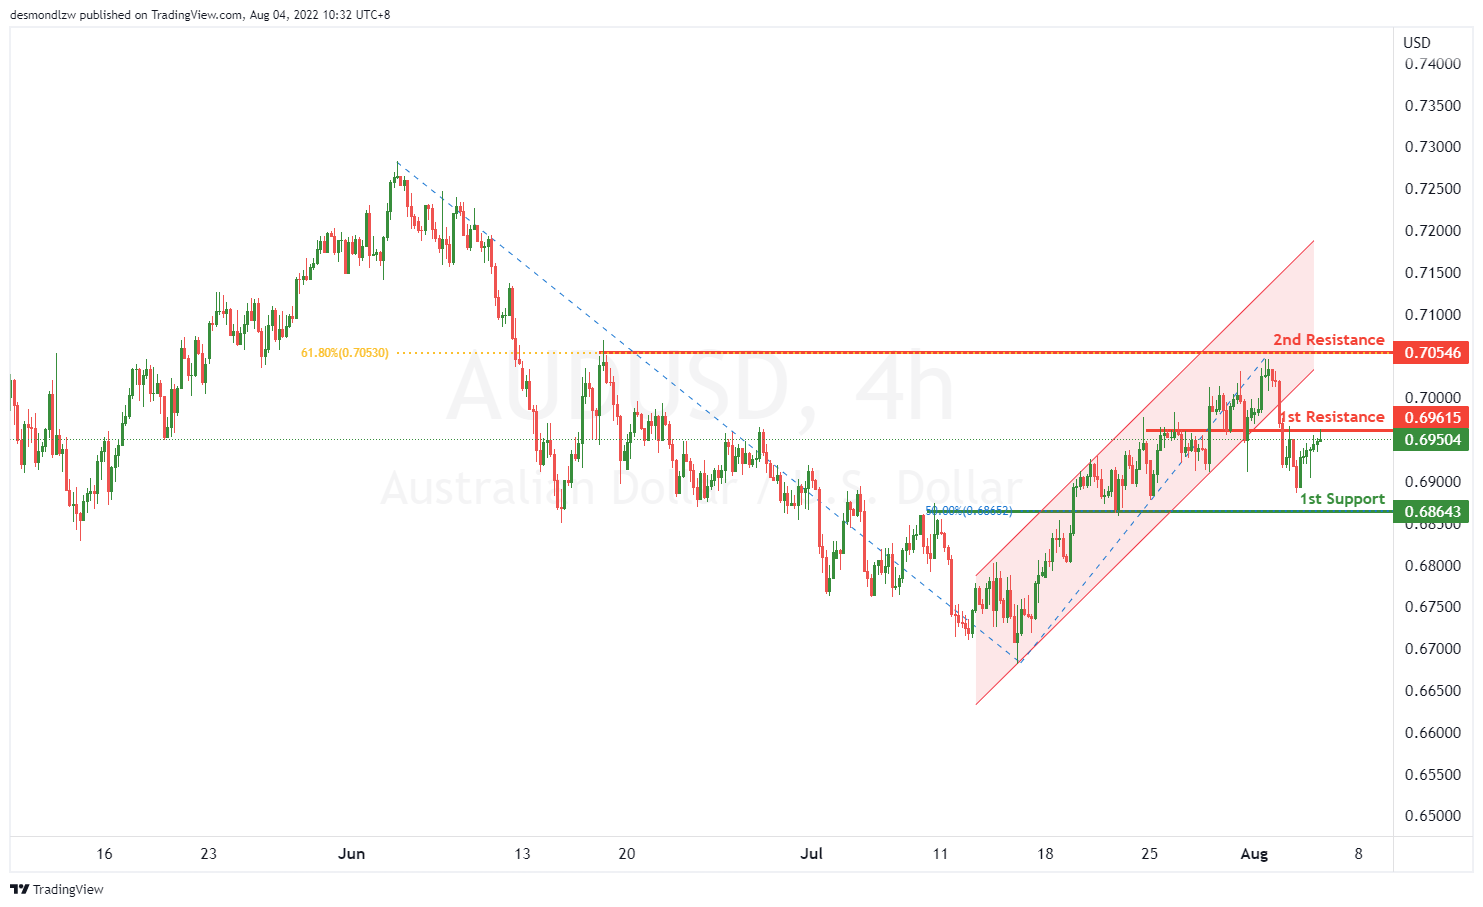
AUD/USD:
On the H4, with price breaking the ascending trend channel, we have a bearish bias that price will drop from the 1st resistance at 0.69615, where the overlap resistance is to the 1st support at 0.68643 where the 50% fibonacci retracement is. Alternatively, price may rise to the 2nd resistance at 0.70546 which is in line with 61.8% fibonacci retracement.
Areas of consideration
- H4 1st resistance at 0.69615
- H4 1st support at 0.68643
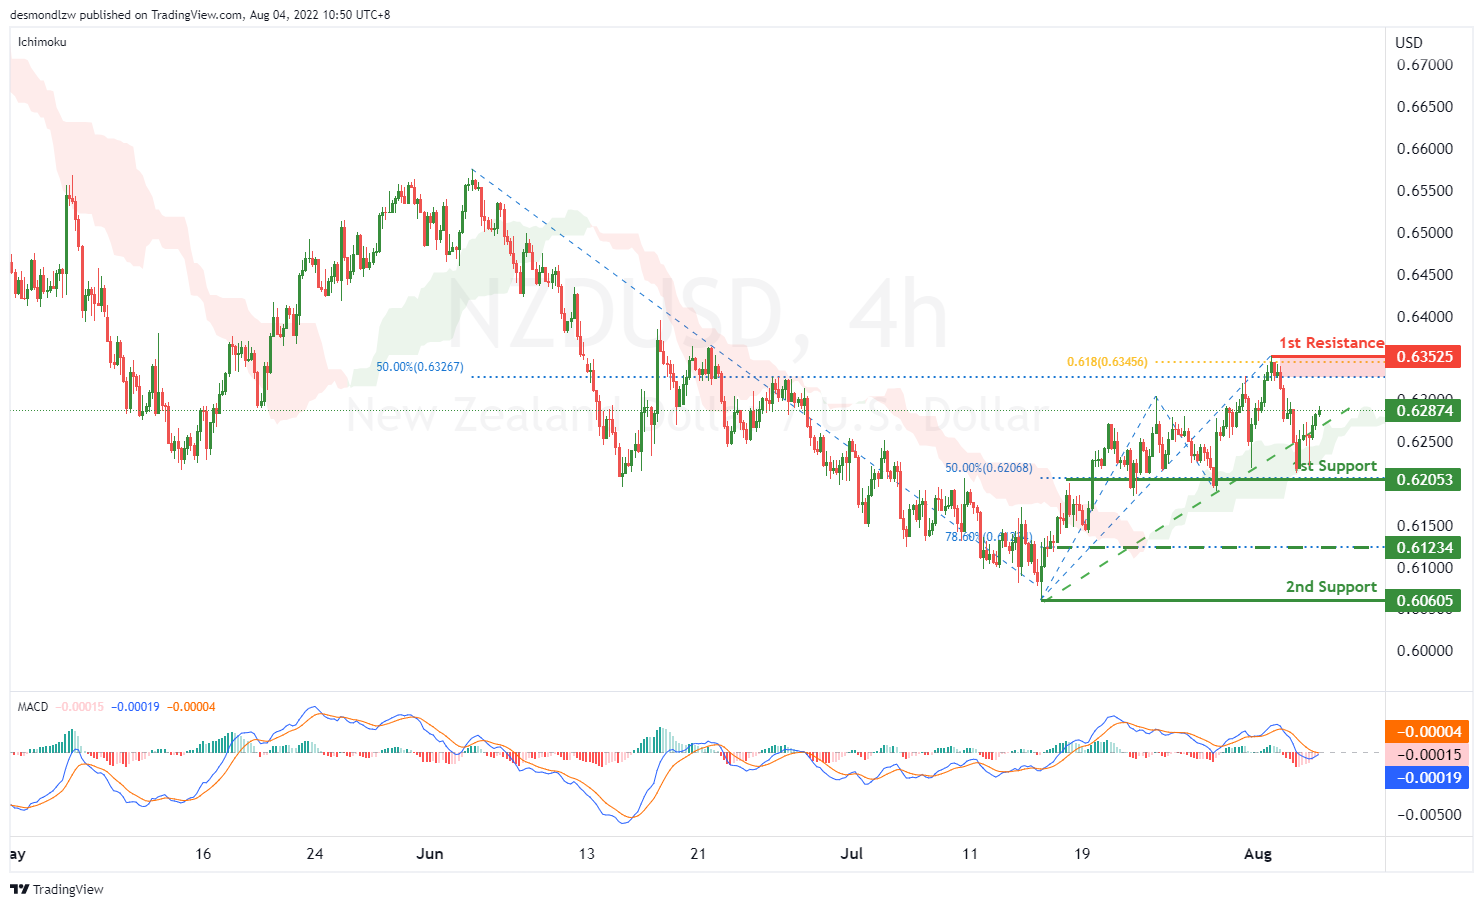
NZD/USD:
On the H4, with price bouncing off to the ascending trendline, also, the momentum of red histogram is decreasing, we have a bullish bias that price may rise from the 1st support at 0.62053 where 50% fibonacci retracement is to the 1st resistance at 0.63525 at the swing high, 61.8% fibonacci projection and 50% fibonacci retracement. Alternatively, price may reverse off the 1st support and drop to 2nd support at 0.60605 where the swing low is. Take note the price of 0.61234 could be the intermediate support, which is in line with the 78.6% fibonacci retracement.
Areas of consideration:
- H4 time frame, 1st support at 0.62053
- H4 time frame, 1st resistance at 0.63525
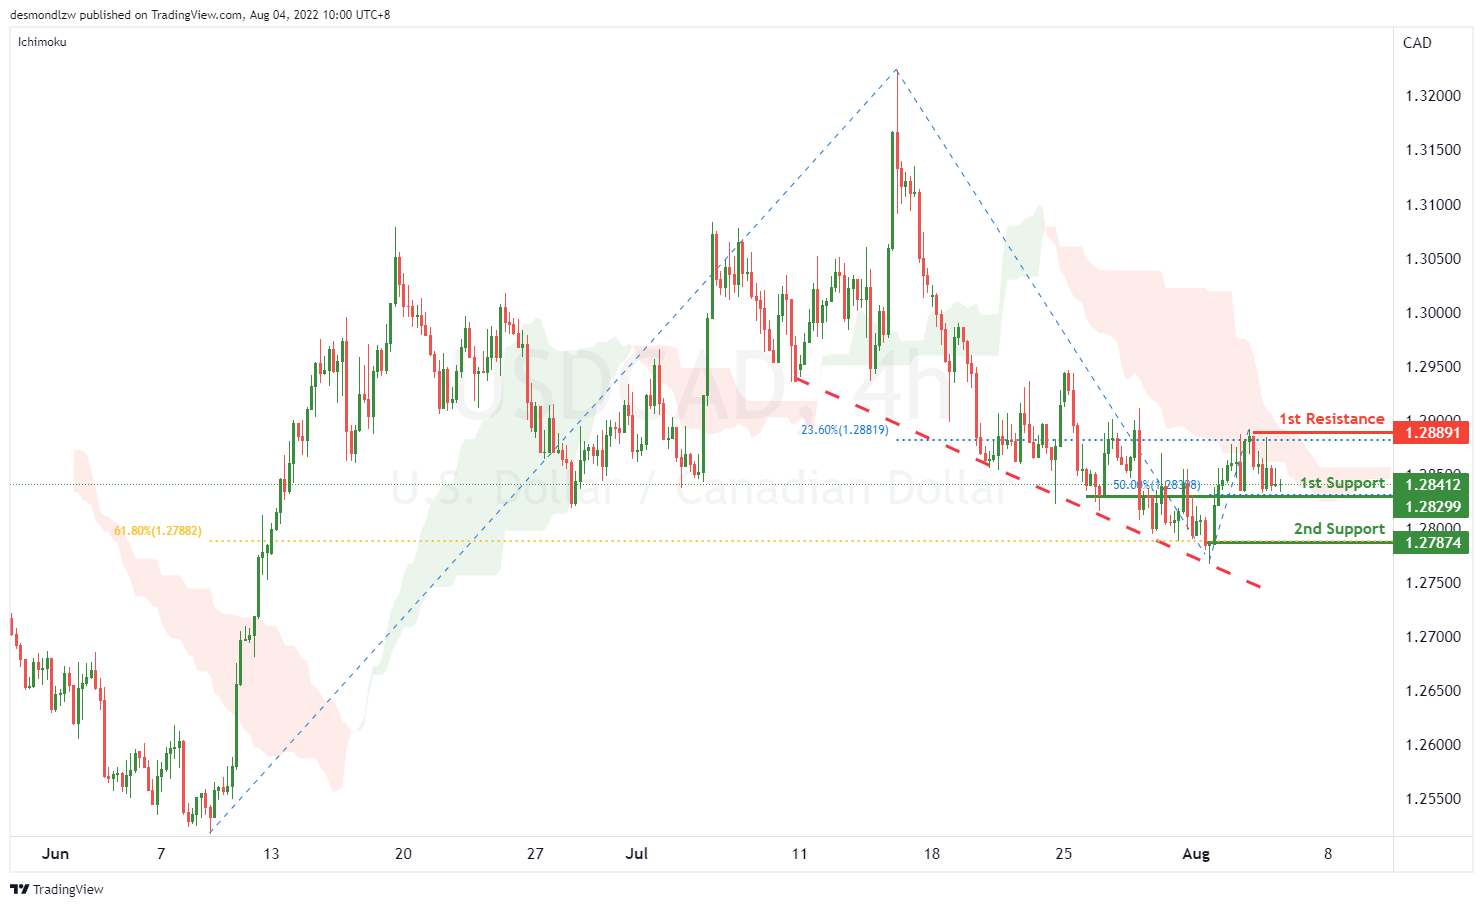
USD/CAD:
On the H4, with the price going along the descending trendline and below ichimoku cloud, we have a bearish bias that the price may drop from our 1st support at 1.28299, which is in line with 50% fibonacci retracement to our 2nd support at 1.27874, which is in line with the 61.8% fibonacci retracement. Alternatively, the price may rise to the 1st resistance at 1.28891, which is in line with the swing high and 23.6% fibonacci retracement.
Areas of consideration:
- H4 time frame, 1st support at 1.28299
- H4 time frame, 2nd support at 1.27874
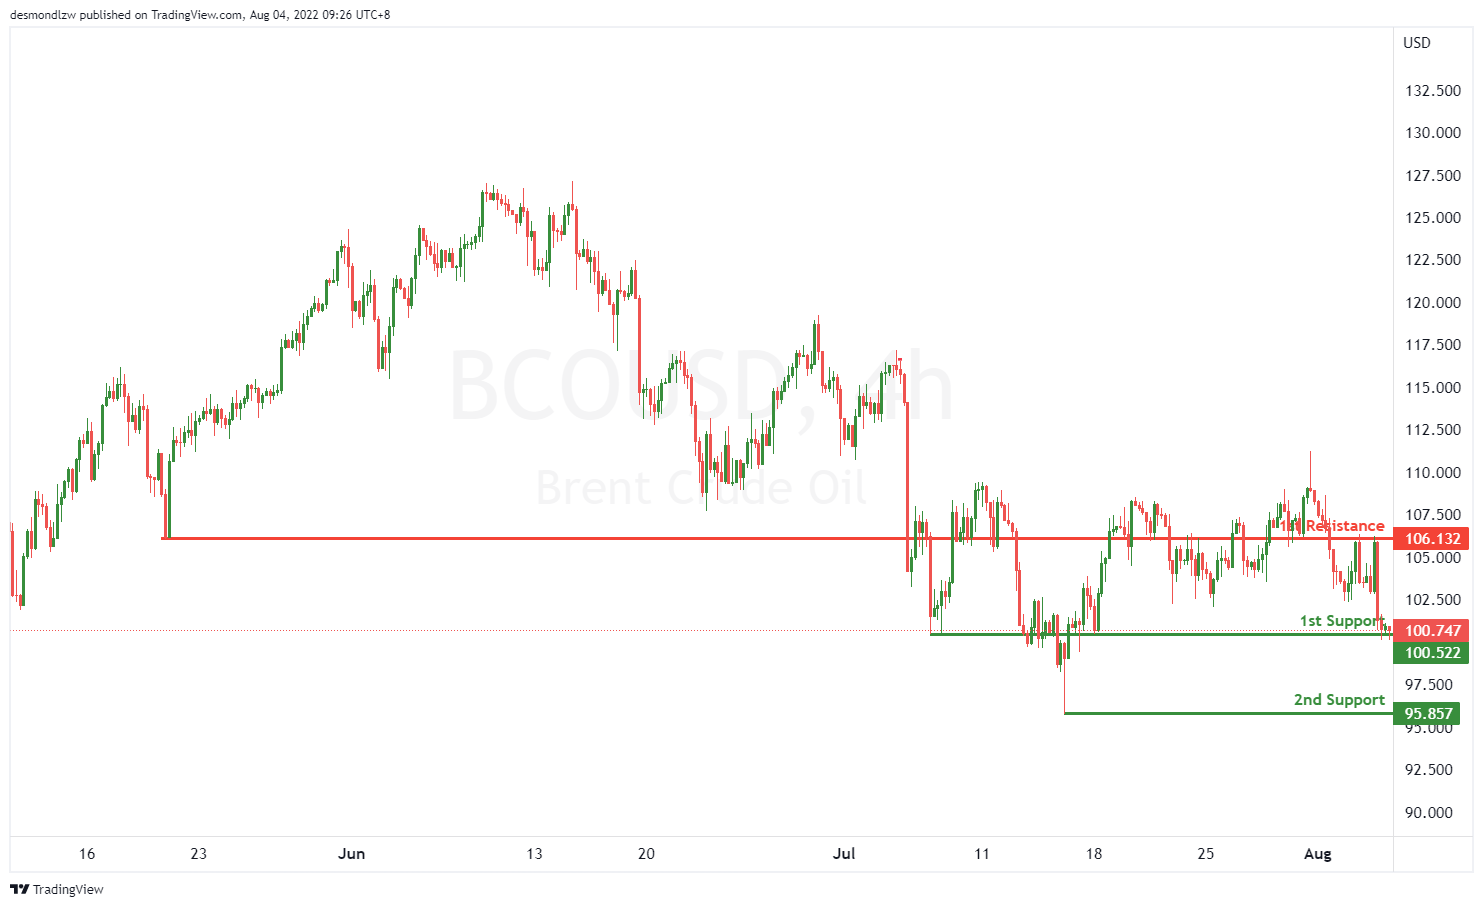
OIL:
On the H4, with price fluctuating within the consolidation area, we have a neutral bias that price might rise from the 1st support at 100.851, where the overlap support is to 1st resistance at 109.025, where the overlap resistance is. Otherwise, the price may drop to our 2nd support at 95.857, where the swing low is.
Areas of consideration:
- H4 time frame, 1st support of 100.851
- H4 time frame, 1st resistance of 109.025
Or
- H4 time frame, 1st support of 100.851
- H4 time frame, 2ndt support of 95.857
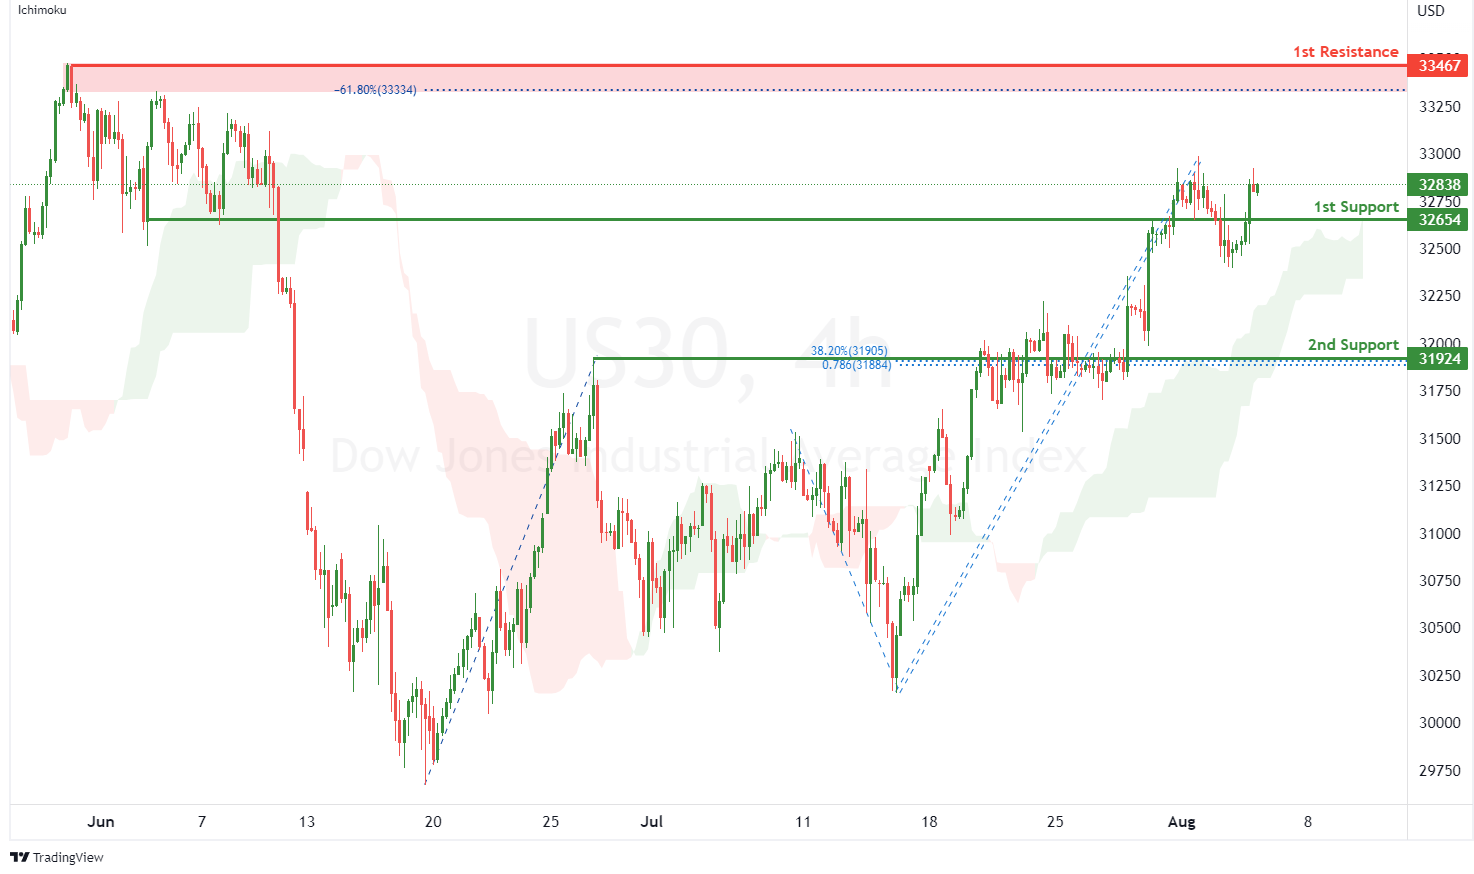
Dow Jones Industrial Average:
On the H4, with price moving above the ichimoku indicator, we have a bullish bias that price will rise from the 1st support at 32654 where the pullback support is to the 1st resistance at 33467 where the swing high resistance and -61.8% fibonacci expansion are. Alternatively, price could break 1st support structure and drop to 2nd support at 31924 where the pullback support, 38.2% fibonacci retracement and 78.6% fibonacci projection are.
Areas of consideration:
- H4 time frame, 1st resistance of 33467
- H4 time frame, 1st support at 32654
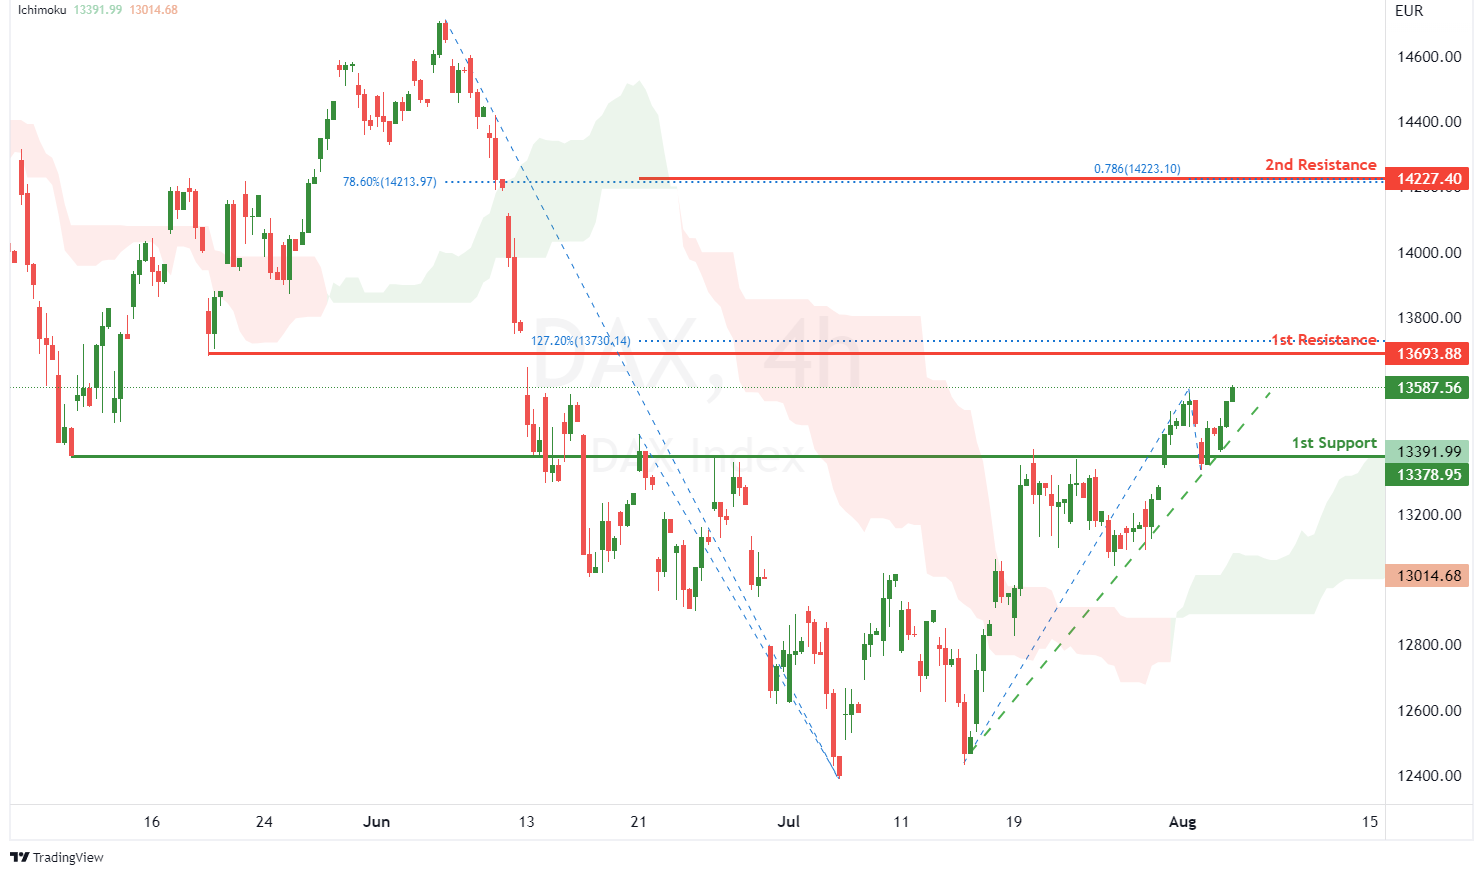
DAX:
On the H4, with price moving above the ichimoku indicator and along the ascending trendline, we have a bullish bias that price will rise to 1st resistance at 13693.88 where the pullback support and 127.2% fibonacci extension are. Once there is upside confirmation of price breaking 1st resistance structure, we would expect bullish momentum to carry price to 2nd resistance at 14227.40 in line with 78.6% fibonacci projection and 78.6% fibonacci retracement. Alternatively, price could drop to 1st support at 13378.95 where the overlap support is.
Areas of consideration:
- H4 time frame, 1st resistance of 13693.88
- H4 time frame, 1st support at 13378.95
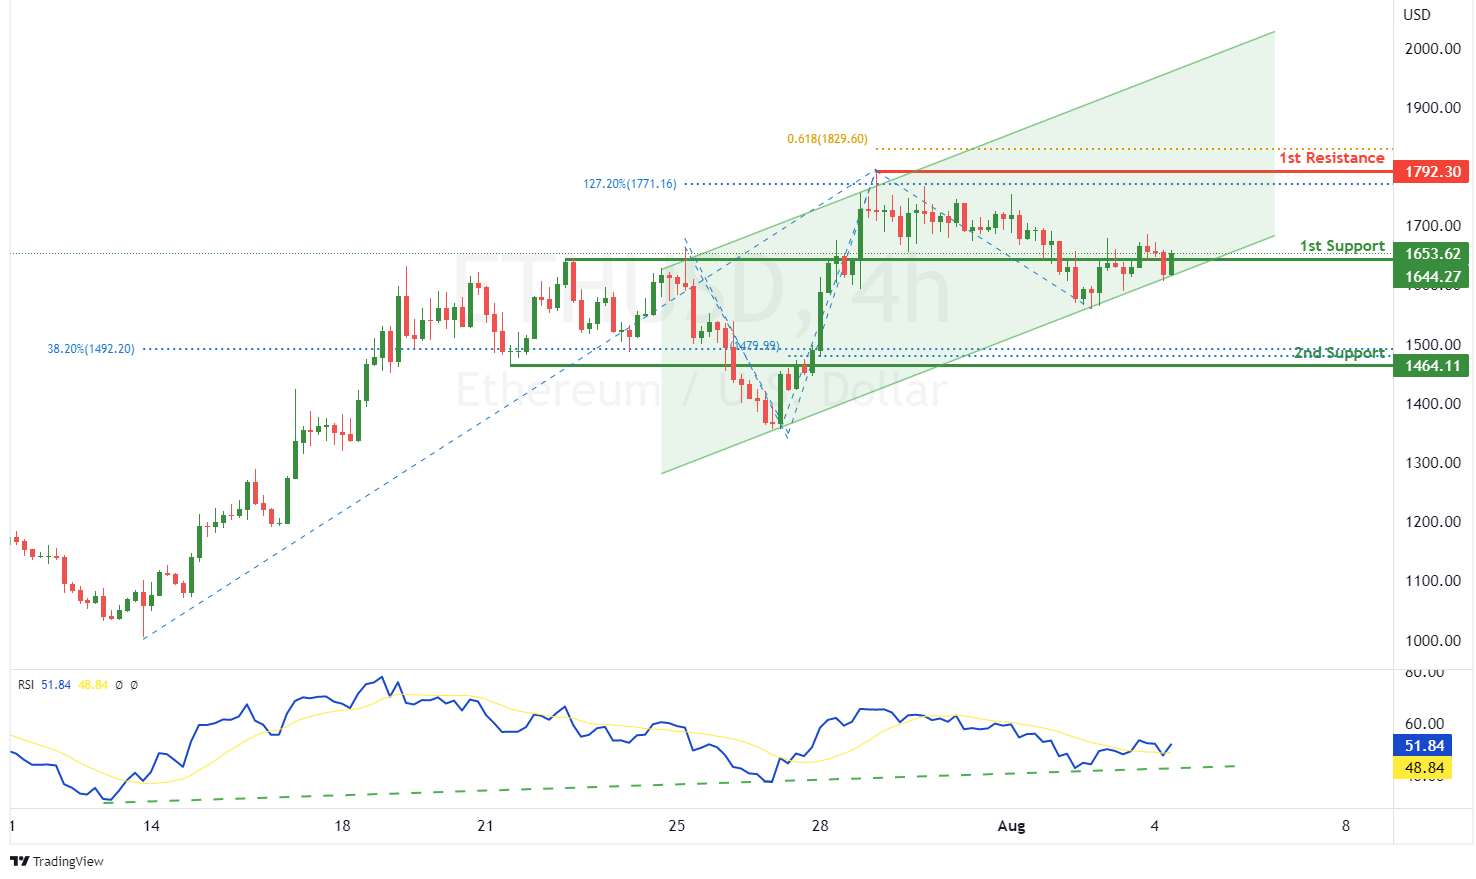
ETHUSD:
On the H4, with RSI moving along an ascending trendline, we have a bullish bias that price will rise from 1st support at 1644.27 where the overlap support is to the 1st resistance at 1792.30 where the swing high resistance, 127.2% fibonacci extension and 61.8% fibonacci projection are. Alternatively, price could break 1st support structure and drop to 2nd support at 1464.11 where the pullback support, 100% fibonacci projection and 38.2% fibonacci retracement.
Areas of consideration:
- H4 time frame, 1st resistance of 1792.30
- H4 time frame, 1st support at 1644.27
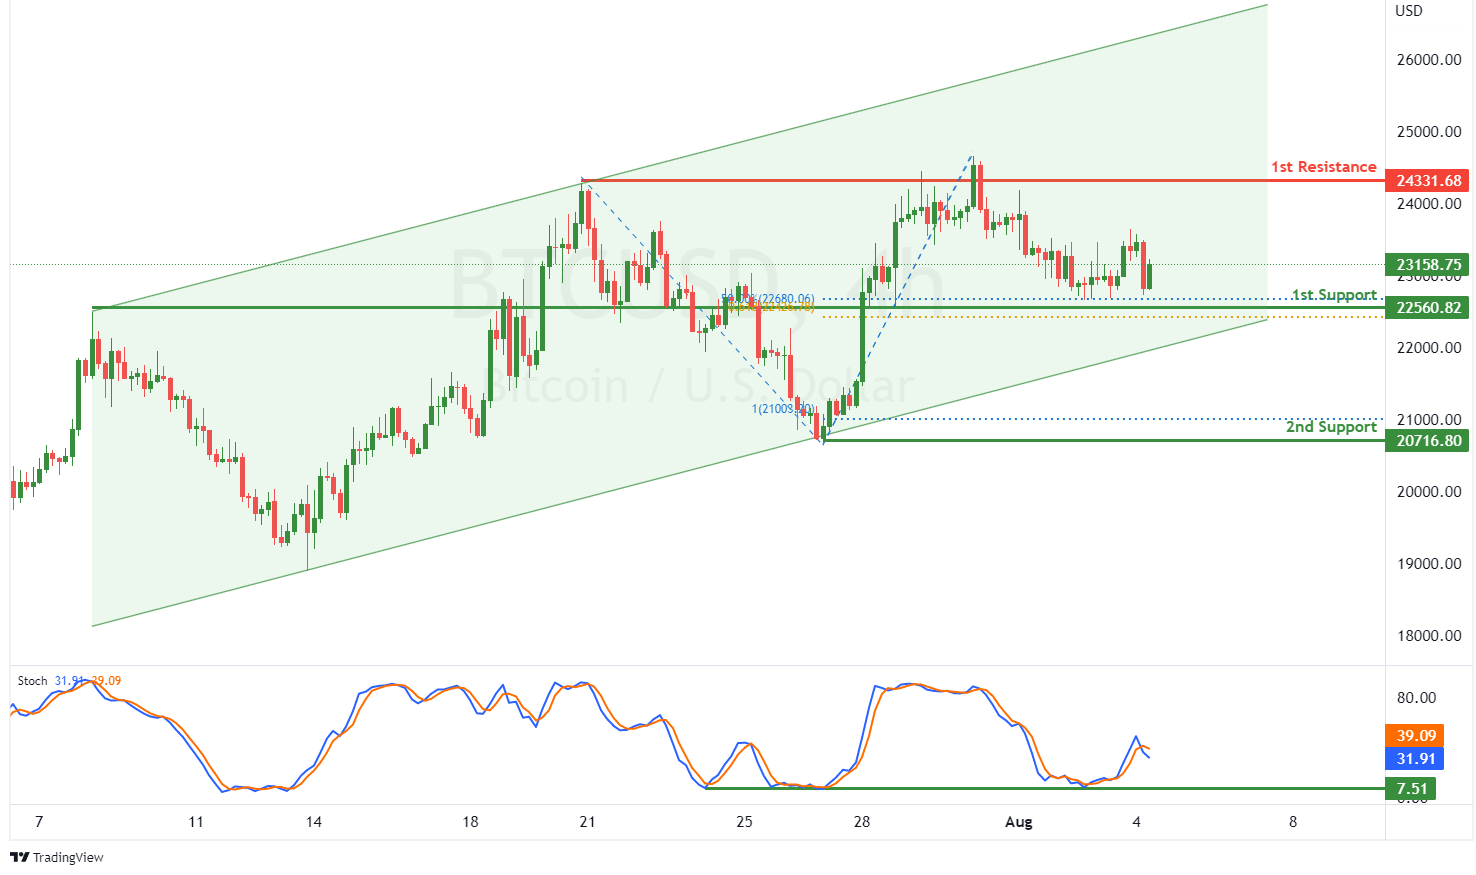
BTCUSD:
On the H4, with price moving within a bullish channel and expected to bounce from the stochastic support, we have a bullish bias that price will rise from our 1st support at 22560.82 where the pullback support, 50% fibonacci retracement and 61.8% fibonacci projection are to the 1st resistance at 24331.68 where the pullback resistance is. Alternatively, price could break 1st support structure and drop to 2nd support at 20716.80 where the swing low support and 100% fibonacci projection are.
Areas of consideration:
- H4 time frame, 1st resistance of 24331.68
- H4 time frame, 1st support at 22560.82
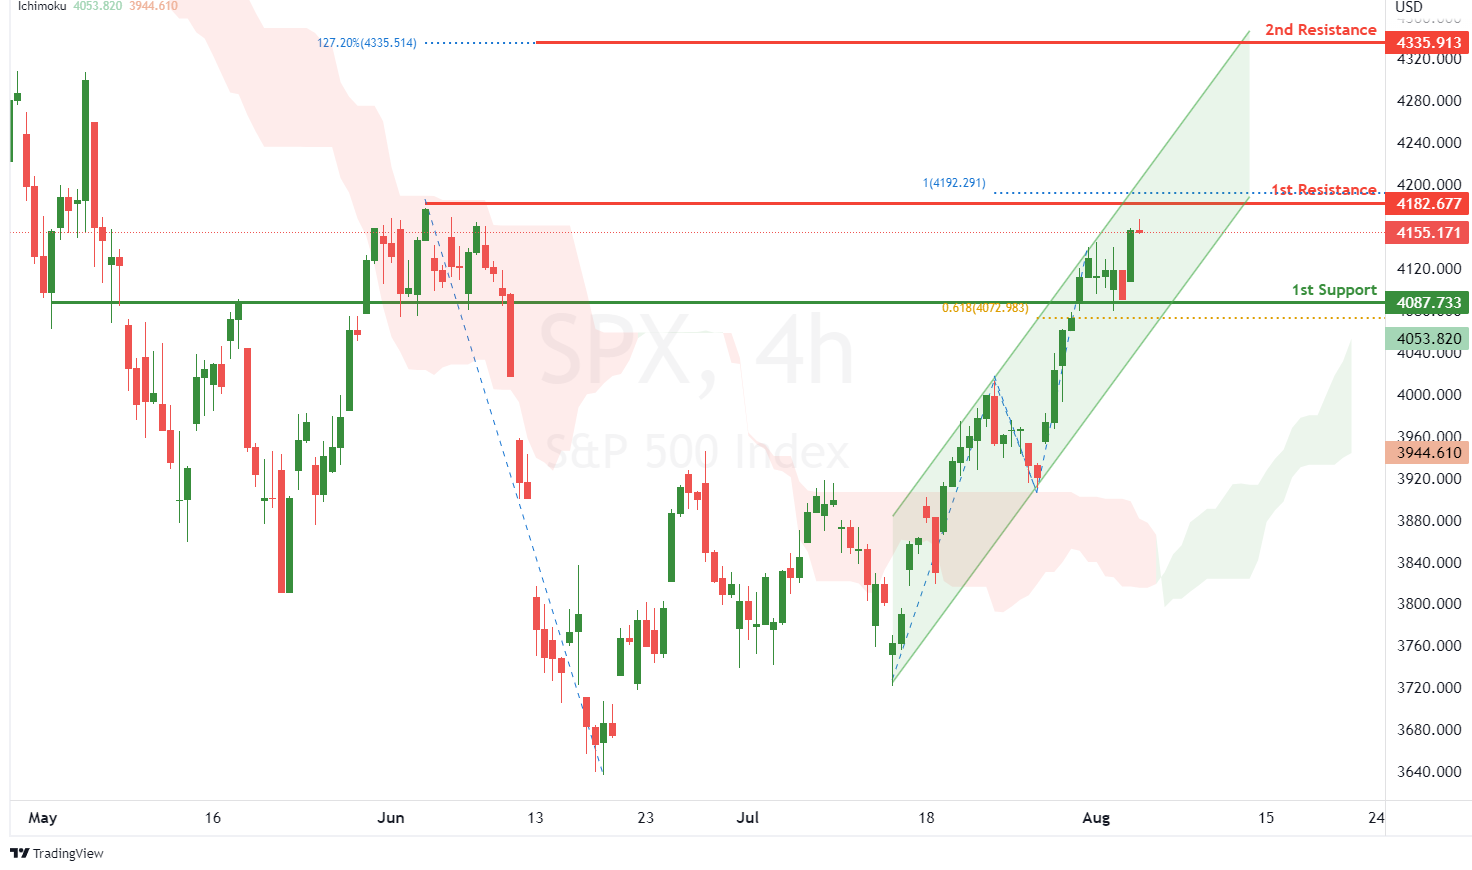
S&P 500:
On the H4, with price moving above the ichimoku indicator and within an ascending channel, we have a bullish bias that price will rise to our 1st resistance at 4182.677 where the swing high resistance and 100% fibonacci projection are. Once there is upside confirmation that price has broken the 1st resistance structure, we would expect bullish momentum to carry price to 2nd resistance at 4335.913 where the 127.2% fibonacci extension is. Alternatively, price could drop to 1st support at 4087.733 where the pullback support and 61.8% fibonacci projection are.
Areas of consideration:
- H4 time frame, 1st resistance of 4182.677
- H4 time frame, 1st support at 4087.733
The accuracy, completeness and timeliness of the information contained on this site cannot be guaranteed. IC Markets does not warranty, guarantee or make any representations, or assume any liability regarding financial results based on the use of the information in the site.
News, views, opinions, recommendations and other information obtained from sources outside of www.icmarkets.com.au, used in this site are believed to be reliable, but we cannot guarantee their accuracy or completeness. All such information is subject to change at any time without notice. IC Markets assumes no responsibility for the content of any linked site.
The fact that such links may exist does not indicate approval or endorsement of any material contained on any linked site. IC Markets is not liable for any harm caused by the transmission, through accessing the services or information on this site, of a computer virus, or other computer code or programming device that might be used to access, delete, damage, disable, disrupt or otherwise impede in any manner, the operation of the site or of any user’s software, hardware, data or property.