
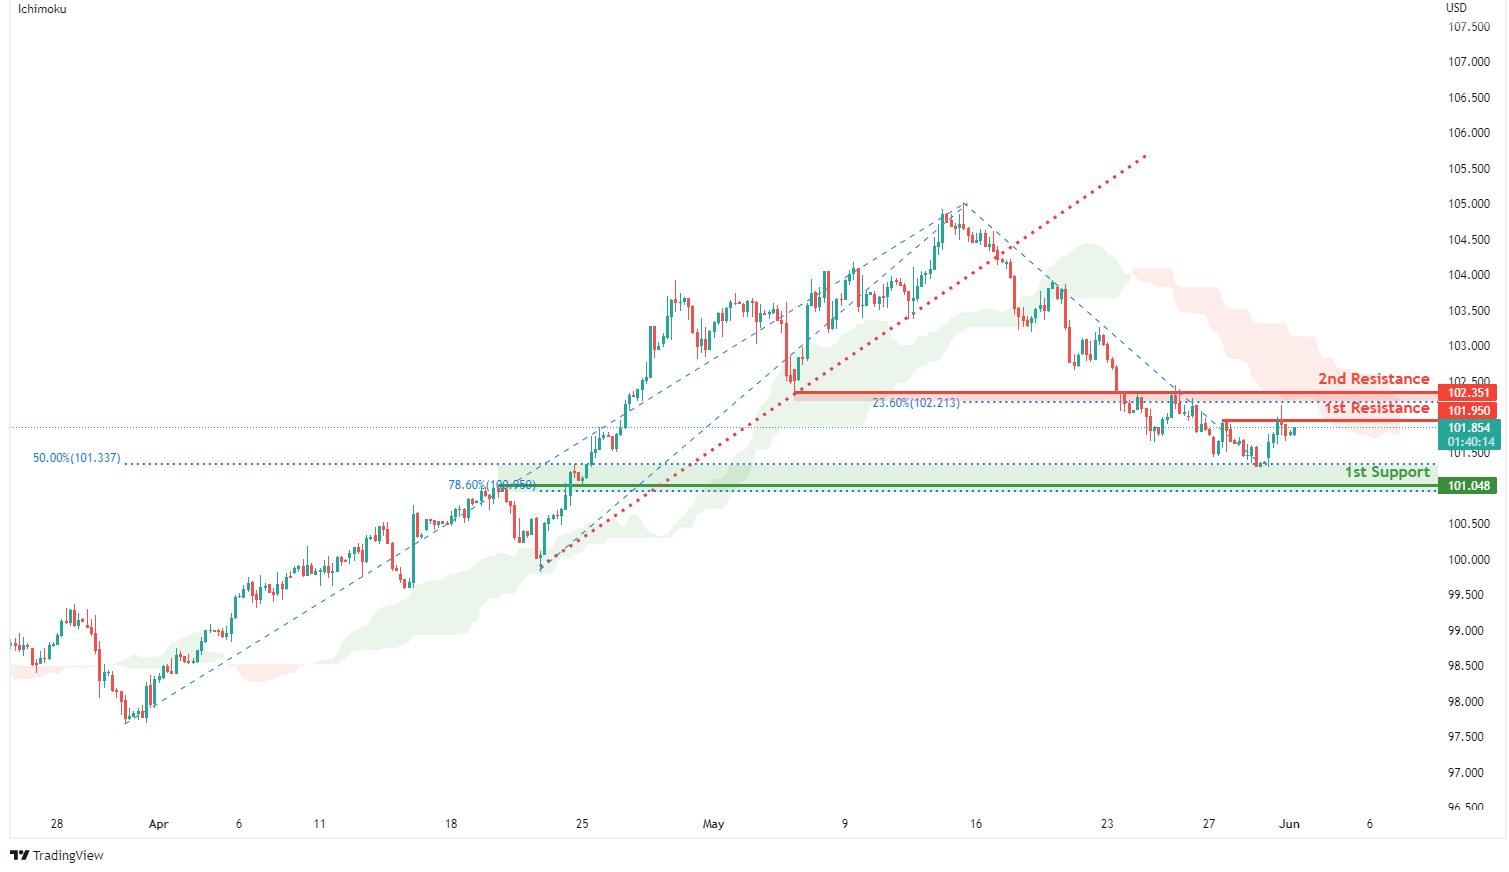
DXY:
On the H4, with prices moving below the ichimoku indicator and breakout from the ascending trendline, we have a bearish bias that price will drop to our 1st support at 101.048 where the horizontal pullback support, 78.6% fibonacci retracement and 50% fibonacci retracement are from our 1st resistance at 101.950 in line with the horizontal swing high resistance. Alternatively, price may break 1st resistance structure and head for 2nd resistance at 102.351 where the horizontal overlap resistance and 23.6% fibonacci retracement are.
Areas of consideration:
- H4 time frame, 1st resistance at 101.950
- H4 time frame, 1st support at 101.048
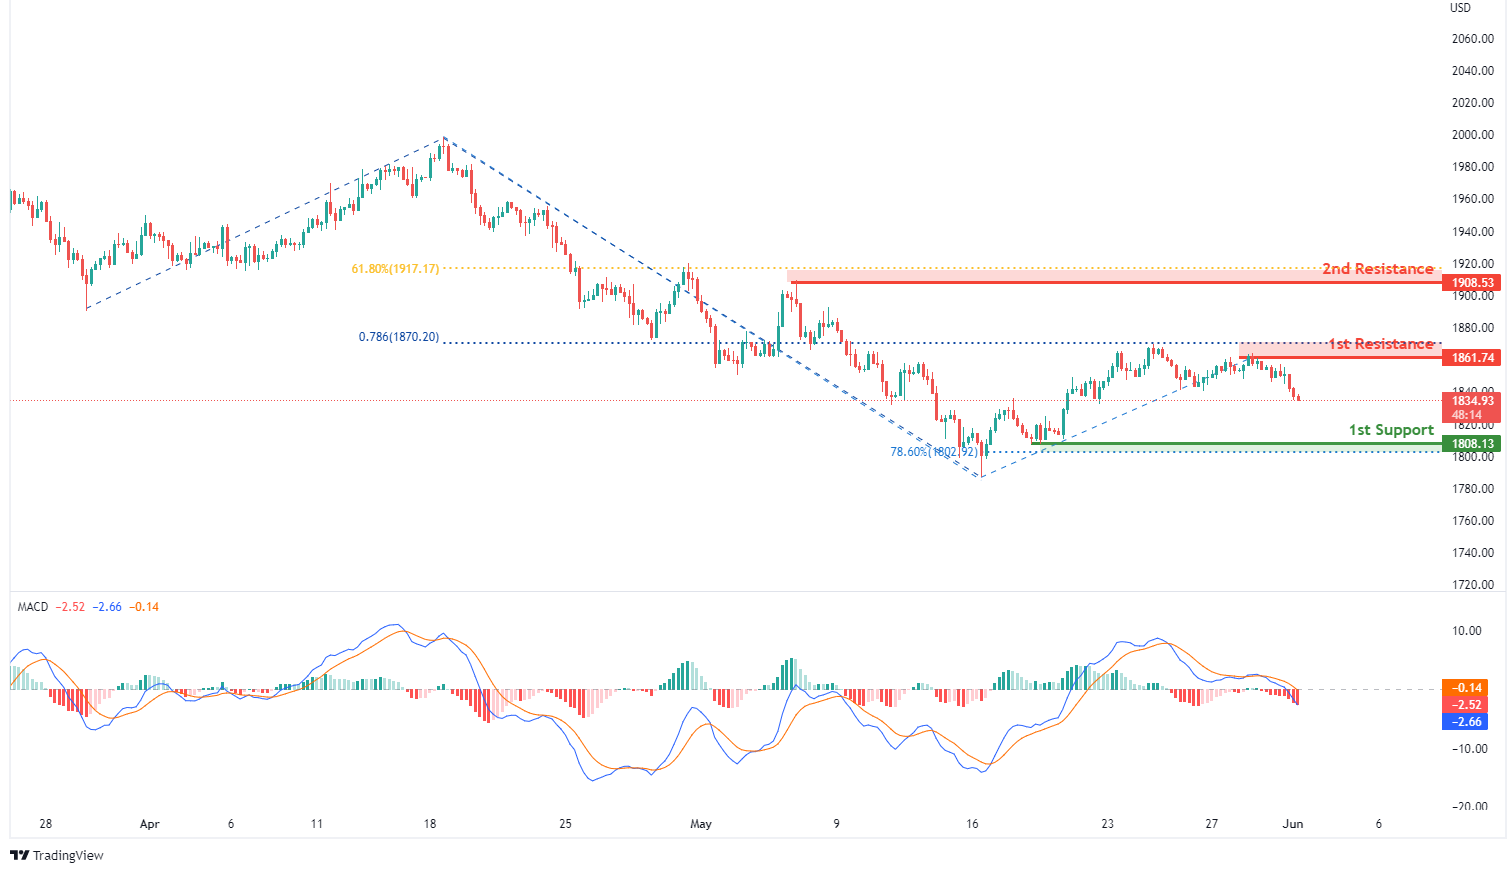
XAU/USD (GOLD):
On the H4, with MACD moving in a bearish momentum, we have a bearish bias that price will drop from our 1st resistance at 1861.74 where the horizontal swing high resistance and 78.6% fibonacci projection to our 1st support at 1808.13 in line with the horizontal swing low support and 78.6% Fibonacci retracement. Alternatively, price may break 1st resistance structure and head for 2nd resistance at 1908.53 where the horizontal swing high resistance and 61.8% fibonacci retracement are.
Areas of consideration:
- H4 time frame, 1st Resistance at 1861.74
- H4 time frame, 1st Support at 1808.13
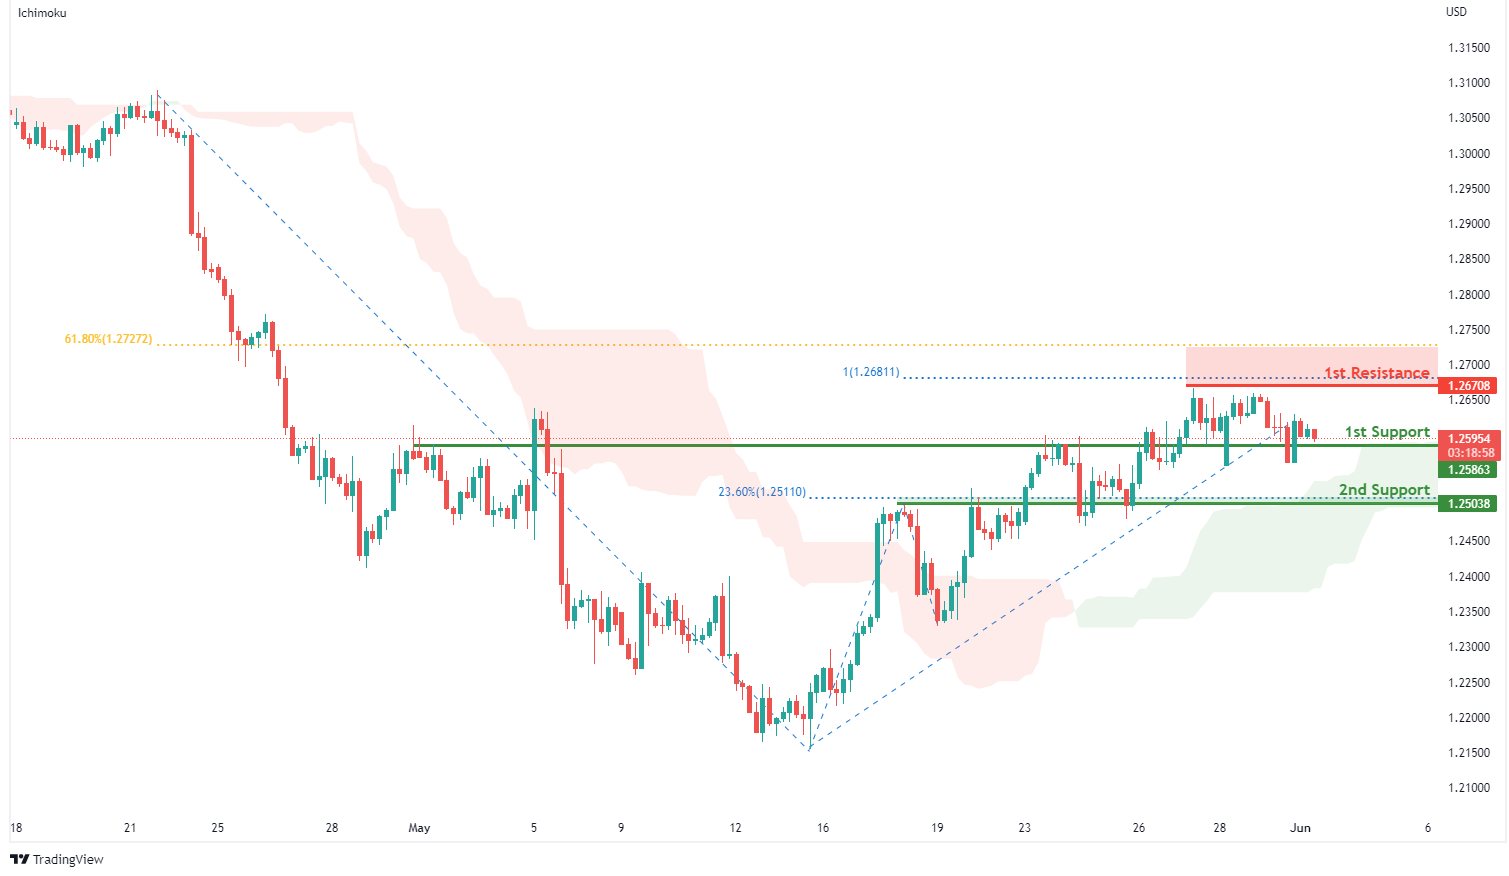
GBP/USD:
On the H4, with price moving above the ichimoku indicator, we have a bullish bias that price will rise from our 1st support at 1.25863 where the horizontal overlap support is to our 1st resistance at 1.26708 in line with the 61.8% Fibonacci retracement, 100% Fibonacci projection and swing high resistance. Alternatively, price may break 1st support structure and head for 2nd support at 1.25038 where the horizontal overlap support and 23.6% fibonacci retracement are.
Areas of consideration:
- H4 1st resistance at 1.26708
- H4 1st support at 1.25863
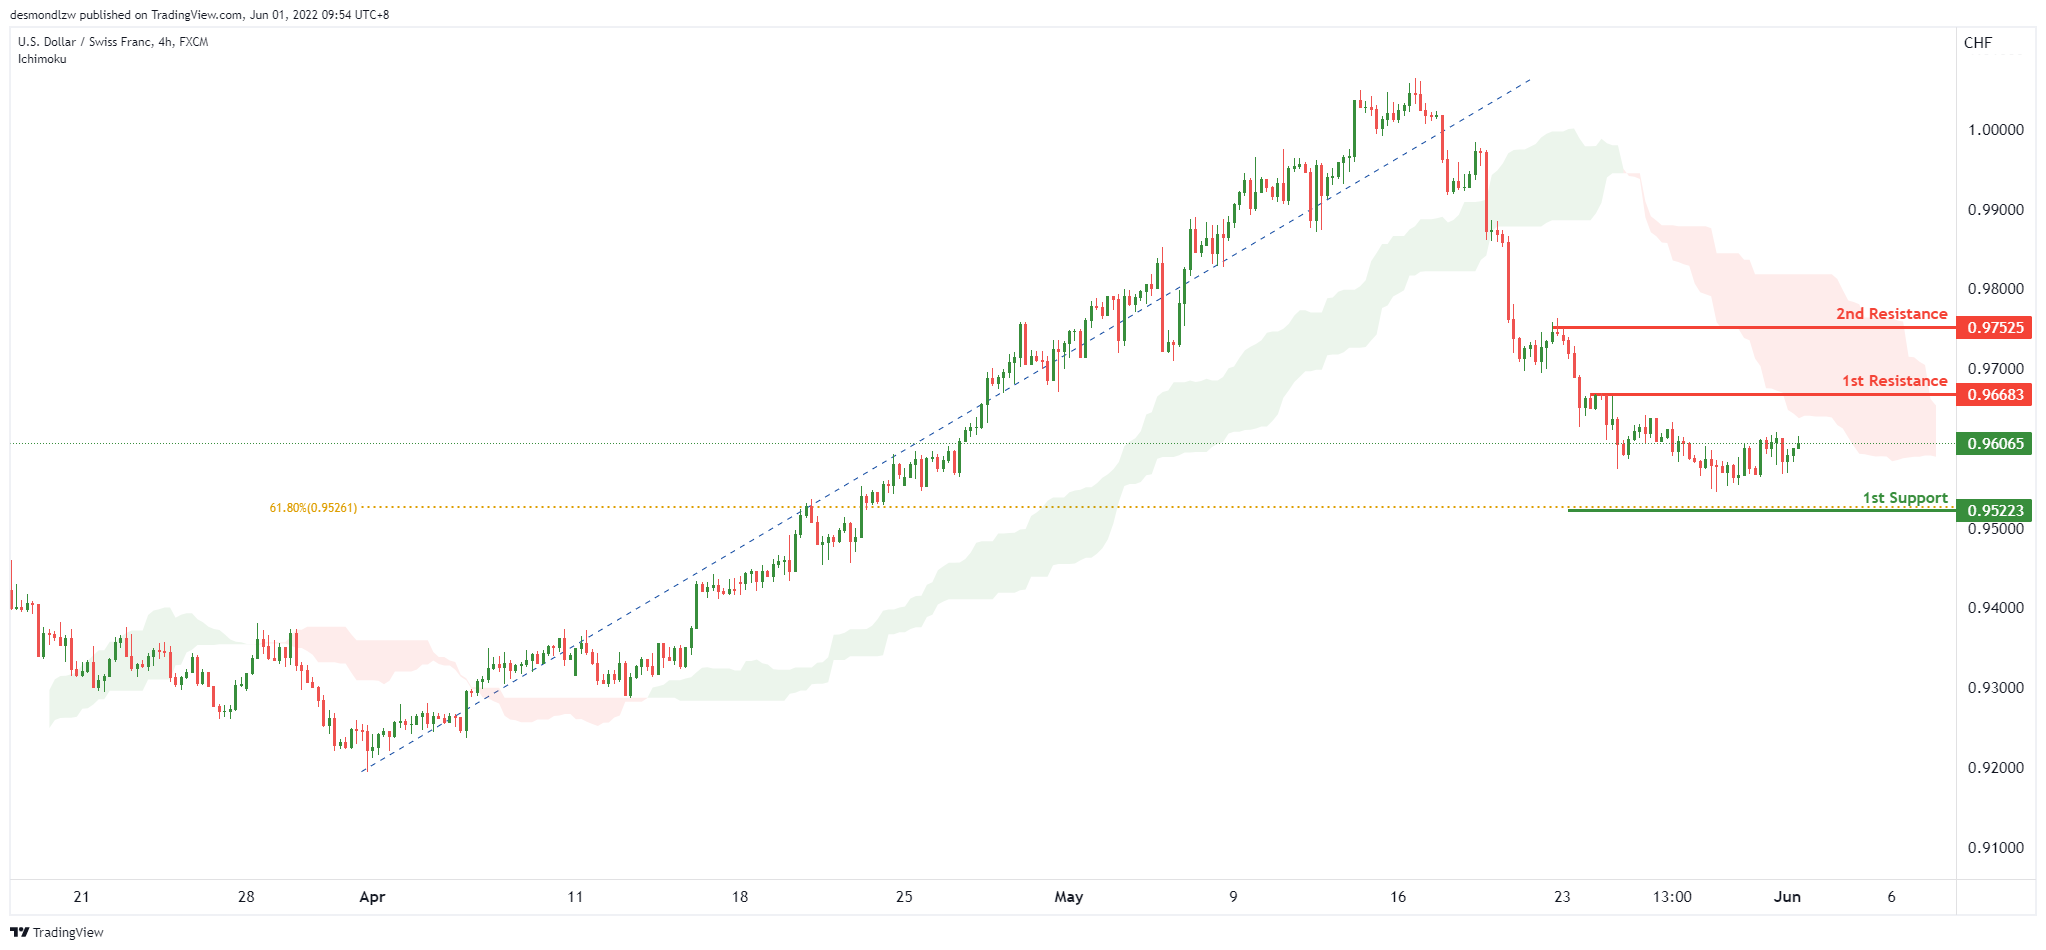
USD/CHF:
On the H4, with price moving below the ichimoku cloud, we have a bearish bias that price will drop to our 1st support at 0.95223 where the 61.8% Fibonacci retracement is from our 1st resistance at 0.96673 in line with the pullback resistance. Alternatively, price may break 1st resistance structure and head for 2nd resistance at 0.97525 where the swing high resistance is.
Areas of consideration
- 1st support level at 0.95223
- 1st resistance level at 0.96673
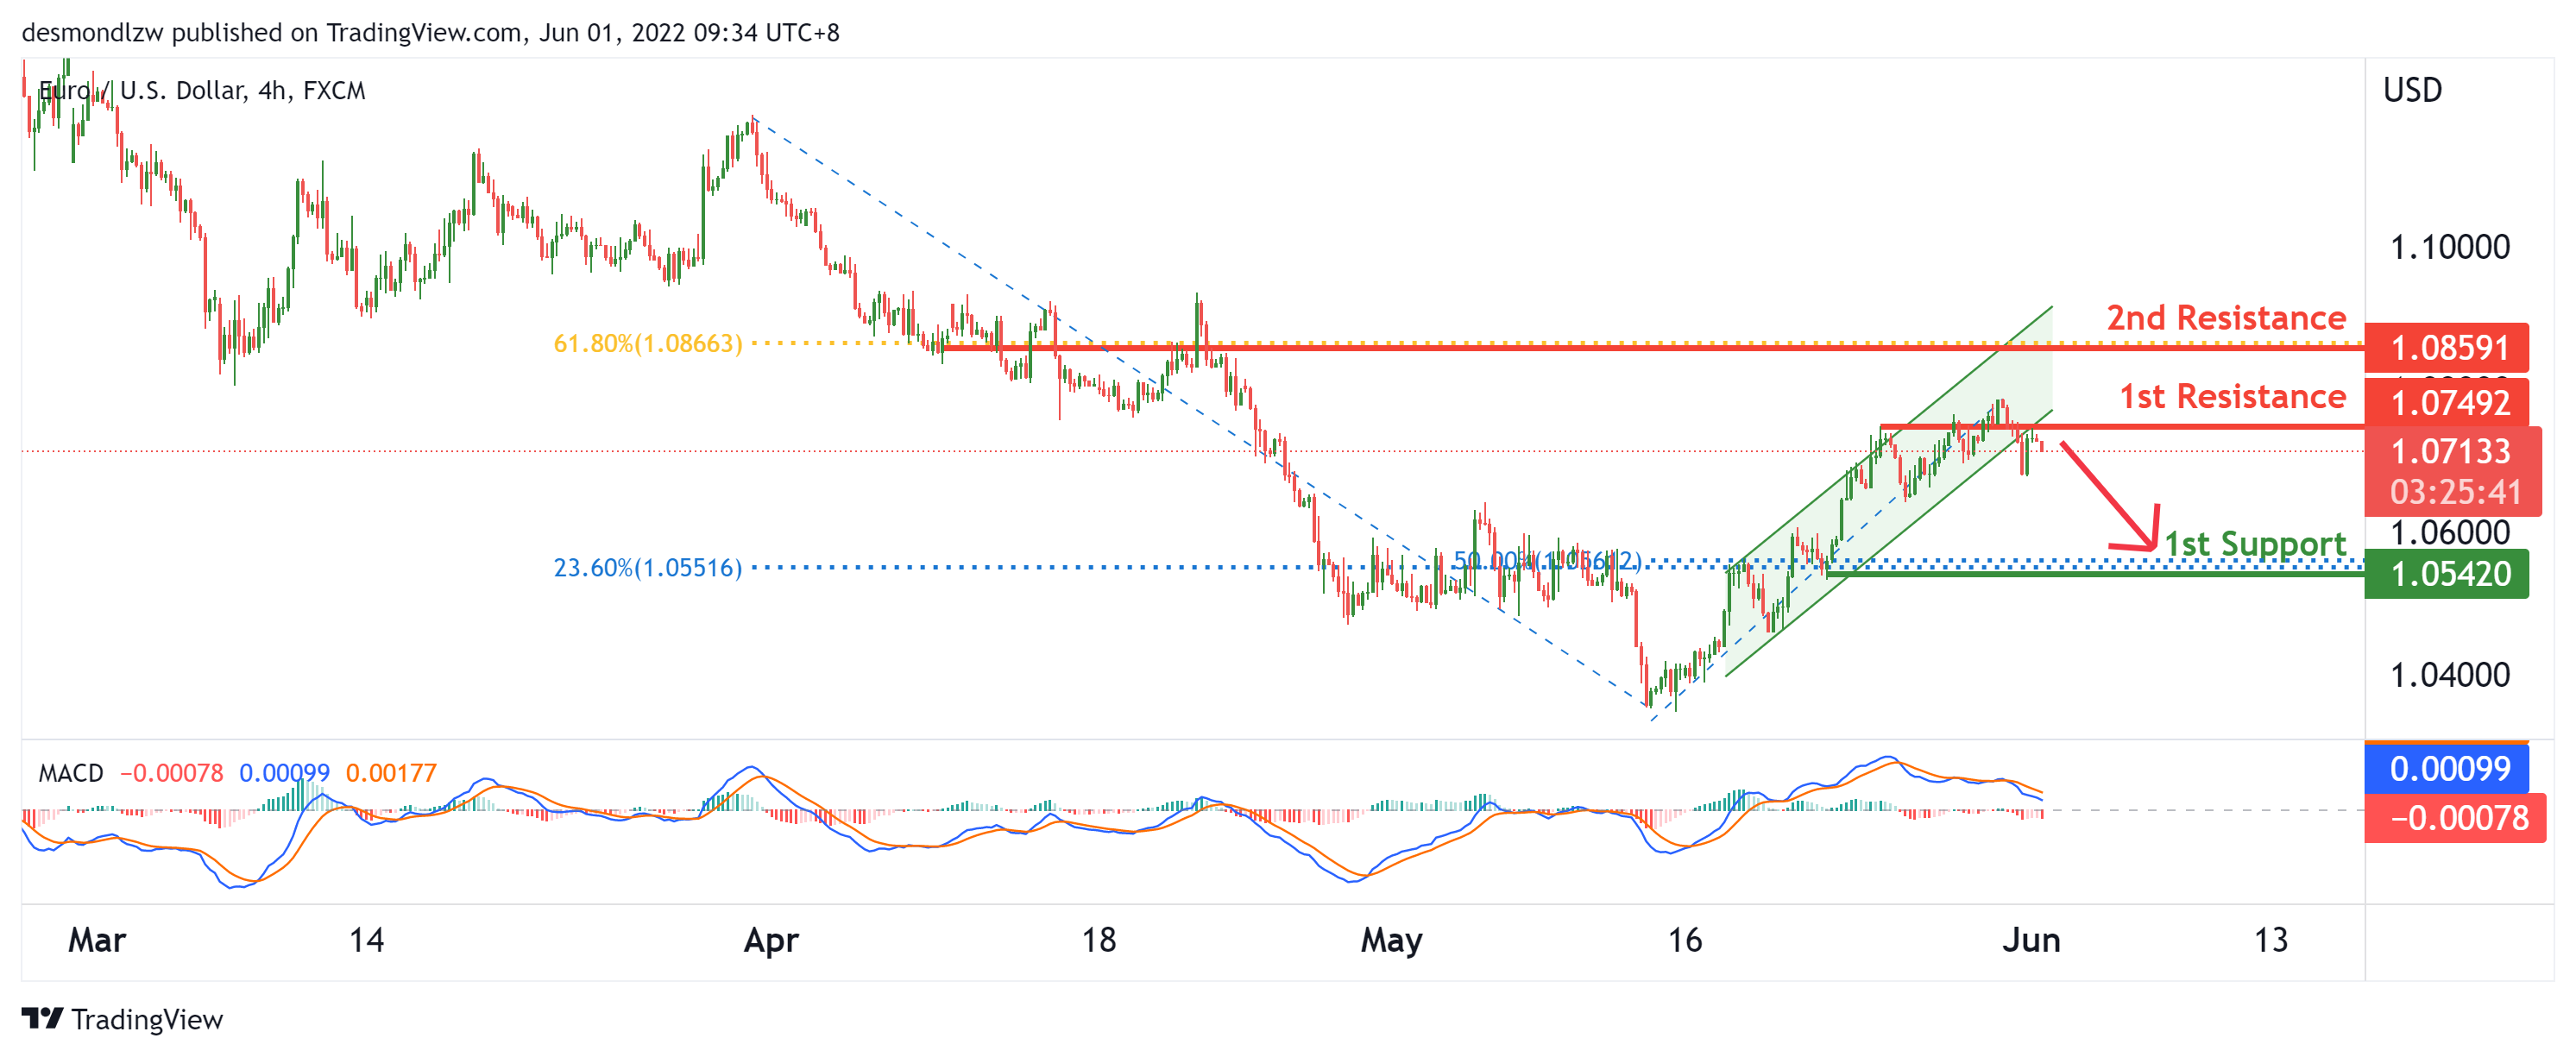
EUR/USD :
On the H4, with price showing bearish pressure on the MACD indicator and price recently breaking the ascending trend channel, we have a bearish bias that price will drop from our 1st overlap resistance at 1.07492 to our 1st support at 1.0542 in line with the 23.6% fibonacci retracement and 50% fibonacci retracement. Alternatively, price may reverse off the 1st resistance and rise to the 2nd resistance at 1.08591
Areas of consideration :
- H4 1st resistance at 1.07492
- H4 1st support at 1.0542
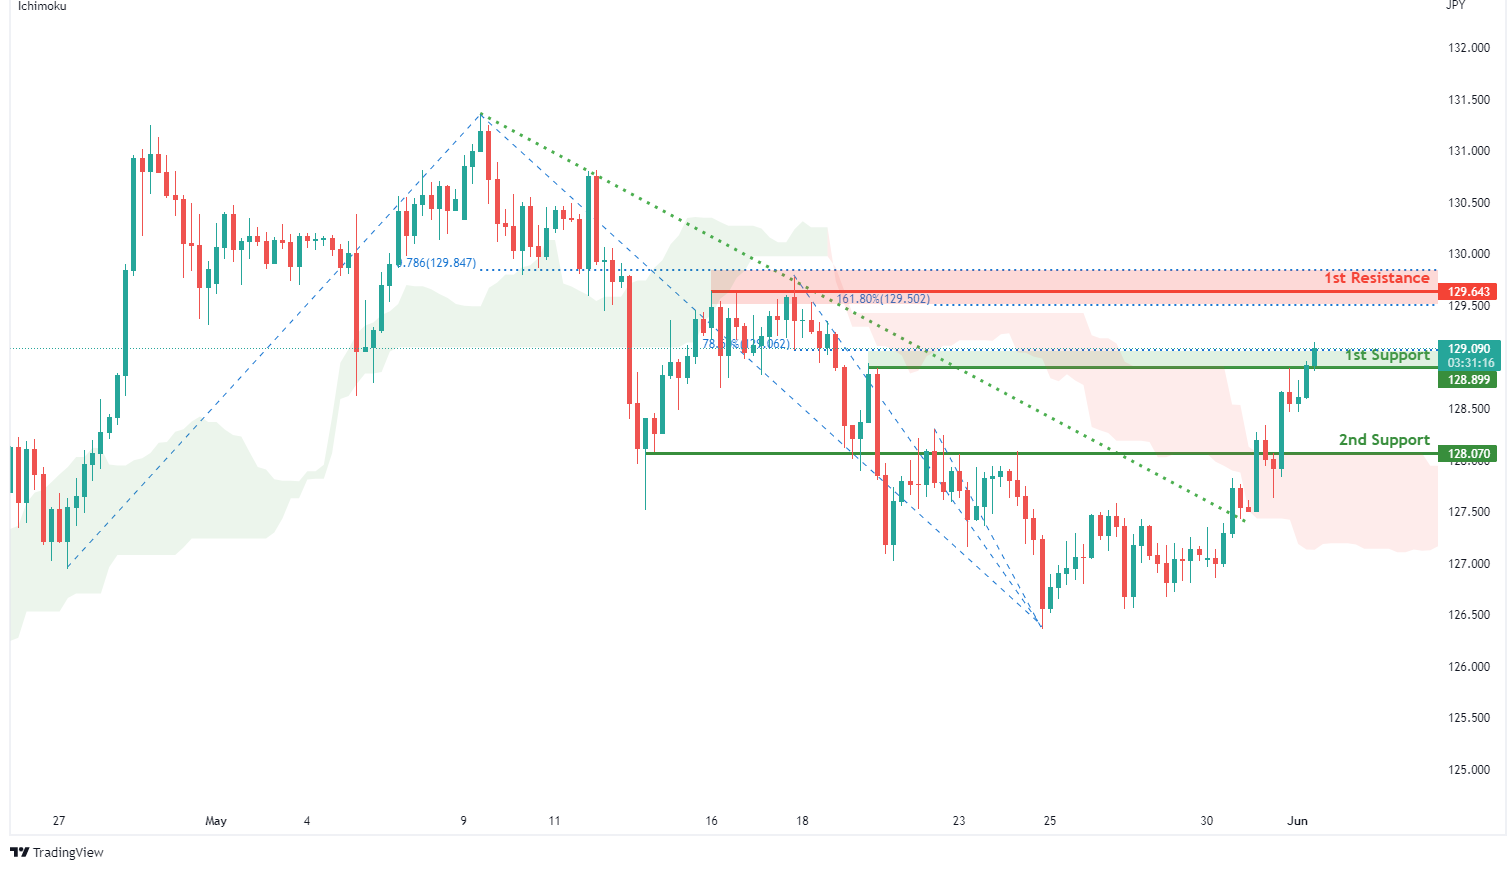
USD/JPY:
On the H4, with prices moving above the ichimoku indicator and breakout from descending trendline, we have a bullish bias that price will rise from our 1st support at 128.899 where the horizontal pullback support and 78.6% fibonacci projection are to our 1st resistance at 129.643 in line with the swing high resistance, 161.8% Fibonacci extension and 78.6% fibonacci projection. Alternatively, price may break 1st support structure and head for 2nd support at 128.070 where the horizontal overlap support is.
Areas of consideration:
- H4 time frame, 1st resistance at 129.643
- H4 time frame, 1st support at 128.899
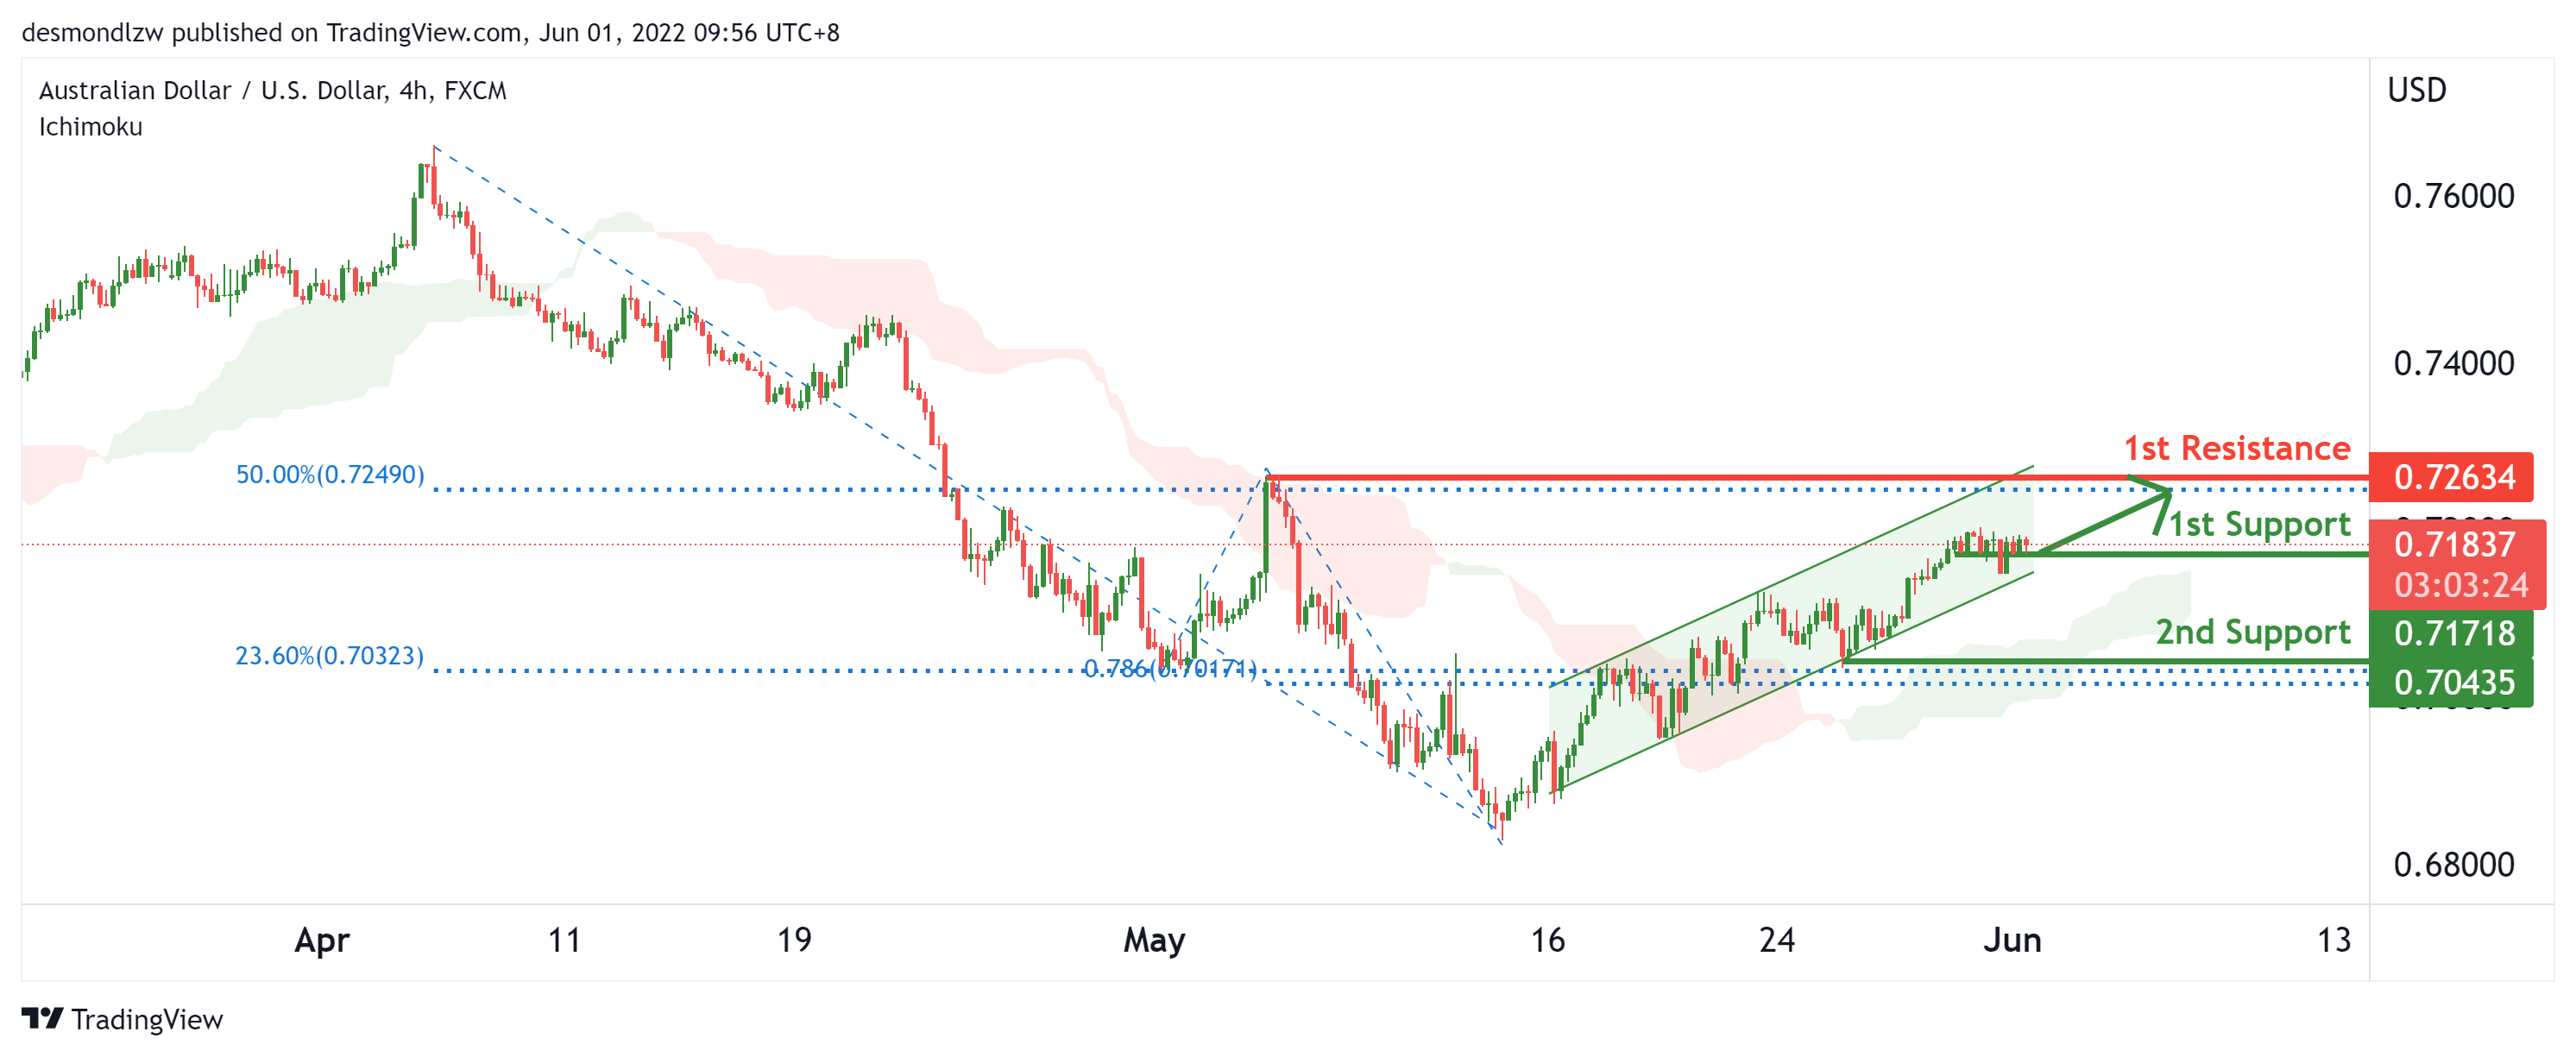
AUD/USD:
On the H4, with price moving above the ichimoku cloud and price moving within the ascending trend channel, we have a bullish bias that price will rise to our 1st resistance at 0.72634 where the swing high is in line with the 50% Fibonacci retracement from our 1st support at 0.71837. Additionally, price is moving into a bullish pressure as shown in the MACD indicator which supports our bullish bias. Alternatively, price may break 1st support and head for 2nd support at 0.70435 where the horizontal pullback support is, in line with the 78.6% fibonacci projection and 23.6% Fibonacci retracement.
Areas of consideration
- H4 1st resistance at 0.72634
- H4 1st support at 0.71837
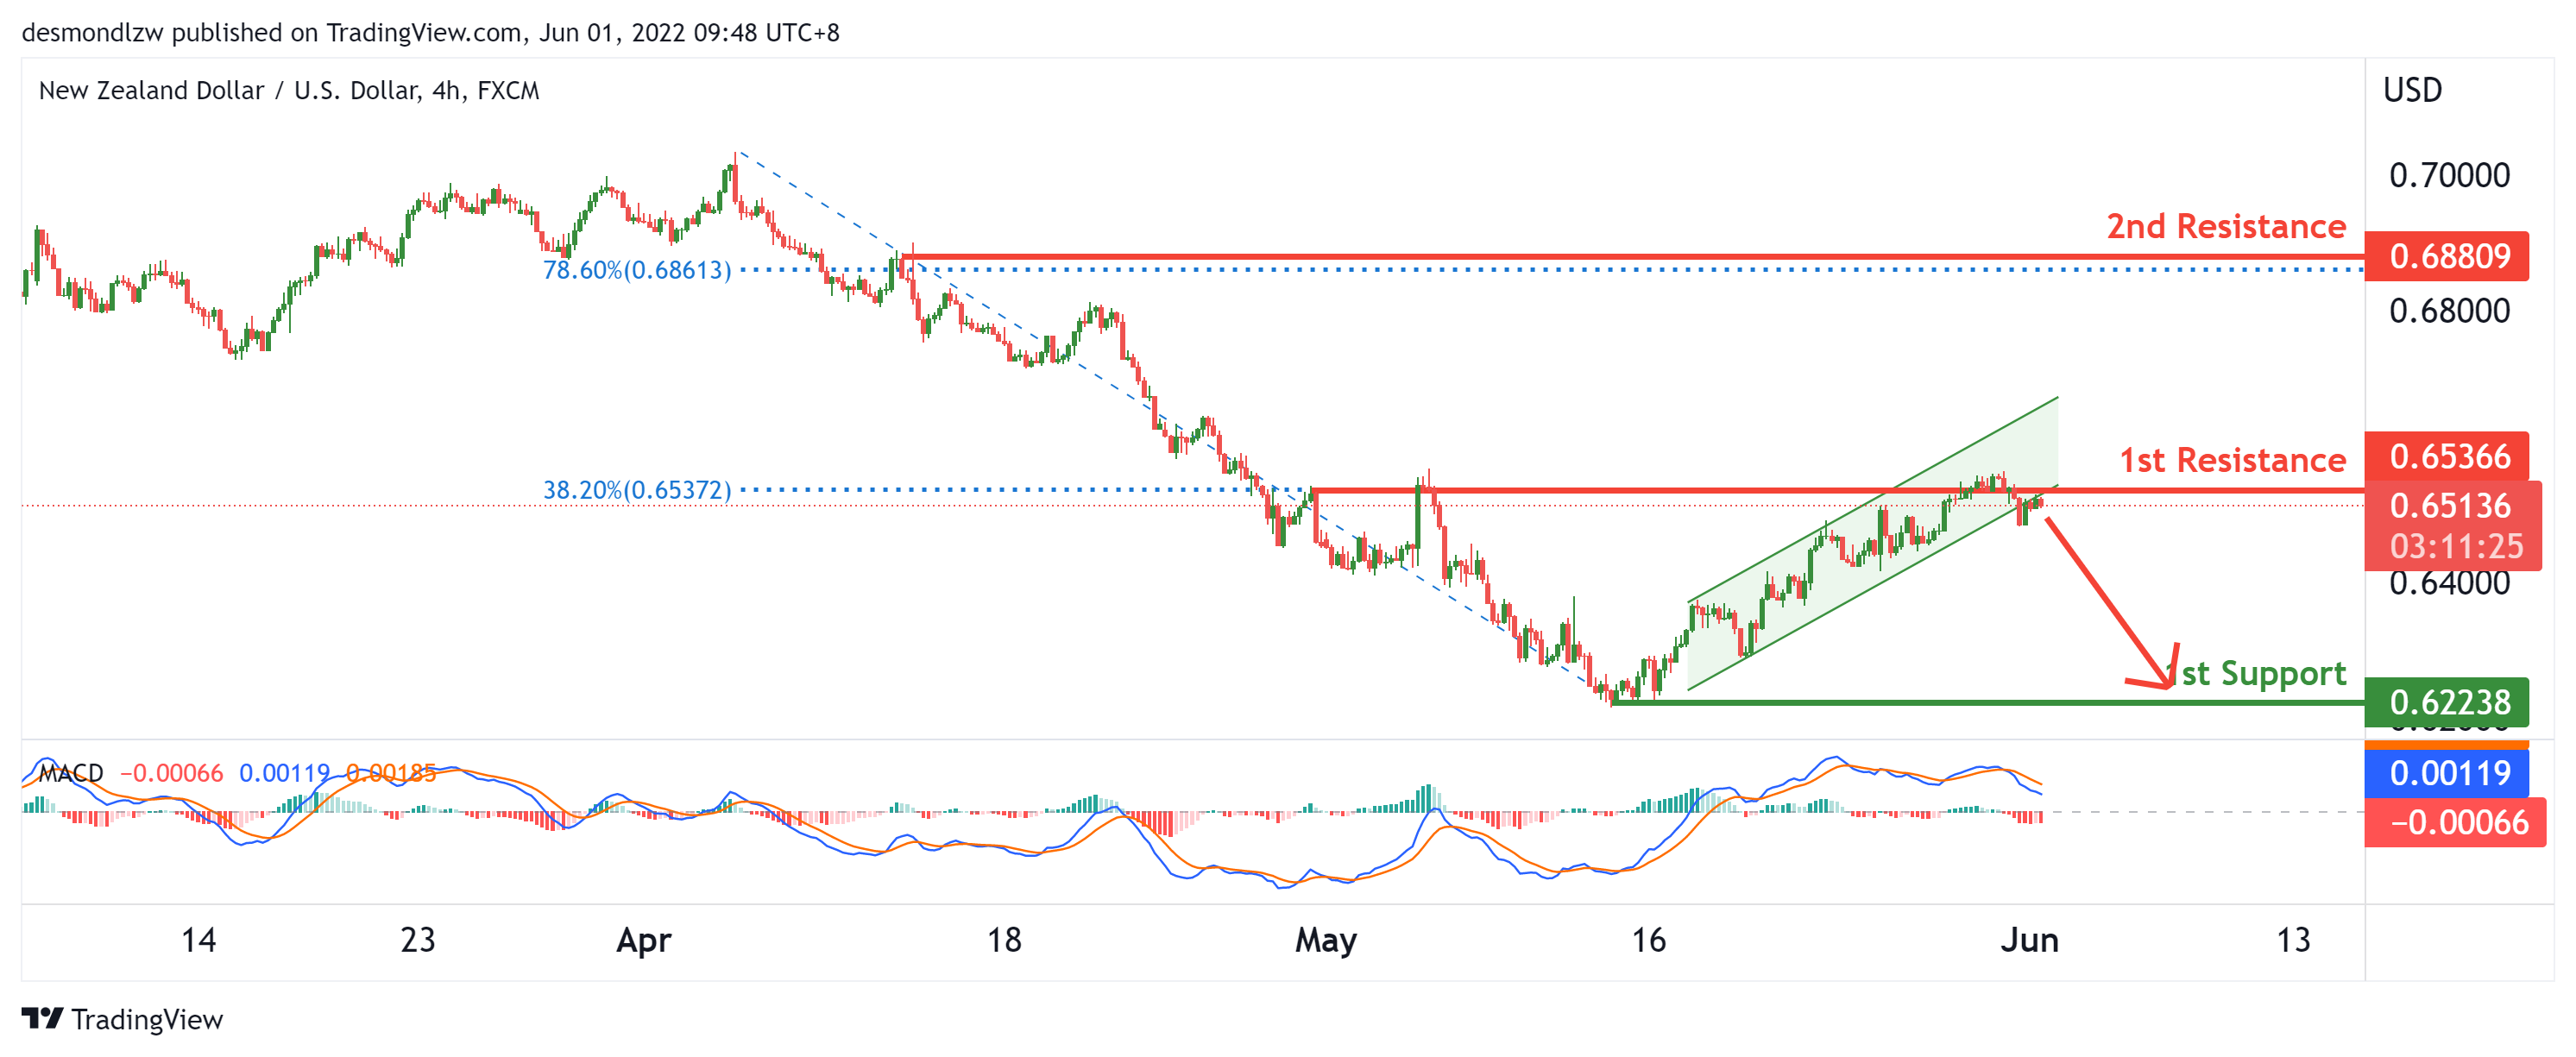
NZD/USD:
On the H4, with price showing bearish pressure on the MACD indicator and price recently breaking the ascending trend channel, we have a bearish bias that price will drop from our 1st overlap resistance at 0.65366 in line with the 38.2% fibonacci retracement to our 1st support at 0.62238 at the swing low. Alternatively, price may reverse off the 1st resistance and rise to the 2nd resistance at 0.68809
Areas of consideration:
- H4 time frame, 1st support at 0.62238
- H4 time frame, 1st resistance at 0.68809
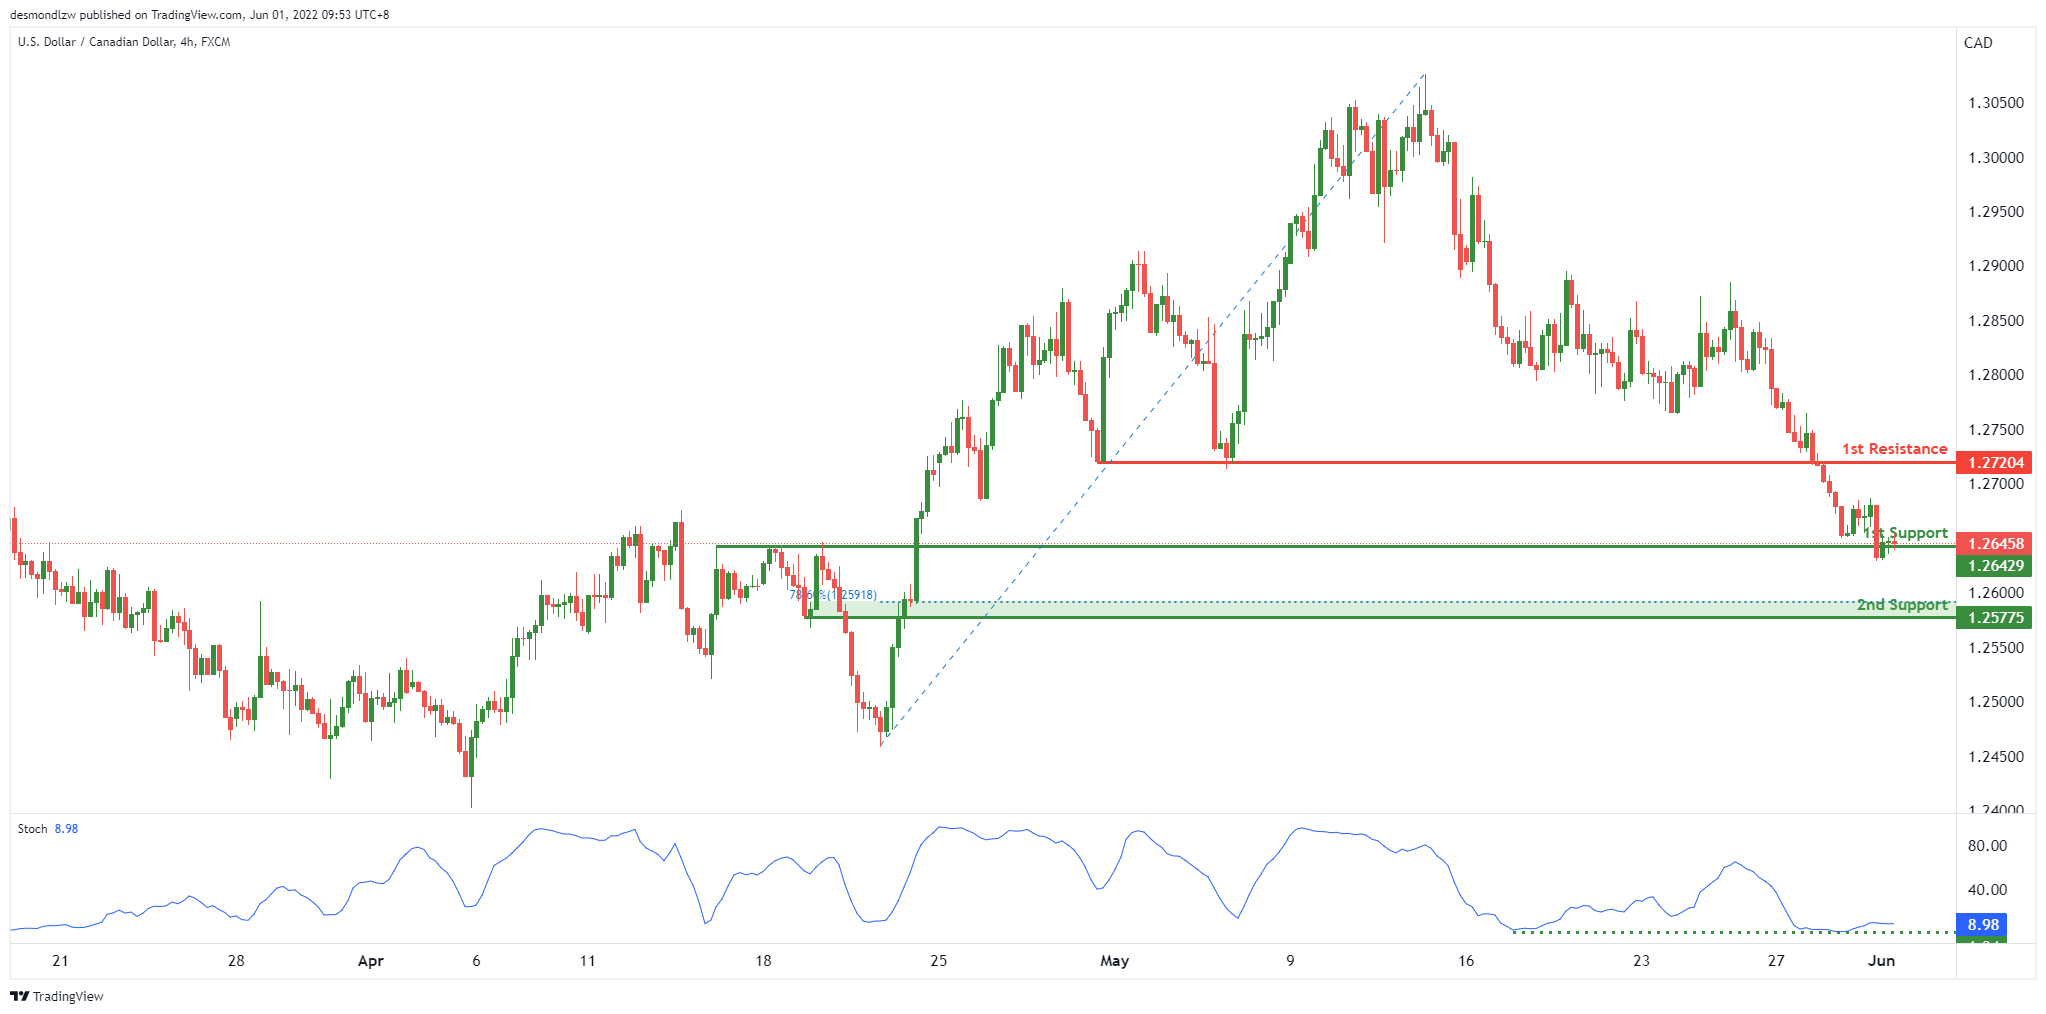
USD/CAD:
On the H4, with price expected to bounce off the stochastics, we have a bullish bias that price will rise to our 1st resistance at 1.27204 where the horizontal pullback resistance is from our 1st support at 1.26429 in line with the horizontal pullback support.
Areas of consideration:
- H4 time frame, 1st resistance at 1.27204
- H4 time frame, 1st support at 1.26429
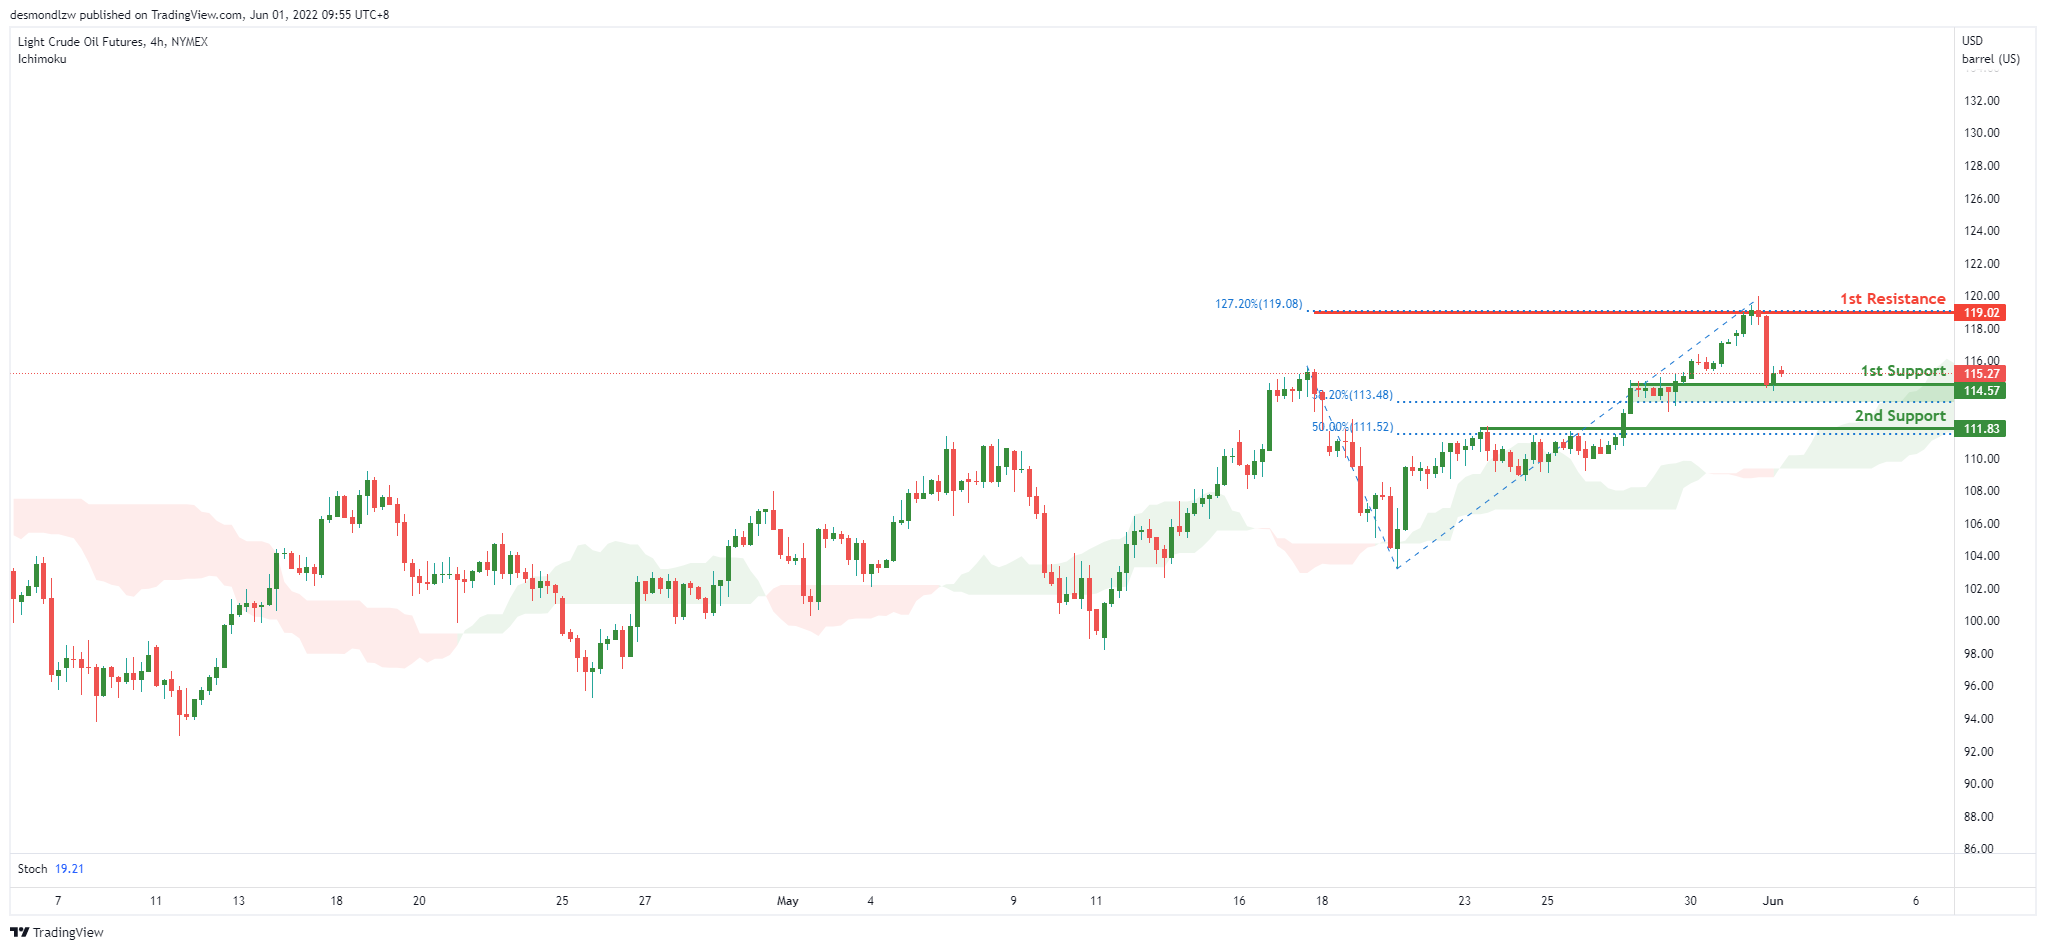
OIL:
On the H4, with price expected to reverse off the stochastics indicator, we have a bearish bias that price will drop to our 1st support at 112 where the 23.6% Fibonacci retracement is from our 1st resistance at 119.02 in line with the swing high resistance. Alternatively, price may break 1st resistance structure and head for 2nd resistance at 123.10 where the 127.2% Fibonacci extension is.
Areas of consideration:
- H4 time frame, 1st resistance of 119.02
- H4 time frame, 1st support of 112
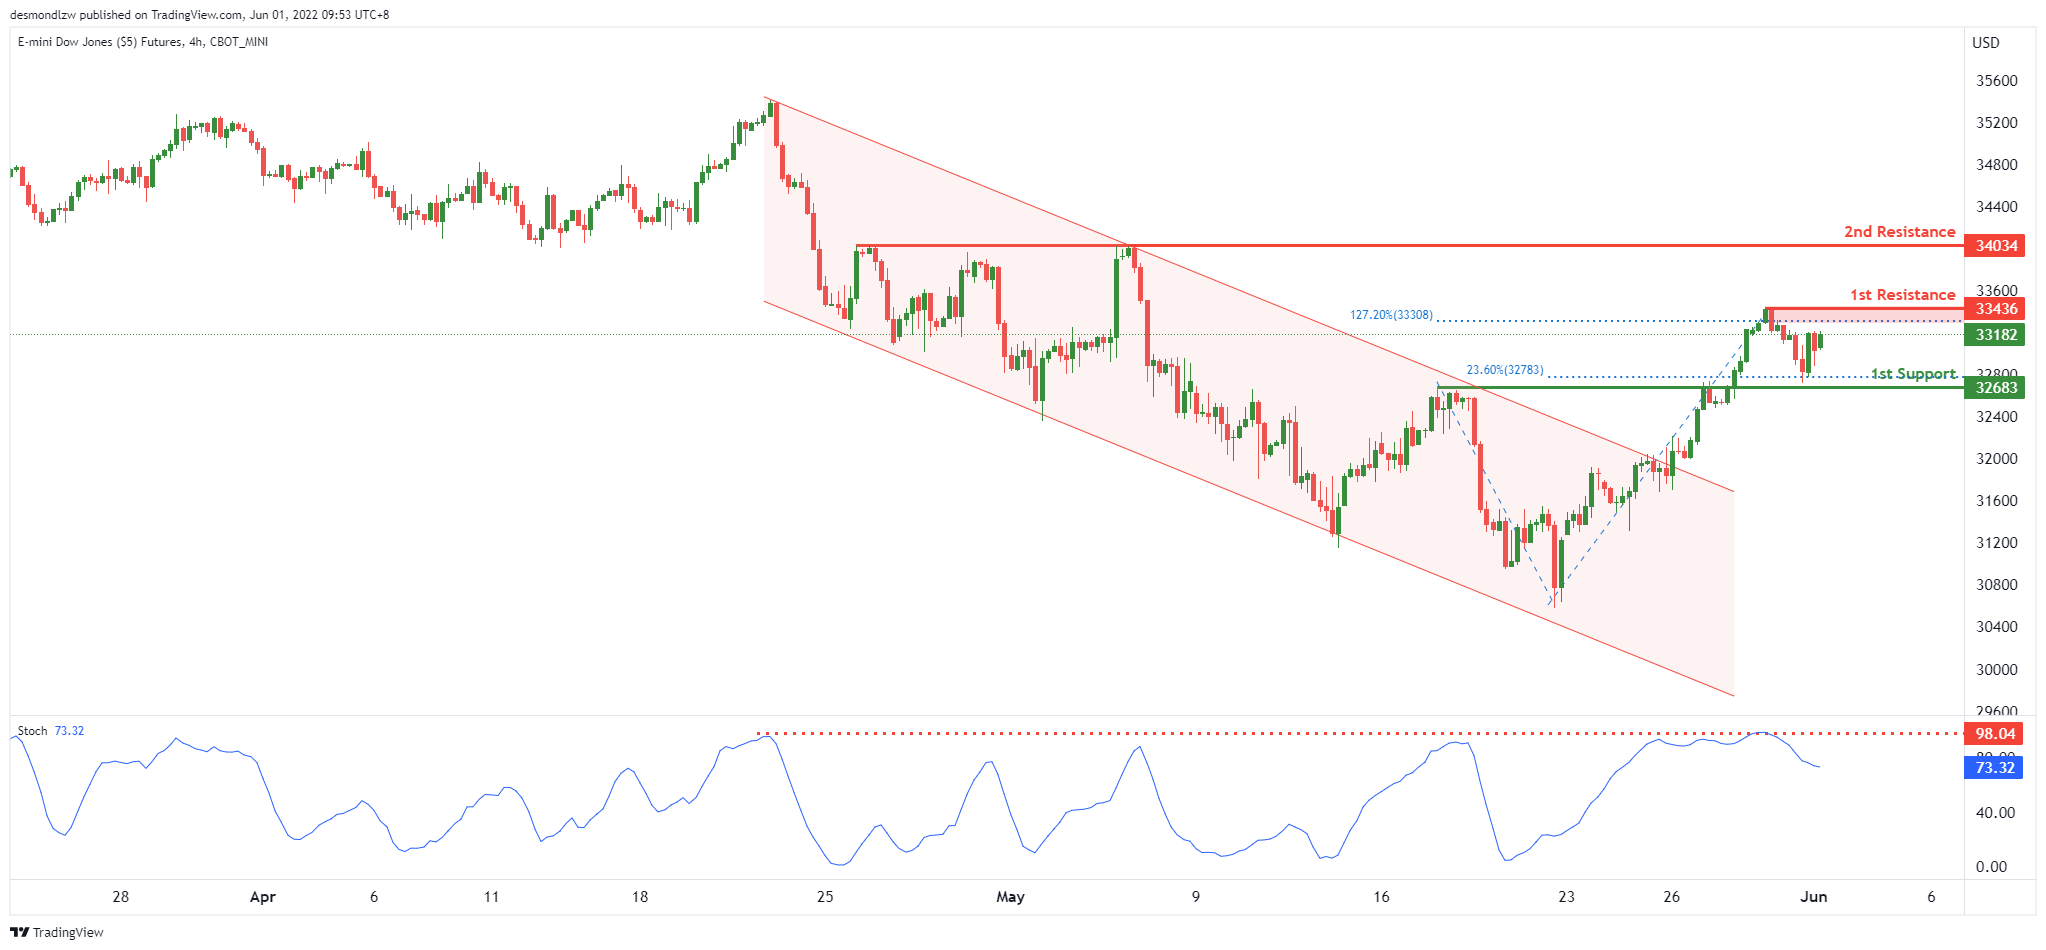
Dow Jones Industrial Average:
On the H4, with price expected to reverse off the stochastics indicator, we have a bearish bias that price will drop to our 1st support at 32683 where the 23.6% Fibonacci retracement is from our 1st resistance at 33463 in line with the swing high resistance. Alternatively, price may break 1st resistance structure and head for 2nd resistance where the horizontal swing high resistance is.
Areas of consideration :
- H4 time frame, 1st resistance at 33463
- H4 time frame, 1st support at 32683
The accuracy, completeness and timeliness of the information contained on this site cannot be guaranteed. IC Markets does not warranty, guarantee or make any representations, or assume any liability regarding financial results based on the use of the information in the site.
News, views, opinions, recommendations and other information obtained from sources outside of www.icmarkets.com.au, used in this site are believed to be reliable, but we cannot guarantee their accuracy or completeness. All such information is subject to change at any time without notice. IC Markets assumes no responsibility for the content of any linked site.
The fact that such links may exist does not indicate approval or endorsement of any material contained on any linked site. IC Markets is not liable for any harm caused by the transmission, through accessing the services or information on this site, of a computer virus, or other computer code or programming device that might be used to access, delete, damage, disable, disrupt or otherwise impede in any manner, the operation of the site or of any user’s software, hardware, data or property.
