Introduced to the western world By Steve Nilson, Japanese candlesticks are an effective way to forecast short and long-term market direction. What makes this concept so interesting is that each trader we’ve met seems to have their own unique approach.

The inverted hammer, or sometimes referred to as a ‘shooting star’ (Japanese name: tohba), is considered, at least in our opinion, to be a reversal signal. For some candlestick enthusiasts, however, an inverted hammer is strictly a bullish signal, whereas a shooting star is seen as a bearish signal. If you’re familiar with the ‘hammer’ candlestick pattern, this’ll make sense. Nevertheless, in appearance, we see absolutely no difference between the two, and usually just refer to both as inverted hammers as these candles are, under no circumstances, never traded in isolation. This will hopefully make more sense as we progress.
Although the inverted hammer is an isolated pattern, various traders insist on the preceding candle to be well-filled. We don’t necessarily require this for the pattern to make sense. The context surrounding the candlestick formation is always the main point of concern.
The diagram below shows how we perceive the inverted hammer candlestick pattern (do note that the candle has been intentionally enlarged):
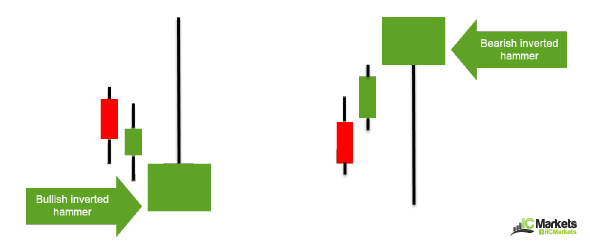
The configuration
As you can see from the illustration above, we do not concern ourselves with the colour of the body, nor do we place much emphasis on the preceding candles. What we do like to see though is a reasonably well-formed candle body that has little overhanging wicks/tails (shadow). The body should also be reasonably sized, at least one-third of the candle range. Furthermore, the candlestick should be in harmony with its surroundings. Basically, we’re looking for definition and a candle that makes sense within the overall picture.
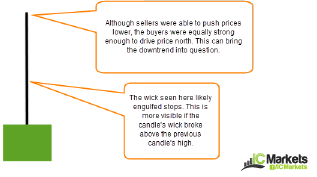
The psychology behind the inverted hammer
The diagram above denotes a bullish reversal signal. A bearish reversal signal would be the same, just reversed. Even if the candle formation is perfect in shape and size, it would, in our opinion, be inadvisable to trade this signal deprived of context. Context is king as far as we’re concerned!
How can I trade the inverted hammer?
We tend to use the inverted hammer as a confirmation signal more than anything else. For that reason, we will not look for this pattern UNTIL price is at an area of interest.
An example of an area of interest is a support/resistance level or a supply/demand area.
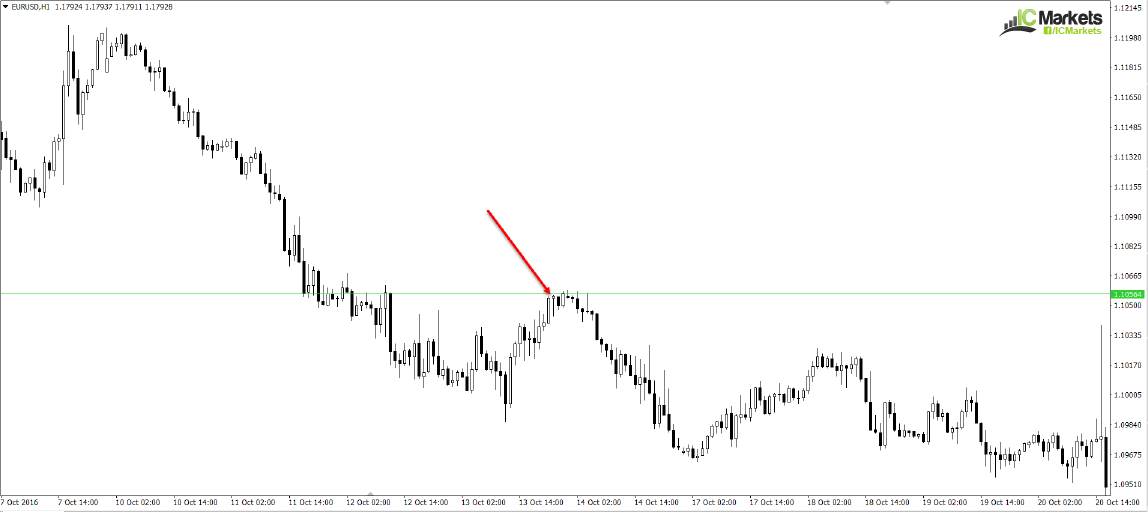
The chart above shows a resistance level on the H1 timeframe, which has reasonably strong history (check it out for yourself). The level, as you can see, was confirmed by a nice-looking inverted hammer formation as marked by a red arrow. Due to the location price printed the candle (a resistance), a hammer pattern would need to be reversed for it to make sense here, hence why we label this an inverted hammer and not a shooting star.
On the subject of timeframes, we do not subscribe to the theory that an inverted hammer pattern is solely an intraday signal. This, as far we are concerned, is applicable on all timeframes.
As for actually pulling the trigger, there are a few options on the table. Aggressive traders may look to execute a market order on the close of the candle, with stops placed beyond structure (resistance in the case above). For conservative traders, they may choose to hold fire and see how the following candle takes shape. The example above shows that a near-full-bodied bearish candle formed after the inverted hammer signal. This should be enough to warrant an entry. As well as this, we have met traders who will only consider an entry on the close of the inverted candle high/low. Naturally though, this would increase the stop-loss distance and thereby offer a less favourable risk/reward.
[wpi_designer_button id=23298]
In closing
An inverted hammer candlestick signal certainly has a place in a technician’s toolbox. As we mentioned above though, it is not our primary focus when selecting trades. It is, nevertheless, a tasty way of confirming a level or an area you’re unsure of. An example may be a supply zone that is being tested for a second time and you’re uncertain if the orders have been weakened. Waiting for a confirmation candle helps put the odds in one’s favour.