
EUR/USD:
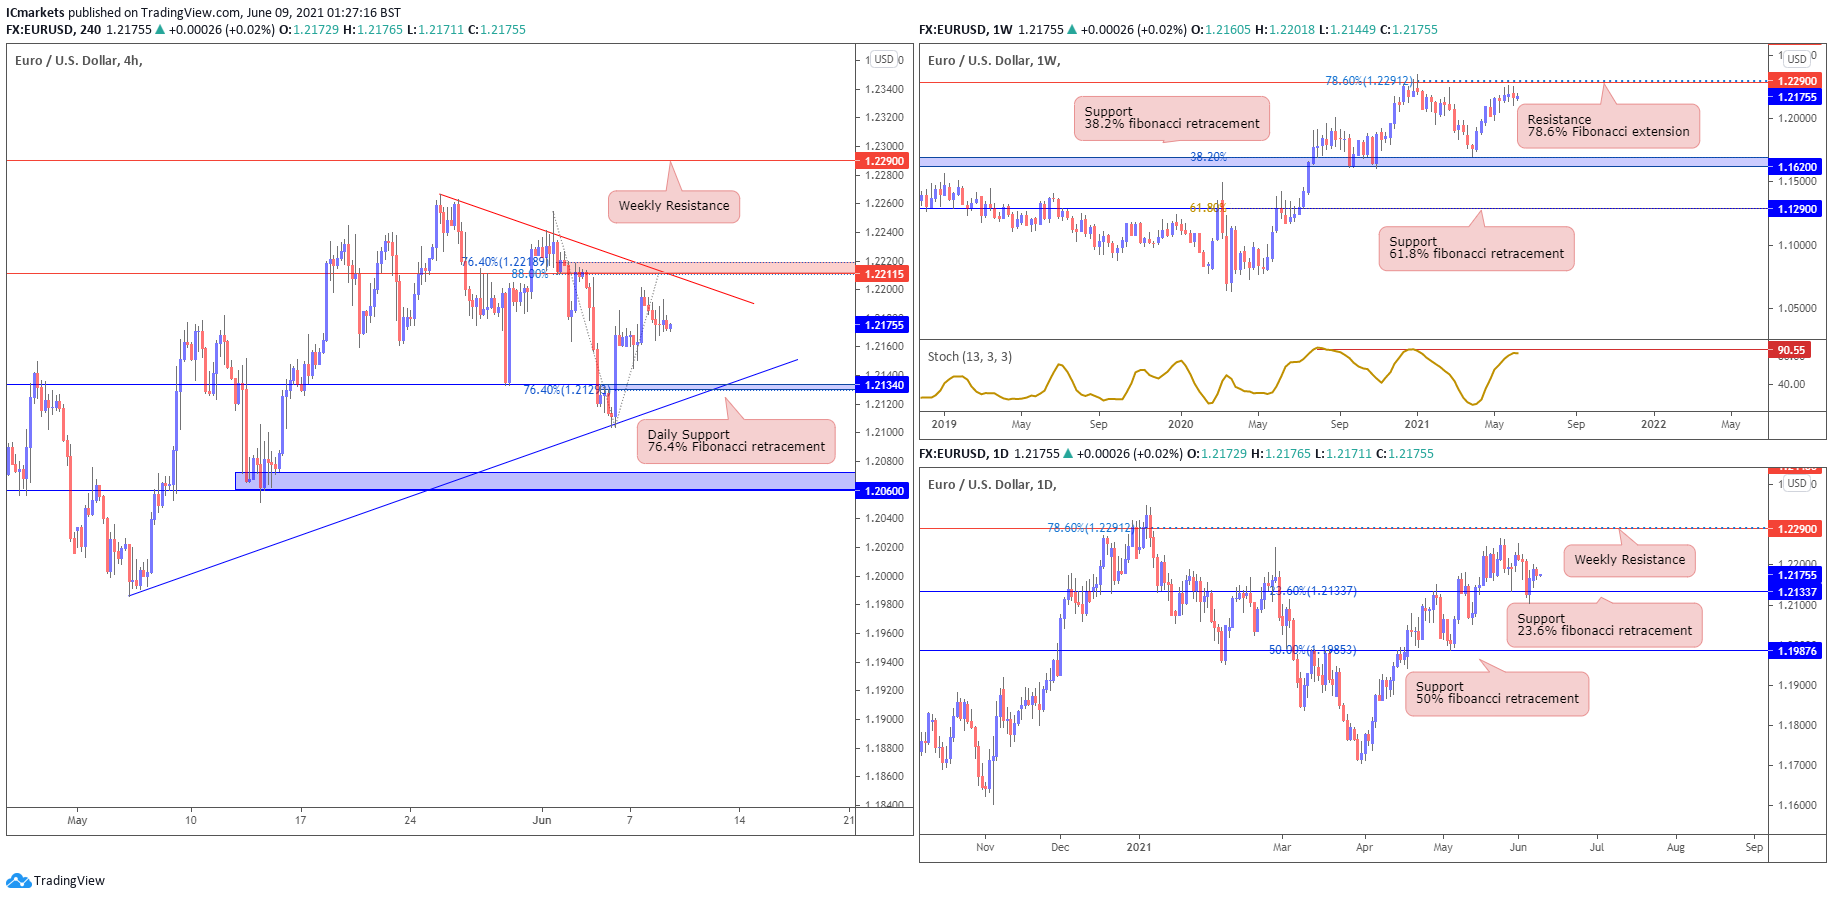
Looking at the weekly chart, we can see that prices are seeing further limited upside before it reaches our resistance area at 1.22900. On the daily chart, price bounced off key support at 1.21337 where we could possibly see some bullish upside with 1.22900 as our resistance target as well.
On the H4 timeframe, prices consolidating below downward trendline resistance. We could possibly see some bullish upside to trendline resistance at 1.22115, also in line with 76.4% Fibonacci retracement, 88% Fibonacci extension and previous overlap resistance. Breaking the downtrend line, we could see the price move up to our next resistance level at 1.22900.
If price pulls back, there will be a trendline support at 1.21340, in line with 76.4% Fibonacci retracement and previous swing low overlap support.
Price is trending within a symmetrical triangle where we would see a breakout/breakdown within the next few days.
Areas of consideration:
- H4 time frame, price may push up to 1.22115
- Otherwise, price will pull back to 1.21340
- Watch for a daily support at 1.21340
GBP/USD:
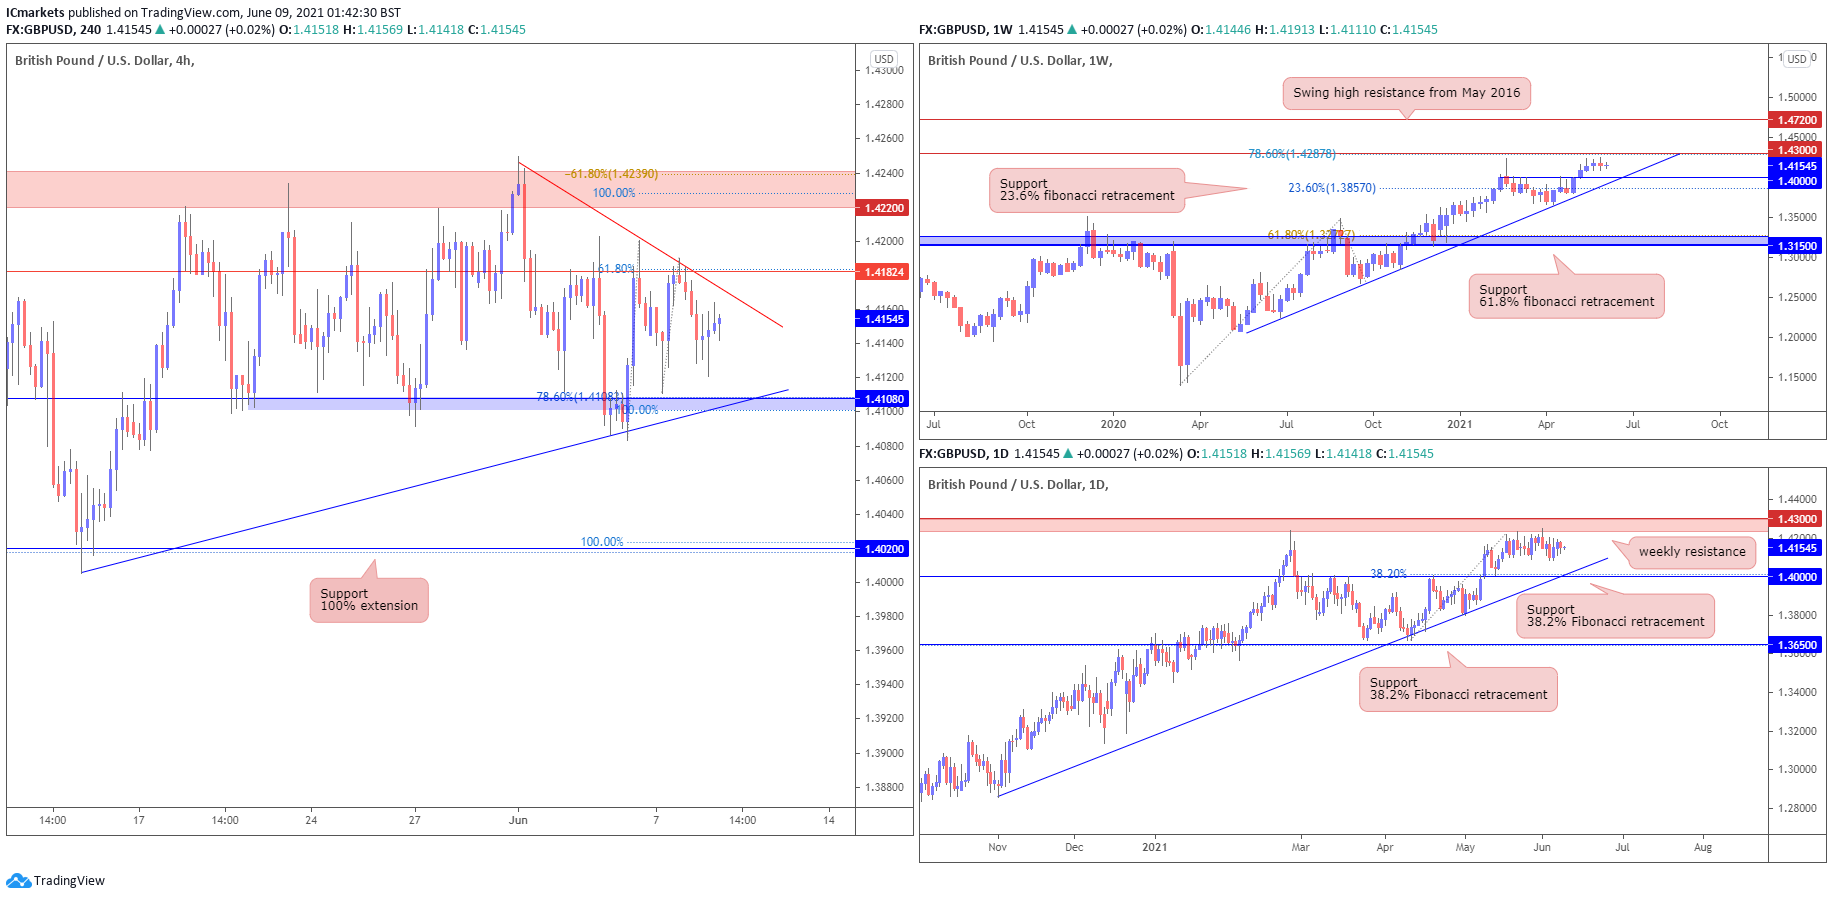
Looking at the weekly chart, we can see that prices are facing further bullish upside from our ascending trend line and support at 1.40000 where we could see a further upside above this level to our resistance target at 1.43000, in line with the 78.6% Fibonacci extension. The daily time frame echoes the same bullish view as well with limited upside towards 1.43000 as our resistance target.
On the H4 timeframe, prices are consolidating within our symmetrical triangle at 1.41545, just below our bearish trendline and 61.8% Fibonacci extension. Breaking the downtrend line and 61.8% Fibonacci extension, we could see the price move up to our next resistance level at 1.42200.
If price pulls back, there will be a trendline support at 1.41080, in line with 78.6% Fibonacci retracement and 100% Fibonacci extension.
Price is trending within a symmetrical triangle where we would see a breakout/breakdown within the next few days.
Areas of consideration:
- 42200 resistance area found on H4 time frame
- 41080 support area found on H4 timeframe
AUD/USD:
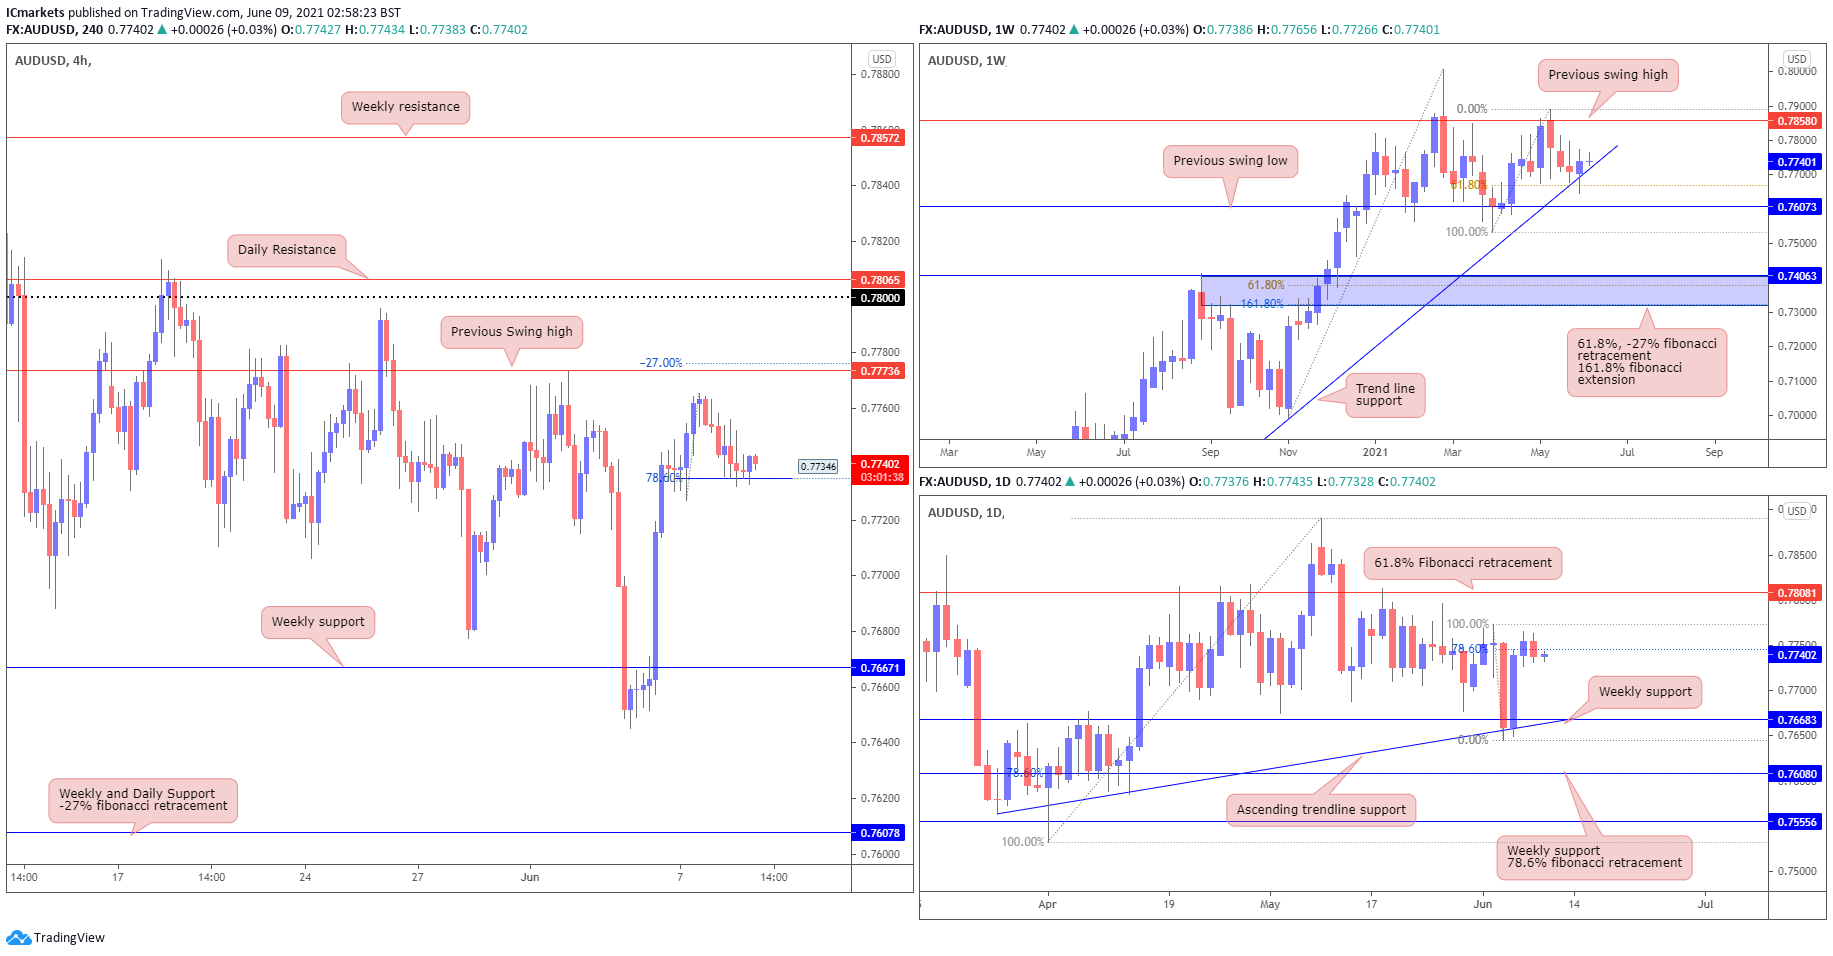
From the Weekly timeframe, we see price pushing beneath the ascending trendline and tapping on the 61.8% fibonacci retracement, before closing above it on the last day of the week. From the daily timeframe, we see a similar view, price is currently testing the 78.6% fibonacci retracement level at 0.77456, where we may see a push down towards the weekly support level at 0.76683, in line with ascending trendline support.
On the H4 timeframe, We saw price testing the 0.77346 level, in line with 78.6% fibonacci retracement where we may see a push up towards the 0.77736, in line with -27% fibonacci retracement and previous swing high.
Areas of consideration:
- H4 timeframe, price may push from 0.77346 towards 0.77736.
- Daily and weekly time frames showing bullish pressure.
USD/JPY
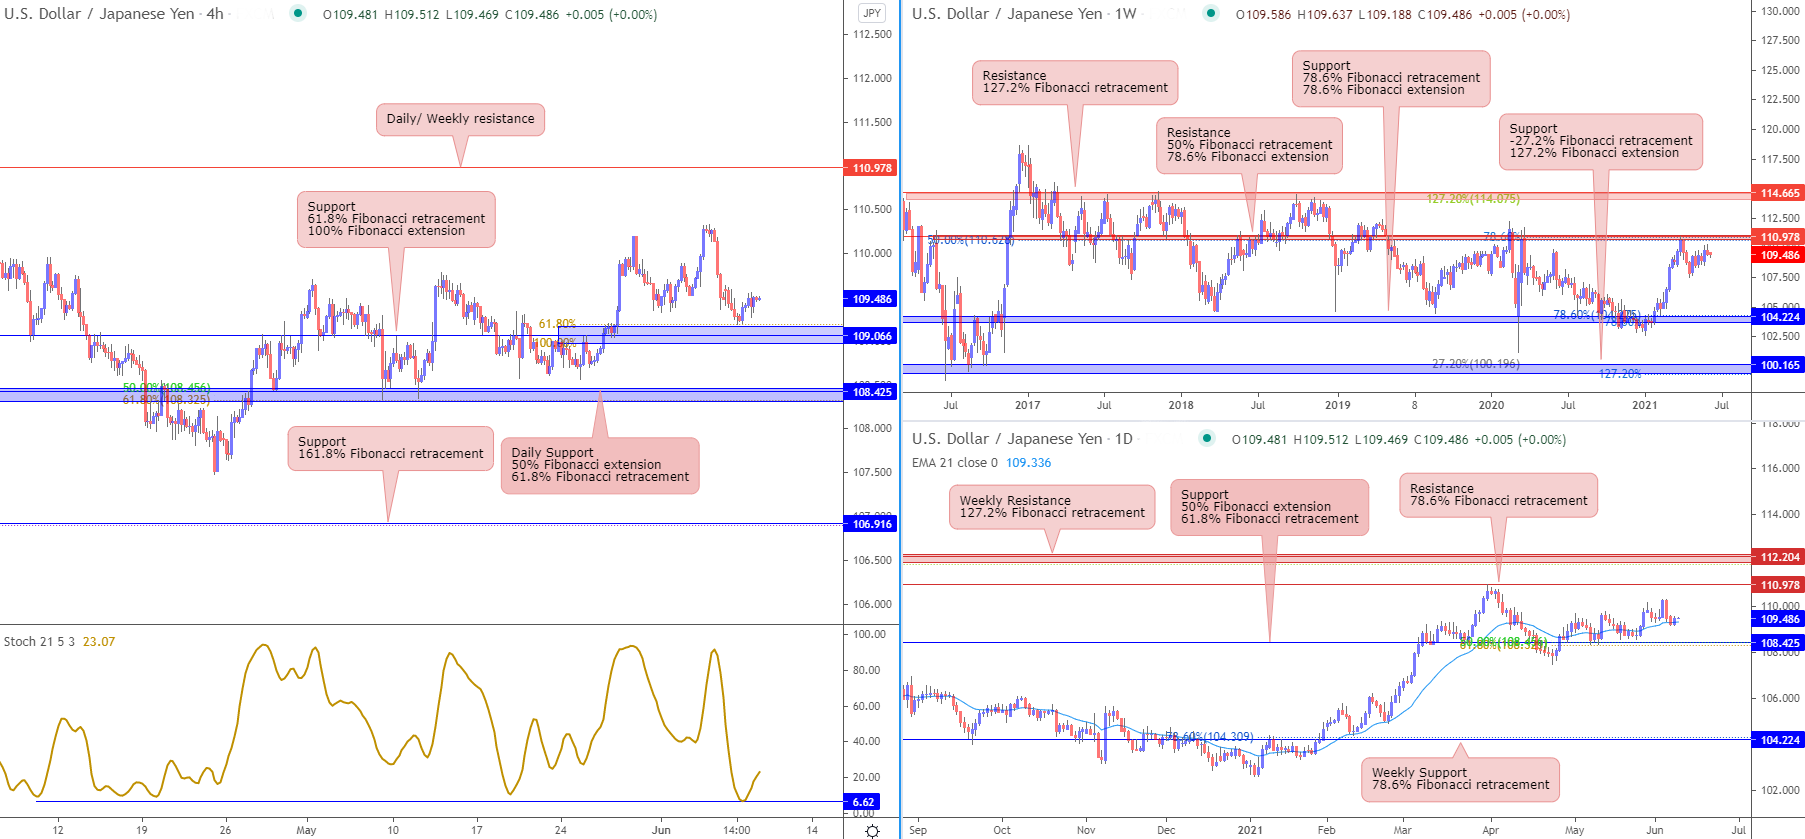
From the weekly timeframe, prices are facing resistance from horizontal swing high resistance which coincides with 50% Fibonacci retracement and 78.6% Fibonacci extension, taking support from 104.224 level which is in line with 78.6% Fibonacci retracement and 78.6% Fibonacci extension. On the daily time frame, prices are facing support from 108.425 level which coincides with 61.8% Fibonacci retracement and 50% Fibonacci extension. Prices might bounce towards daily resistance level 110.978 in line with 78.6% Fibonacci retracement. Daily EMA is also below prices, showing a bullish pressure for prices.
On the H4 timeframe, prices are bouncing from 109.066 level in line with 100% Fibonacci extension and 61.8% Fibonacci retracement towards daily resistance level 110.978. Otherwise, if prices did not push up further, prices could fall and take support on 108.425 level, in line with daily support level. Indicators on the daily timeframe suggest that the pullback is temporary and there is still a long term bullish pressure for prices. Stochastics has also bounced from 6.62 level, potential for further upside.
Areas of consideration:
- On the H4, prices might push up towards 110.978 daily resistance level
- 066 support level on the H4 timeframe
- 425 support level on the daily timeframe
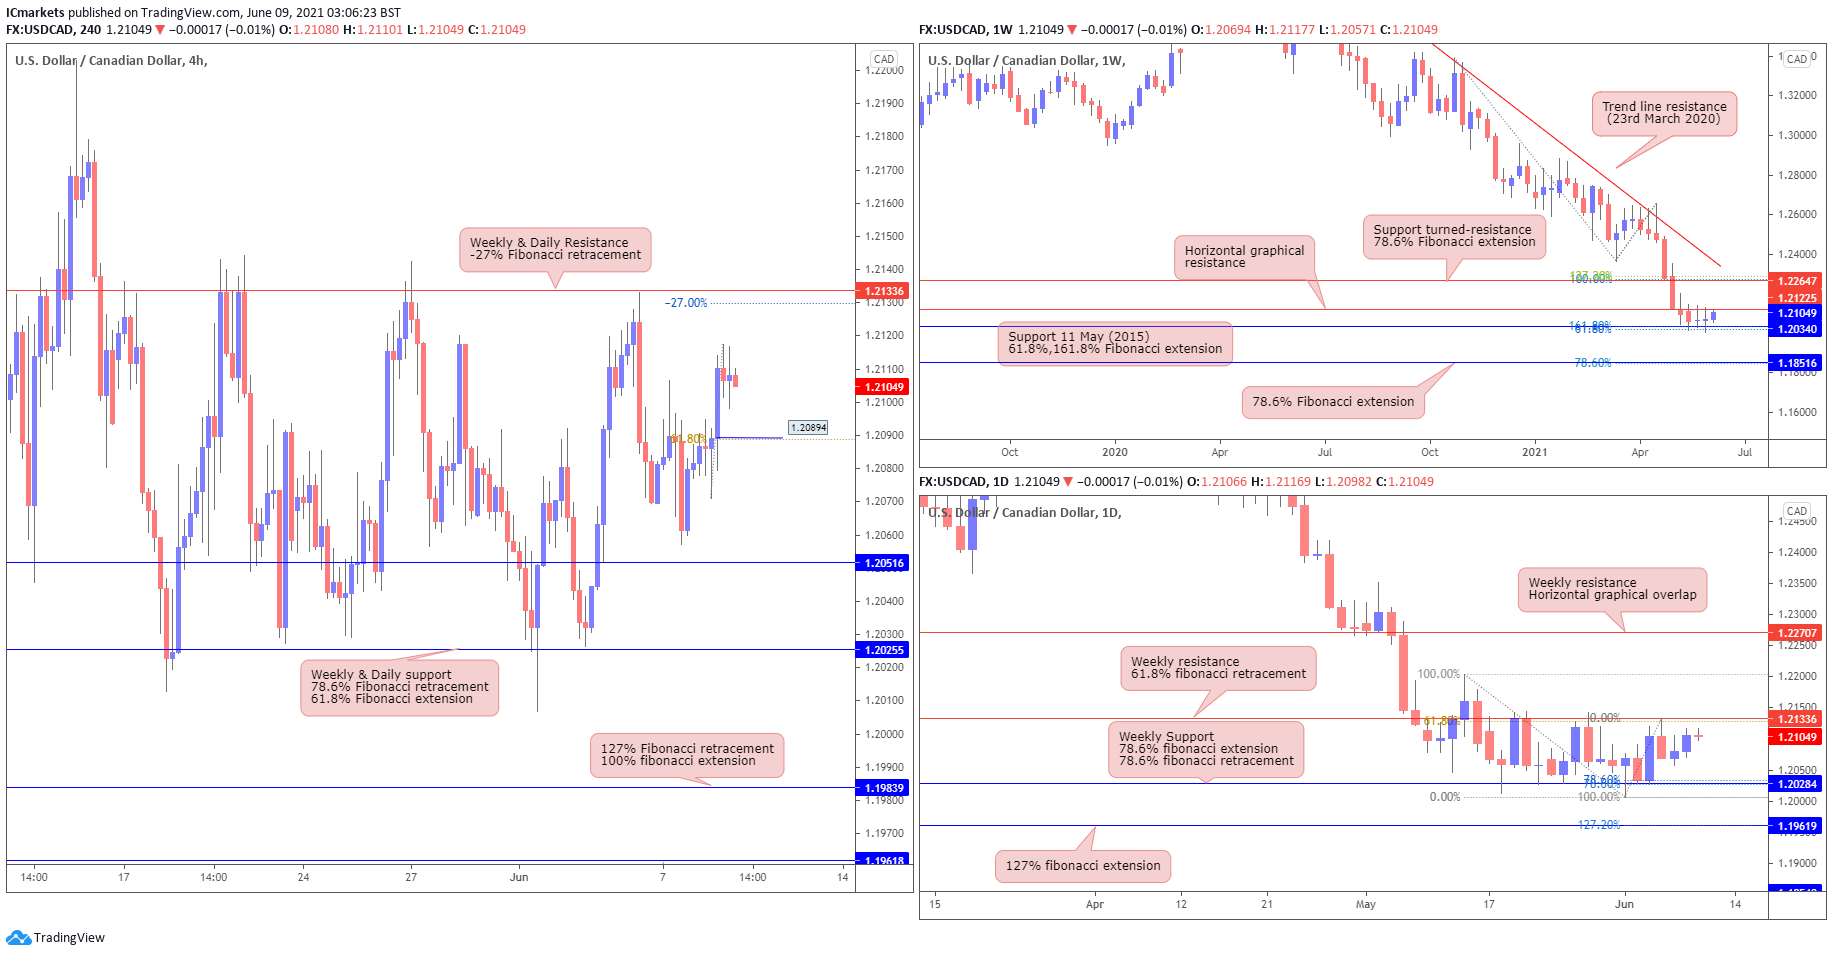
USD/CAD:
From the Weekly timeframe, we see price trending between the previous swing high in line with 78.6% fibonacci retracement, and the ascending trendline, it is currently testing the support level from 11th May (2015), in line with 61.8%, 161.8% fibonacci extension. From the daily timeframe, we see that price bounced from the recent support level 1.20284 in line with Weekly Support, 78.6% fibonacci extension, 78.6% fibonacci retracement, where price is currently consolidating between this level and 1.21336, in line with 61.8% fibonacci retracement and previous swing high.
The H4 timeframe we may expect a pullback down towards the 1.20894, in line with 61.8% fibonacci retracement level, before bouncing higher towards the 1.21336, in line with -27% fibonacci retracement and Weekly and Daily resistance level.
Areas of consideration:
- The weekly and daily time frame shows a weakening of this bearish momentum.
- On H4, price may bounce from 1.20894 towards 1.21336.
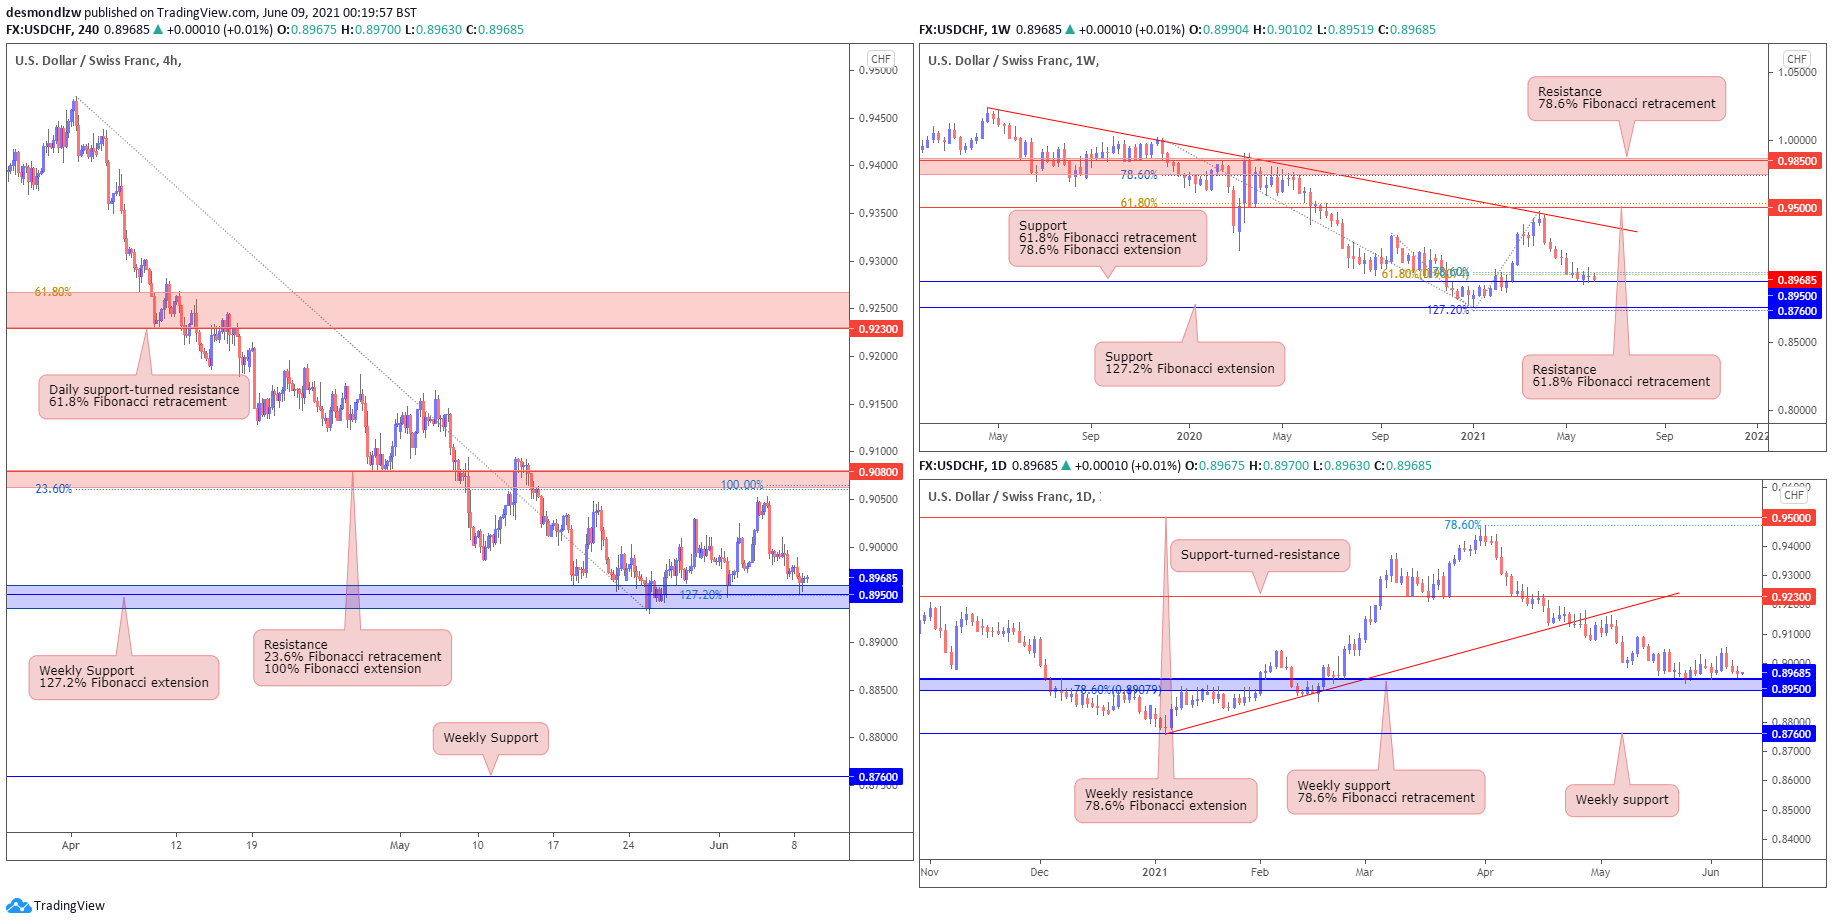
USD/CHF:
USD/CHF is now testing the weekly 0.89500 support, in line with 61.8% Fibonacci retracement and 78.6% Fibonacci extension. The daily chart shows that price is now holding below the key daily 0.92300 support-turned-resistance, and has also broken below the ascending trendline support-turned-resistance. The weekly 0.89500 support level is a key level to watch.
On the H4 chart, we can see that price is now re-testing the key weekly 0.89500 support level, in line with 127.20% Fibonacci extension, after reversing under the 0.90800 resistance. Price appears to be making a sideways movement within the range of the market over the past few days. In this scenario, the 0.89500 support area will be an important level to watch. A break and close below this level could see price swing towards the next support level at 0.87600, in line with our weekly support level.
Areas of consideration:
- The 0.89500 weekly support is a key intraday level to watch.
- Price is making a sideways movement within the range in the market and is re-testing the 0.89500 support.
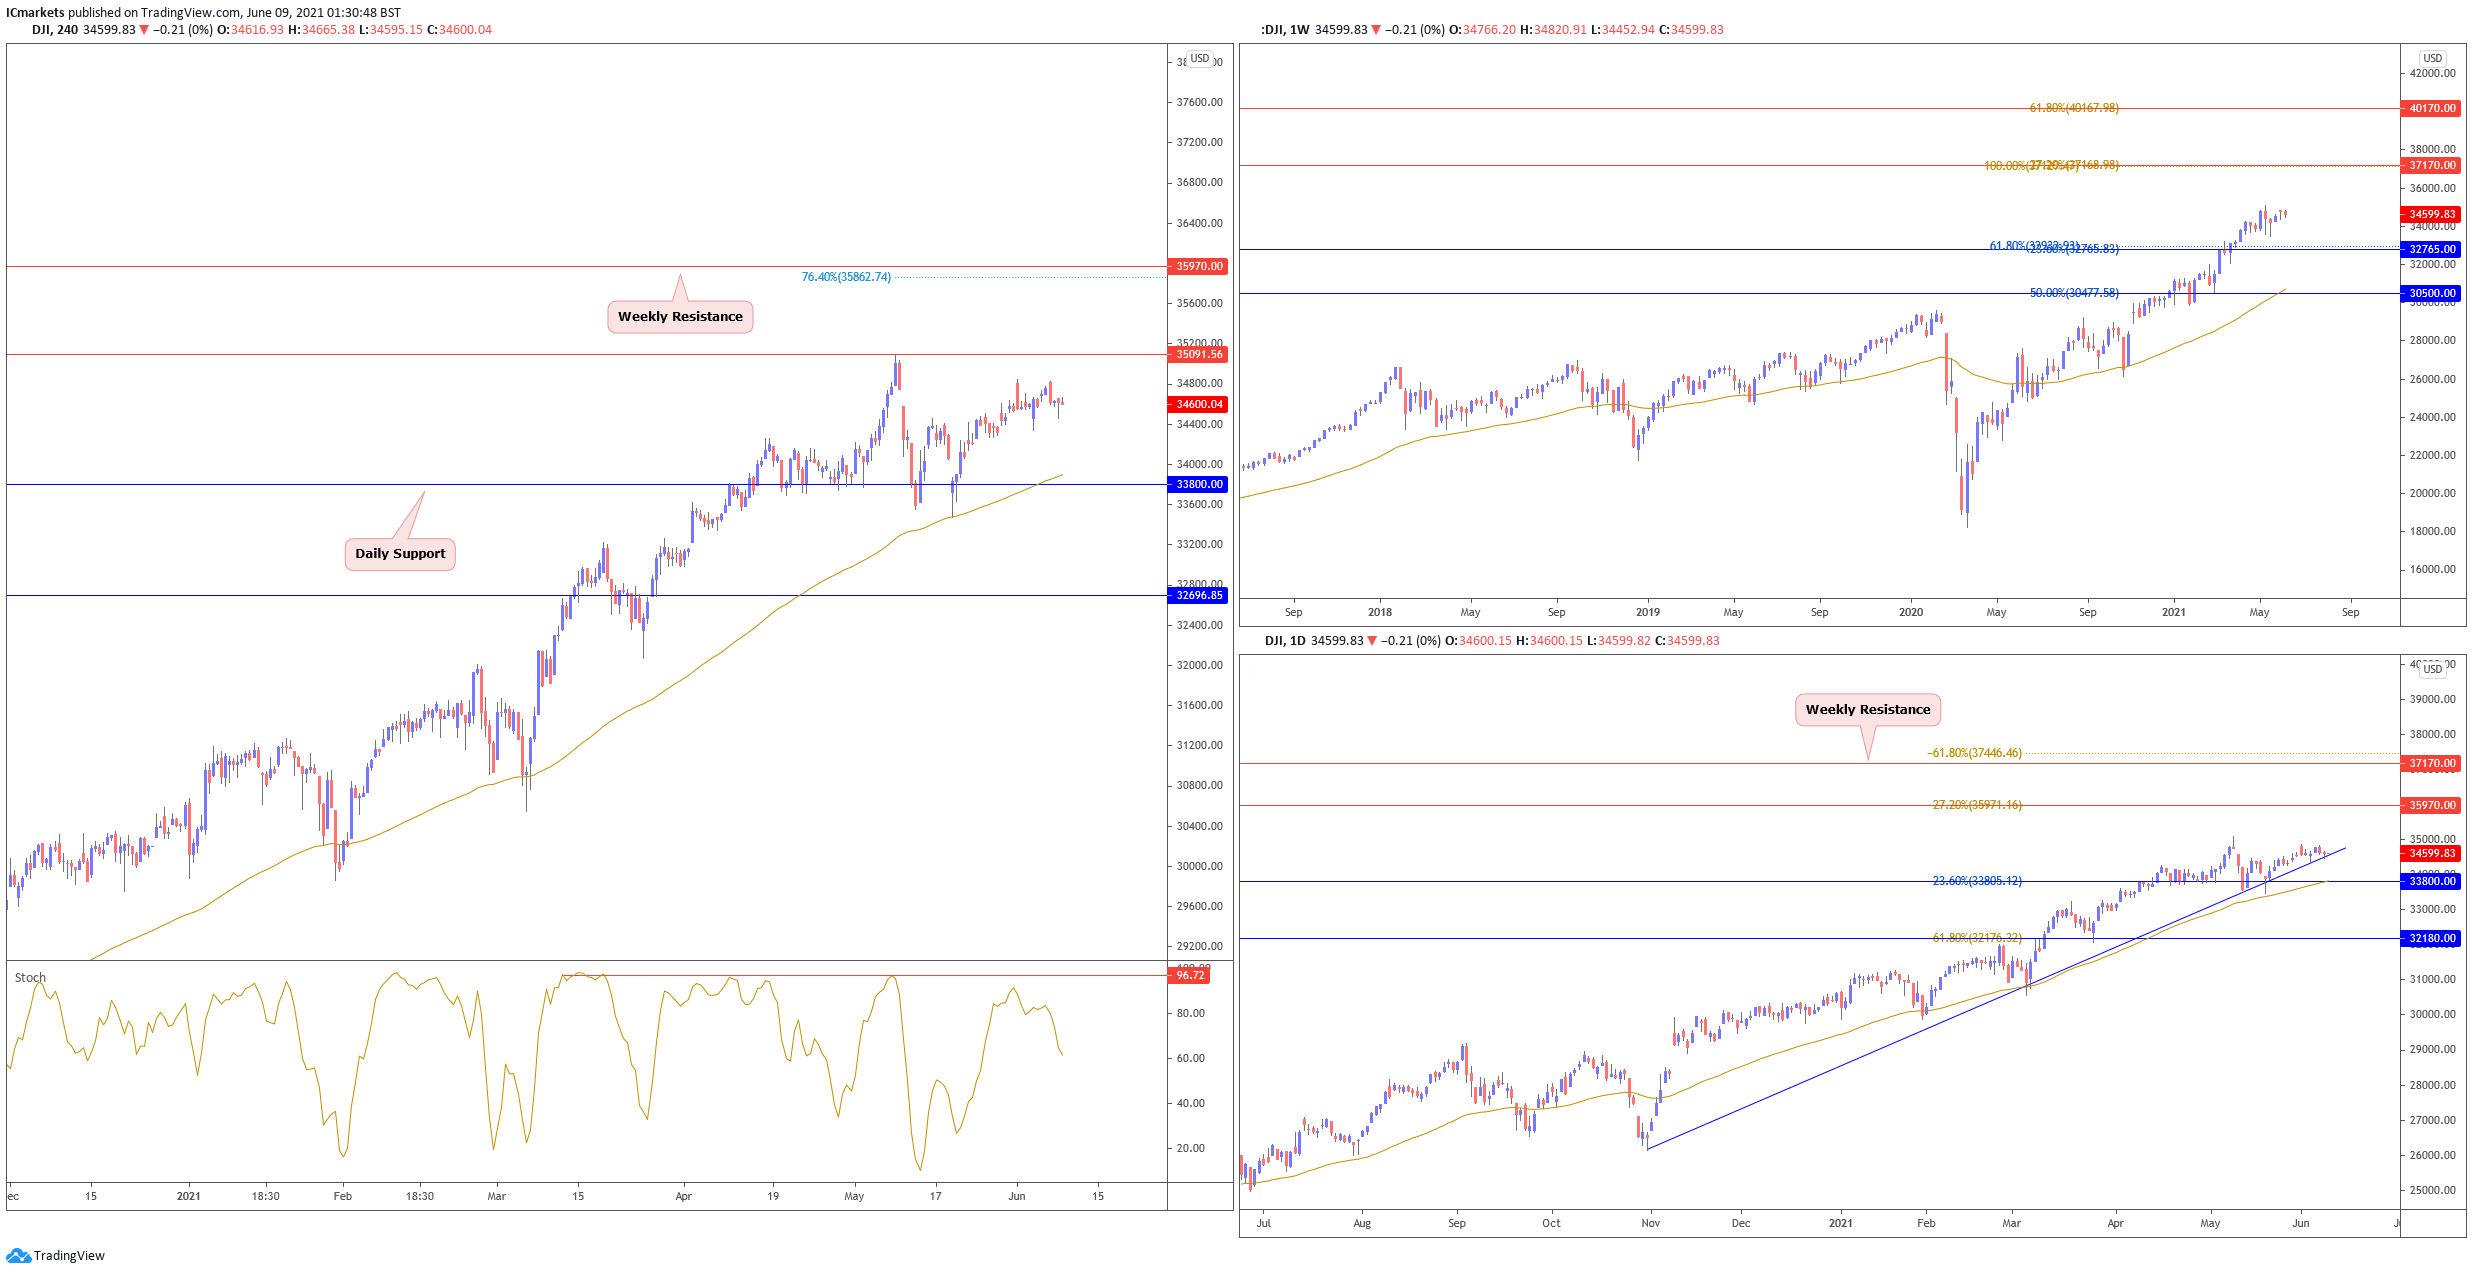
Dow Jones Industrial Average:
On the weekly chart, price is trading sideways. With price holding above the long term moving average, we can expect further bullish pressure above 32765 support. On the daily chart, price is also trading within a broad range but still holding above moving average and ascending trendline support. Buyers may look to add their longs to push price higher towards possible target at 35970 resistance.
On the H4, price traded sideways and is still holding below 35091 resistance. We could possibly see sellers enter with their shorts to play a short term drop towards 33800 support. Otherwise, failure to hold below 35091 resistance will see price push higher towards 35970 resistance next. Stochastic is testing resistance where price showed a pull back in the past. We are leaning more towards a short term pullback as well.
Areas of consideration:
- Watch resistance at 35091 on H4 closely
- Stochastics reacting below resistance on H4
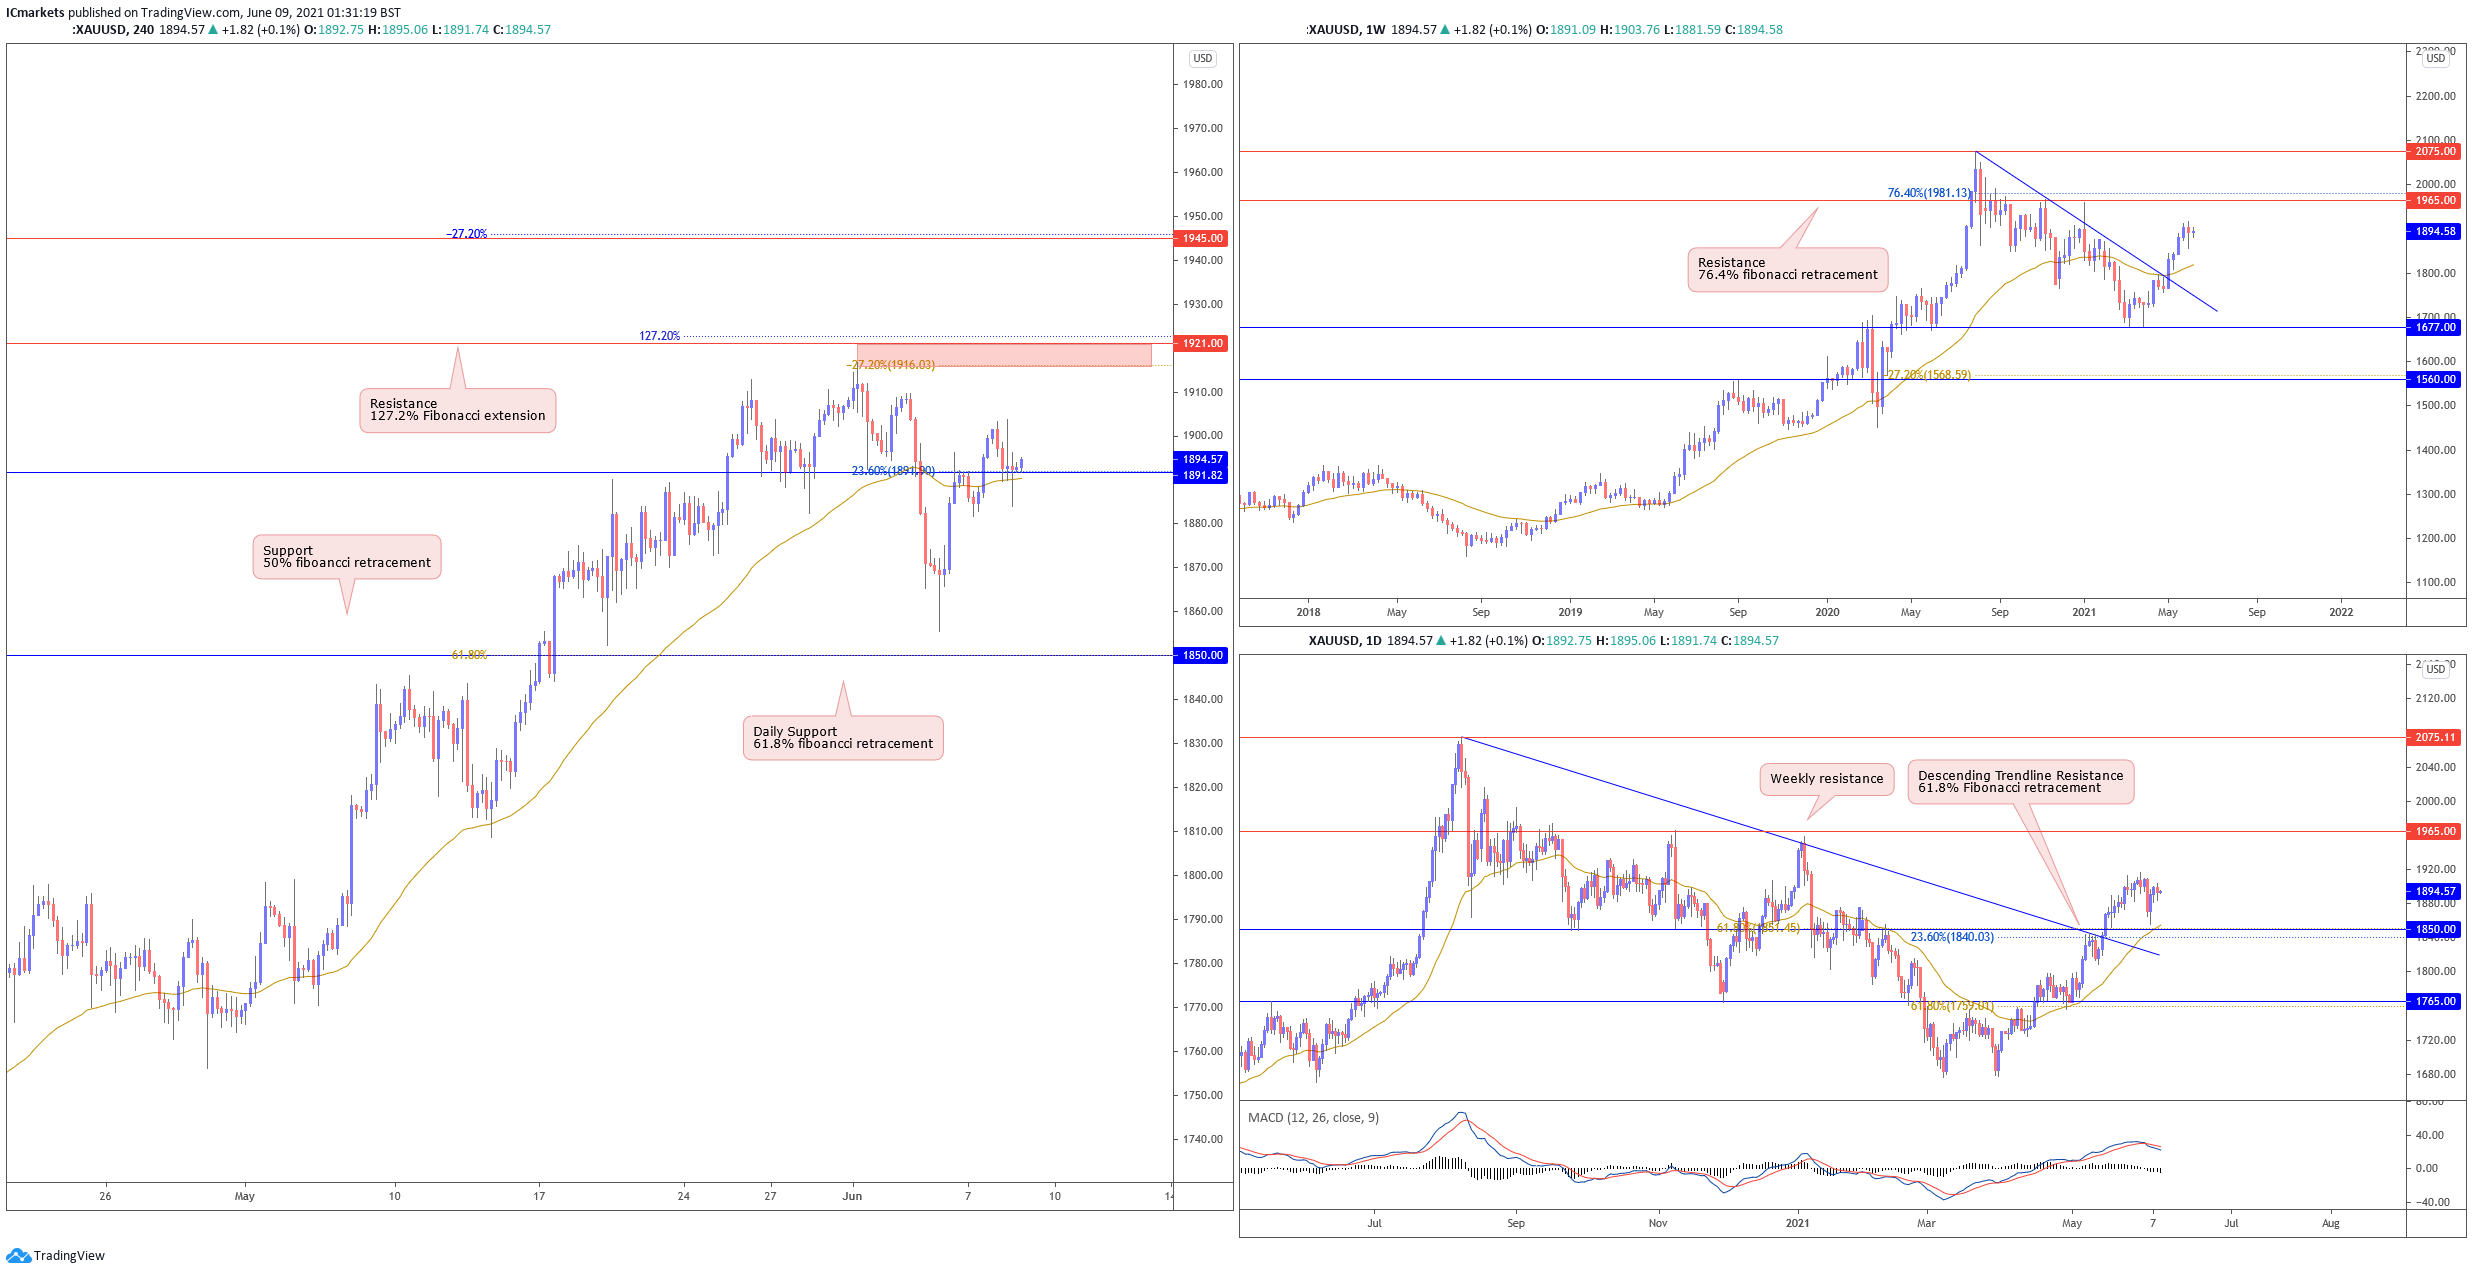
XAU/USD (GOLD):
On the weekly timeframe, prices are facing bullish pressure and could still see further upside, with 1965 as the weekly resistance target. We could see renewed bullish pressure this coming week. On the daily price bounced above 1850 support. With technical indicators showing room for further bullish momentum, we could see buyers looking to add to their longs and push price towards 1965 resistance.
On the H4, price dipped lower and is currently testing 1891 support. With price holding above moving average, we see renewed bullish pressure above 1891 support. Traders may look to add to their longs above this support with a possible upside target at 1921. Otherwise, failure to hold above 1891 will see price swing the other way and drop towards daily support at 1850.
Areas of consideration:
- 1891 support to watch on H4 timeframe
The accuracy, completeness and timeliness of the information contained on this site cannot be guaranteed. IC Markets does not warranty, guarantee or make any representations, or assume any liability regarding financial results based on the use of the information in the site.
News, views, opinions, recommendations and other information obtained from sources outside of www.icmarkets.com.au, used in this site are believed to be reliable, but we cannot guarantee their accuracy or completeness. All such information is subject to change at any time without notice. IC Markets assumes no responsibility for the content of any linked site.
The fact that such links may exist does not indicate approval or endorsement of any material contained on any linked site. IC Markets is not liable for any harm caused by the transmission, through accessing the services or information on this site, of a computer virus, or other computer code or programming device that might be used to access, delete, damage, disable, disrupt or otherwise impede in any manner, the operation of the site or of any user’s software, hardware, data or property.


