
Waiting for lower timeframe confirmation is our main tool to confirm strength within higher timeframe zones, and has really been the key to our trading success. It takes a little time to understand the subtle nuances, however, as each trade is never the same, but once you master the rhythm so to speak, you will be saved from countless unnecessary losing trades. The following is a list of what we look for:
- A break/retest of supply or demand dependent on which way you’re trading.
- A trendline break/retest.
- Buying/selling tails/wicks – essentially we look for a cluster of very obvious spikes off of lower timeframe support and resistance levels within the higher timeframe zone.
We typically search for lower-timeframe confirmation between the M15 and H1 timeframes, since most of our higher-timeframe areas begin with the H4. Stops are usually placed 1-3 pips beyond confirming structures.
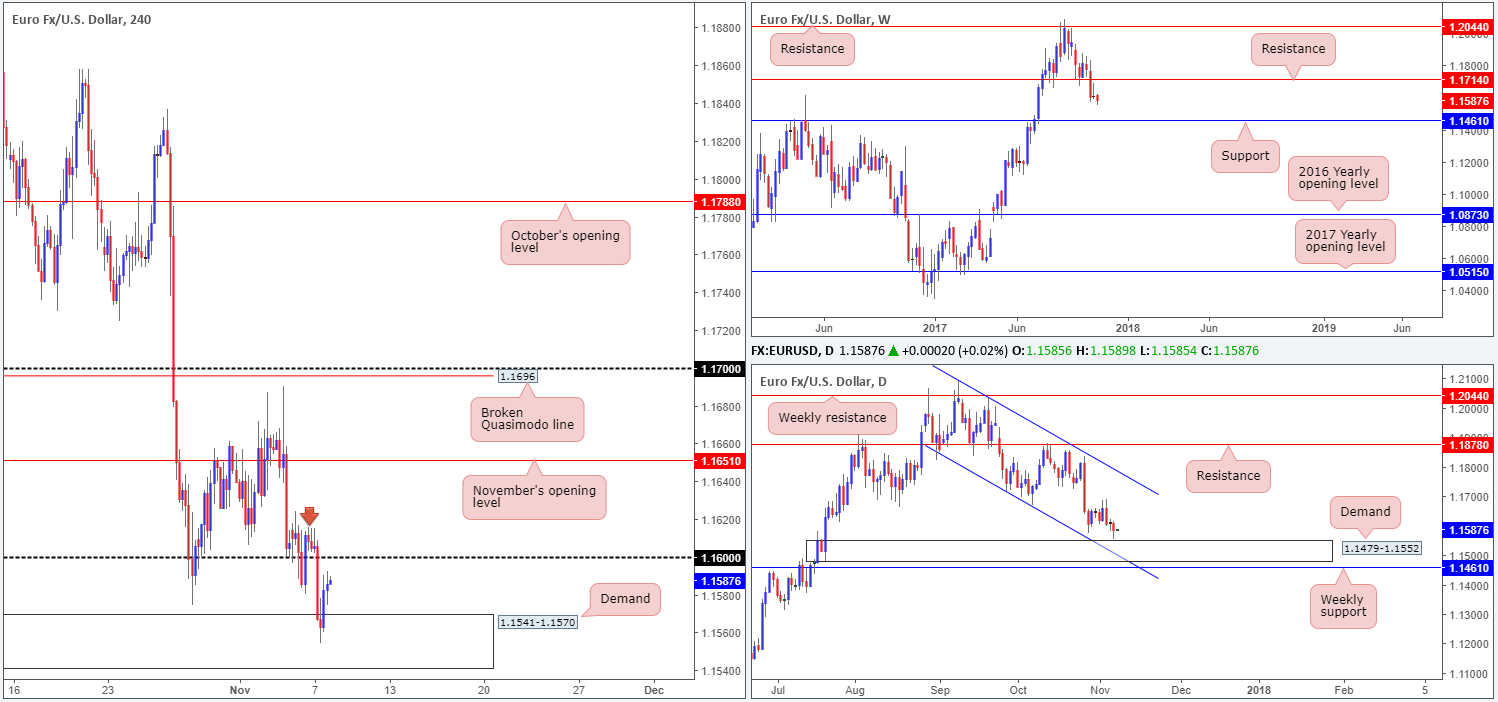
EUR/USD:
For those who read Tuesday’s report you may recall that we were looking for price to outmuscle the 1.16 handle and tackle the nearby H4 demand base at 1.1541-1.1570. In early London hours on Tuesday, as you can see, 1.16 was engulfed and the noted H4 demand was confronted. The central motive behind selecting this base as a potential buy zone was simply down to the area being positioned on top of a daily demand area seen at 1.1479-1.1552.
Suggestions: As of writing, we are long this market from 1.1567, with a stop-loss order located just below the aforesaid H4 demand area at 1.1540. Our first take-profit target, also highlighted in Tuesday’s analysis, is the 1.16 handle. Here we’ll look to reduce risk to breakeven and bank some profits.
Ultimately, a break above 1.16, as well as the nearby H4 supply marked with a red arrow at 1.1616-1.1603, is what we’re looking for going forward, since November’s opening level at 1.1651 is the next take-profit line.
Data points to consider: No high-impacting events on the docket today.
Levels to watch/live orders:
- Buys: 1.1567 ([live] stop loss: 1.1540).
- Sells: Flat (stop loss: N/A).
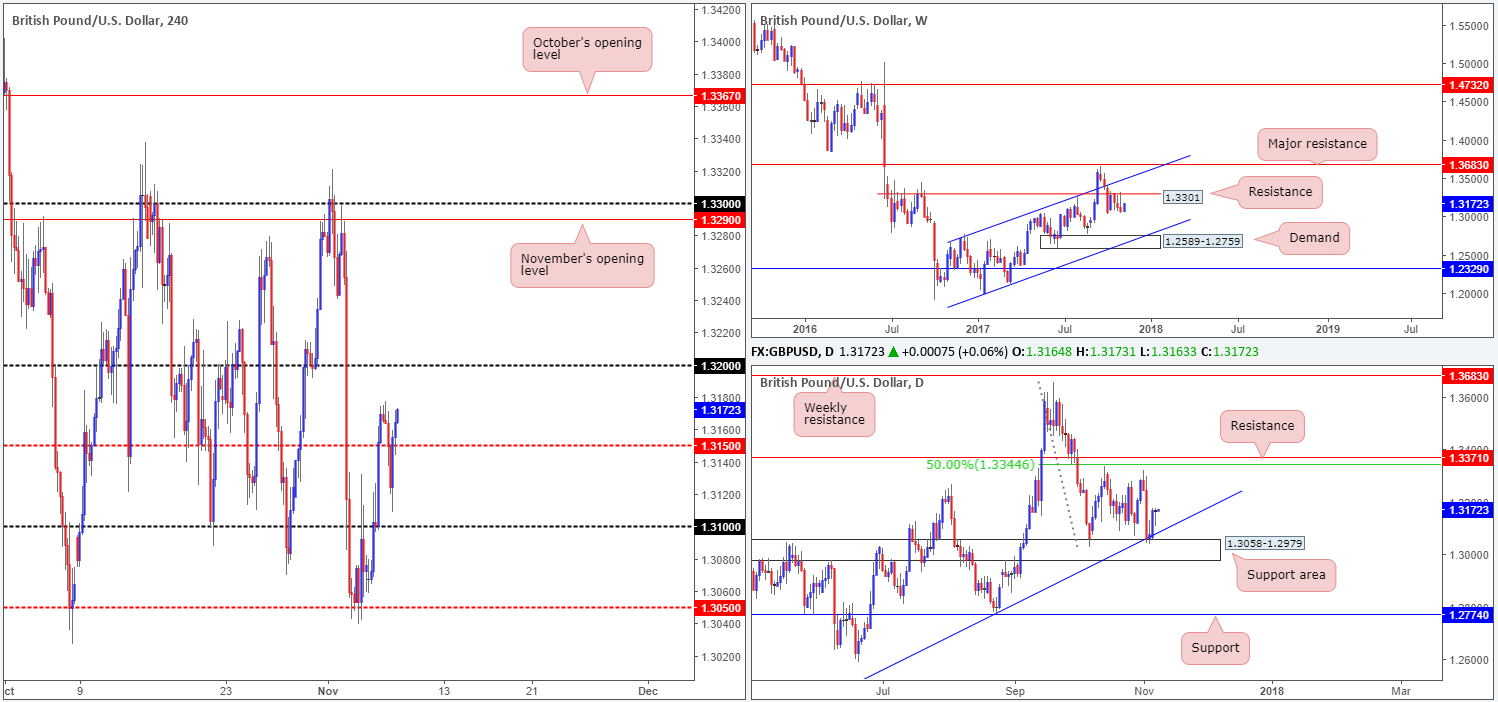
GBP/USD:
The British pound managed to hold its bullish tone on Tuesday, despite dipping below the mid-level support 1.3150. Ultimately though, the GBP/USD is effectively unchanged this morning. For this reason, much of the following report will echo similar opinions put forward in Tuesday’s analysis.
The daily support area at 1.3058-1.2979 (fuses nicely with a trendline support etched from the low 1.2108) provided the market with a much-needed floor On Monday. Be that as it may, this move does come at a time when weekly price is showing bearish intent beneath weekly resistance plotted at 1.3301.
Suggestions: While daily price printed a healthy near-full-bodied bullish candle at the beginning of the week, upside is somewhat tarnished by the pair’s position on the weekly timeframe, and therefore remains a risky market to trade, in our opinion. In addition to this, we still do not see any technical confluence to pull the trigger on the H4 timeframe, leaving us little choice but to remain on the sidelines for the time being.
Data points to consider: No high-impacting events on the docket today.
Levels to watch/live orders:
- Buys: Flat (stop loss: N/A).
- Sells: Flat (stop loss: N/A).
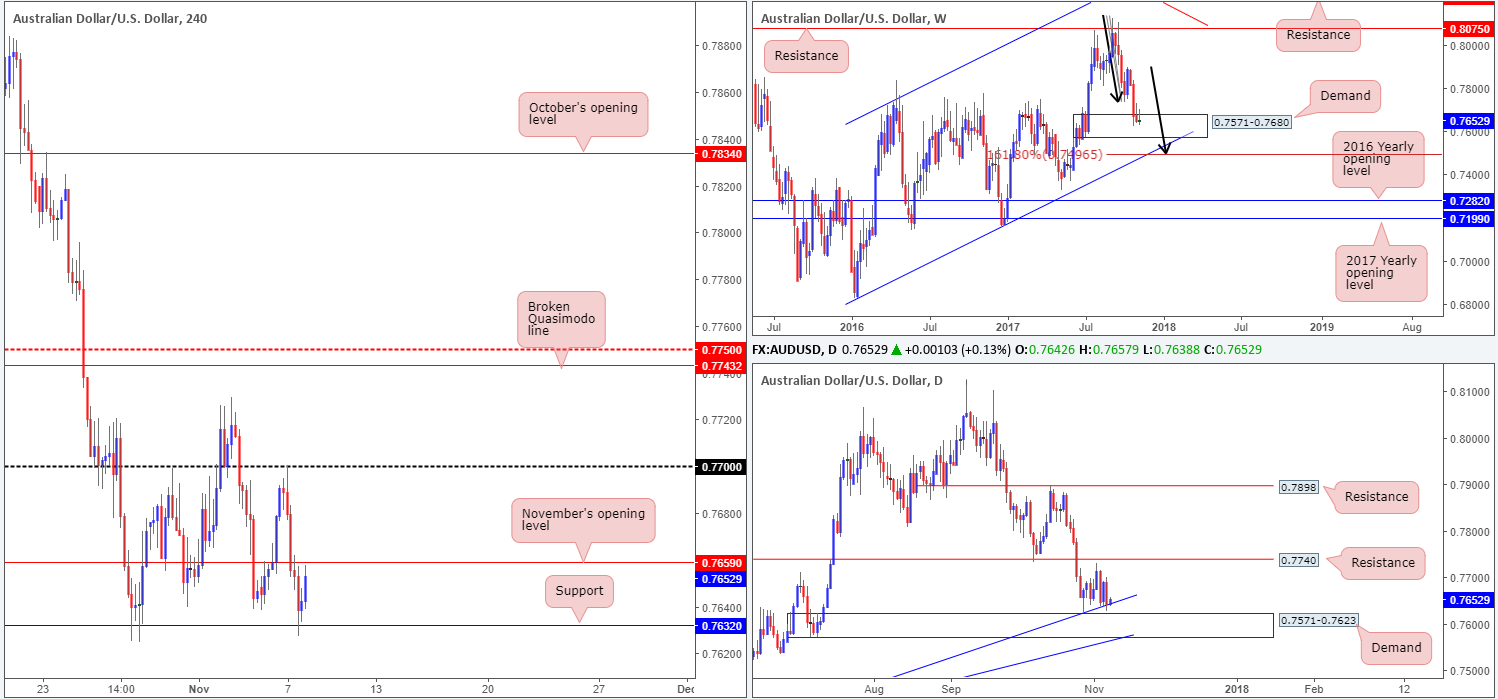
AUD/USD:
The AUD/USD pierced the underside of the 0.77 handle on Tuesday following the RBA’s decision to leave interest rates unchanged. The pair, as you can see, spent the remainder of the Asian session, and most of London’s segment, tumbling lower. November’s opening level at 0.7659 was taken out and the H4 support barrier at 0.7632 was brought into the fray, which held firm going into Tuesday’s US session.
Buyers and sellers on the weekly timeframe remain battling for position within the walls of a demand area coming in at 0.7571-0.7680. In conjunction with the weekly timeframe, there’s a daily demand area plotted at 0.7571-0.7623 (seen housed within the lower limits of the current weekly demand) that converges with a daily trendline support drawn from the low 0.7328.
Suggestions: With higher-timeframe bulls likely to come into the picture, we have our eye on intraday longs above 0.7659 today. A decisive H4 close beyond this number, followed up with a retest as support and a lower-timeframe buy signal (see the top of this report) is, in our book, enough to warrant an intraday play up to at least 0.77.
Data points to consider: Chinese trade balance at 2am GMT.
Levels to watch/live orders:
- Buys: Watch for H4 price to engulf 0.7659 and then look to trade any retest of this level seen thereafter ([waiting for a lower-timeframe buy signal to form following the retest is advised] stop loss: dependent on where one confirms this level).
- Sells: Flat (stop loss: N/A).
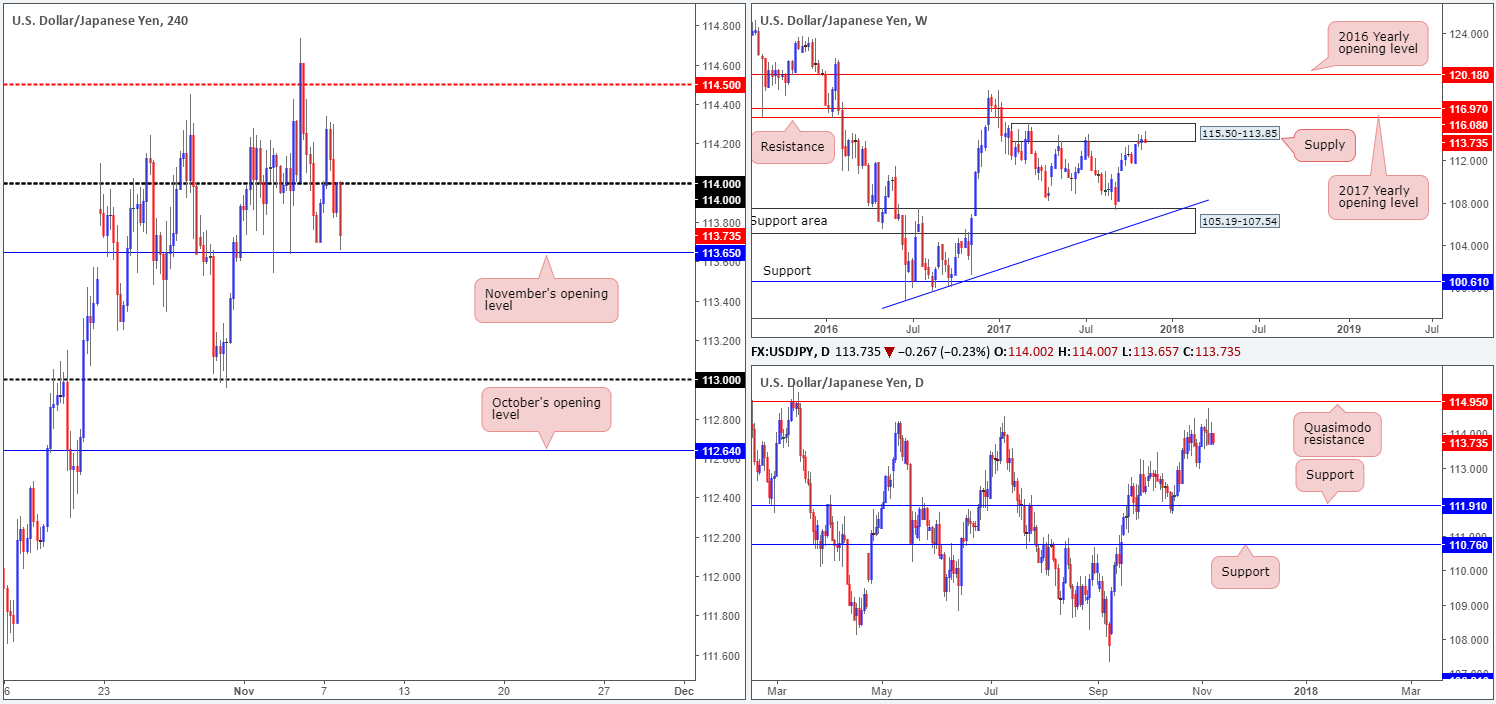
USD/JPY:
During the course of yesterday’s sessions, the H4 candles broke through 114 and clocked a high of 114.33. Unable to extend these gains and leaving the mid-level resistance 114.50 unchallenged, the pair descended lower and reclaimed the 114 hurdle. In recent hours, however, we’ve seen 114 used as resistance to propel the market down to just ahead of November’s opening level at 113.65.
Technically speaking, this recent move lower should not have come as too much of a surprise. Weekly action is seen lurking around the lower limits of a supply zone penciled in at 115.50-113.85, while daily price was seen within striking distance of a Quasimodo resistance level at 114.95.
Suggestions: In view of the bigger picture, the desk is going to be looking for shorts sub 113.65 today. A decisive H4 close below November’s opening level, alongside a retest and a reasonably sized H4 bearish candle (preferably a full or near-full-bodied candle) is, in our opinion, enough to warrant a sell, targeting at least the 113 handle.
Data points to consider: No high-impacting events on the docket today.
Levels to watch/live orders:
- Buys: Flat (stop loss: N/A).
- Sells: Watch for H4 price to engulf 113.65 and then look to trade any retest of this level seen thereafter ([waiting for a H4 bearish candle to form following the retest – preferably a full or near-full-bodied candle – is advised] stop loss: ideally beyond the candle’s wick).
USD/CAD:
After coming within a few inches of testing the 1.27 handle on Monday, the USD/CAD changed course on Tuesday and violently whipsawed through the 1.28 handle. Also in play right now is weekly resistance plotted at 1.2778. Should this weekly level hold ground, we could see daily price shake hands with a trendline support extended from the low 1.2061.
A sell from 1.28, in our view, was high probability. This is largely due to the weekly resistance level currently in motion. Despite this, it seems we may have missed the train on this one!
Suggestions: In the event that H4 price retests the underside of 1.28, a short from here is valid if a full or near-full-bodied bearish candle takes shape. This would, in our opinion, be an ideal signal to short down to 1.27, and possibly beyond.
Data points to consider: Canadian building permits m/m at 1.30pm; Crude oil inventories at 3.30pm GMT.
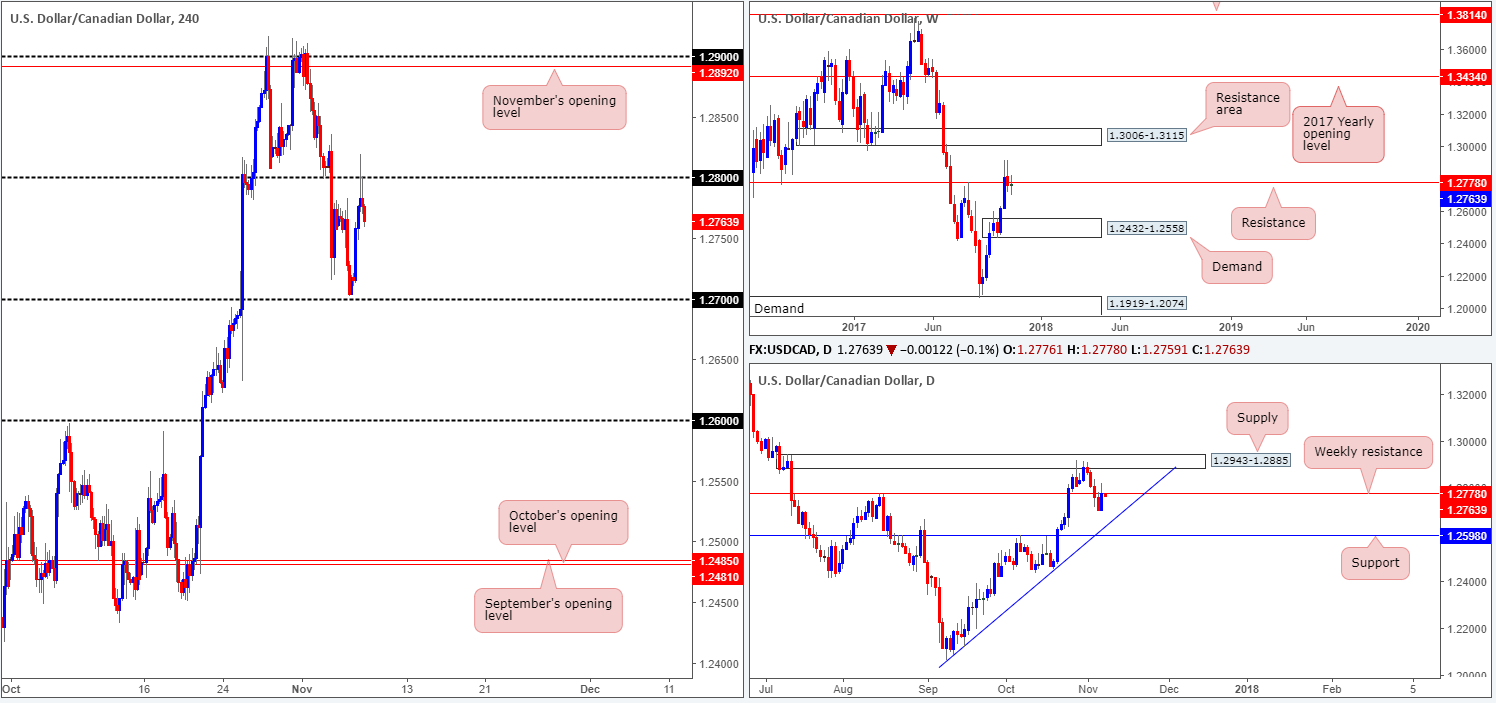
Levels to watch/live orders:
- Buys: Flat (stop loss: N/A).
- Sells: 1.28 region ([waiting for a H4 bearish candle to form – preferably a full or near-full-bodied candle – is advised] stop loss: ideally beyond the candle’s wick).
USD/CHF:
It was a quiet day in the USD/CHF market on Tuesday, as the H4 candles spent the sessions seesawing around parity (1.0000). Given this somewhat lackluster performance, much of the following report will be similar to yesterday’s outlook.
Below parity, the next downside target on the radar is a H4 support penciled in at 0.9940, followed by the 0.99 handle. On the weekly timeframe, we can see that price remains beneath the 2016 yearly opening level at 1.0029, with the next support not coming into view until we reach support at 0.9770. Down on the daily timeframe, the next area of concern is seen a little closer at 0.9896: another support.
Suggestions: Watch for H4 price to print a full or near-full-bodied bearish candle around the underside of parity. Should one manage to secure a sell position from here, the first take-profit target, at least for us, would be 0.9940, and then 0.99. However, seeing as we’re already long the EUR/USD, a sell here would be considered as doubling up on risk given the inverse correlation between the two markets.
Data points to consider: No high-impacting events on the docket today.
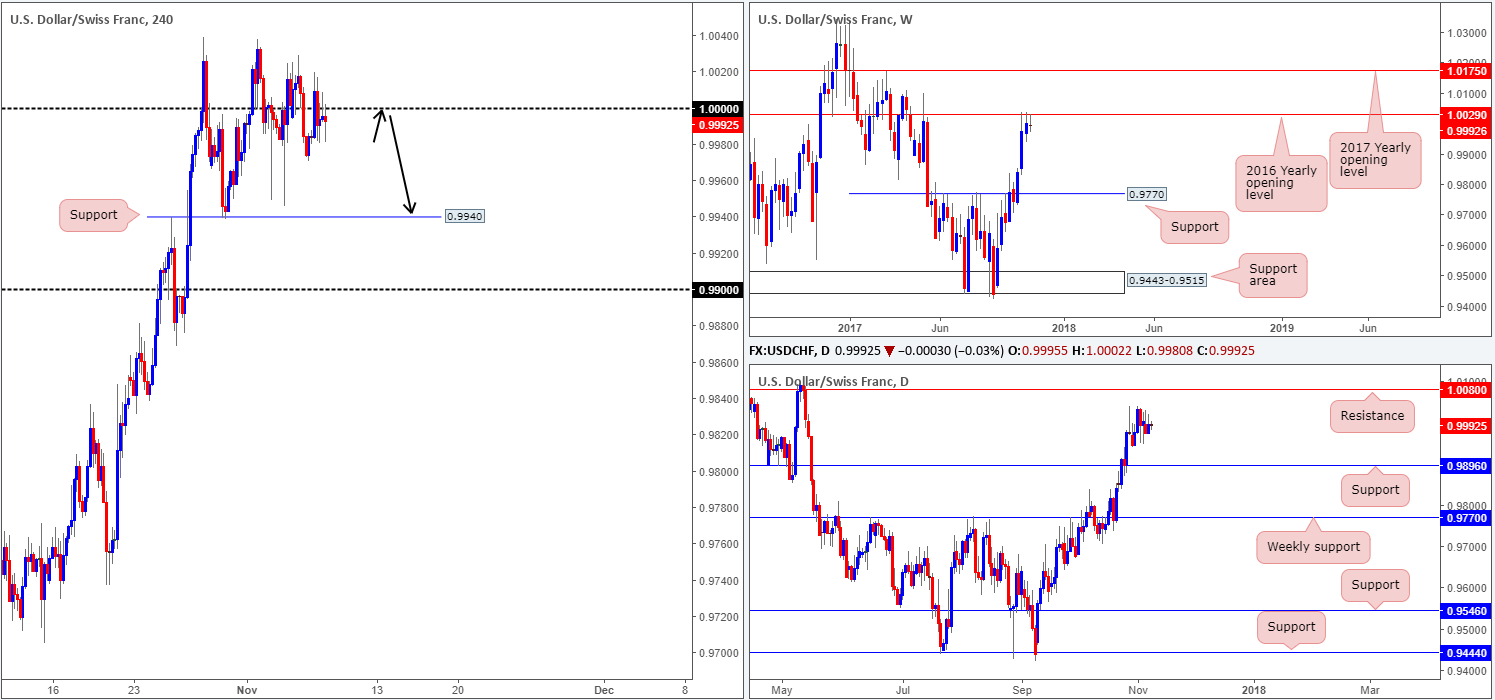
Levels to watch/live orders:
- Buys: Flat (stop loss: N/A).
- Sells: 1.0000 region ([waiting for a reasonably sized H4 bearish candle to form – preferably a full or near-full-bodied candle – is advised] stop loss: ideally beyond the candle’s wick).
DOW 30:
After tapping a fresh record high of 23622 on Tuesday, US equities took a turn for the worse and plunged lower. On account of this, we’re now eyeing the point at where November’s opening level at 23392 and the H4 channel support etched from the low 23250 merge (green box) for a possible long trade. In addition to this confluence, we also see that the monthly opening level is sited within a daily demand base located at 23321-23403. This – coupled with the monstrous uptrend this market is in right now makes for a worthy buy zone, in our humble view.
Suggestions: Put simply, should the index shake hands with the 23392 neighborhood; a long from here is certainly worthy of consideration, as stops can be positioned below the noted daily demand at 23319.
Data points to consider: No high-impacting events on the docket today.
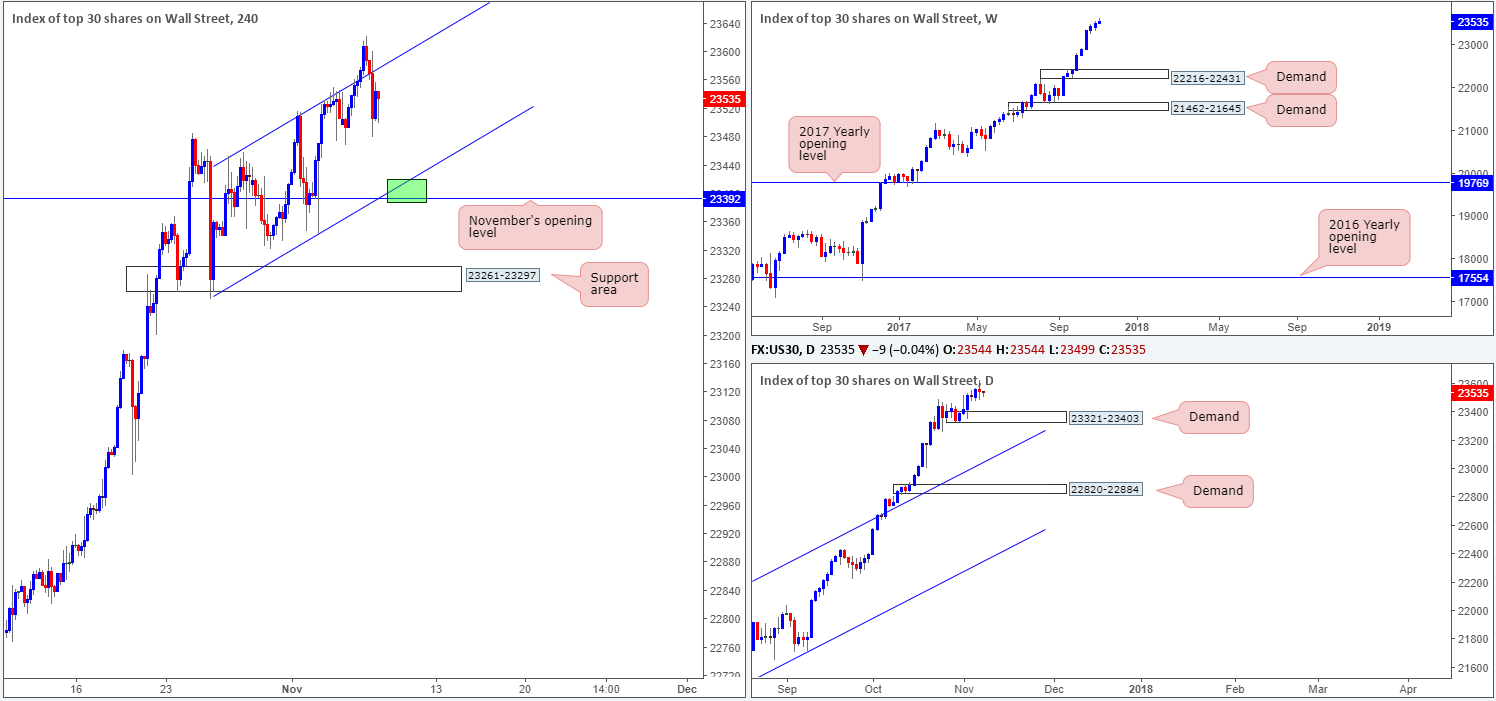
Levels to watch/live orders:
- Buys: 23392 region (stop loss: 23319).
- Sells: Flat (stop loss: N/A).
GOLD:
Since the 26th October, the gold market has been trading within a phase of consolidation between 1282.5/1265.4. Inside this zone, we have three monthly opening levels: August (1269.3), November (1269.9) and October’s opening level at 1279.1. Also of interest is the fact that this H4 range is bolstered by both a weekly demand at 1251.7-1269.3, and a smaller demand base seen housed within the lower limits of the weekly zone on the daily timeframe at 1251.7-1265.2.
Suggestions: Right now the only area of interest is a long from the lower edge of the current H4 range. However, we would want to see H4 price print a close back above Aug/Sep opening levels to confirm buyer intent. This way, we could comfortably hold the position and target the upper edge of the H4 range at 1282.5.
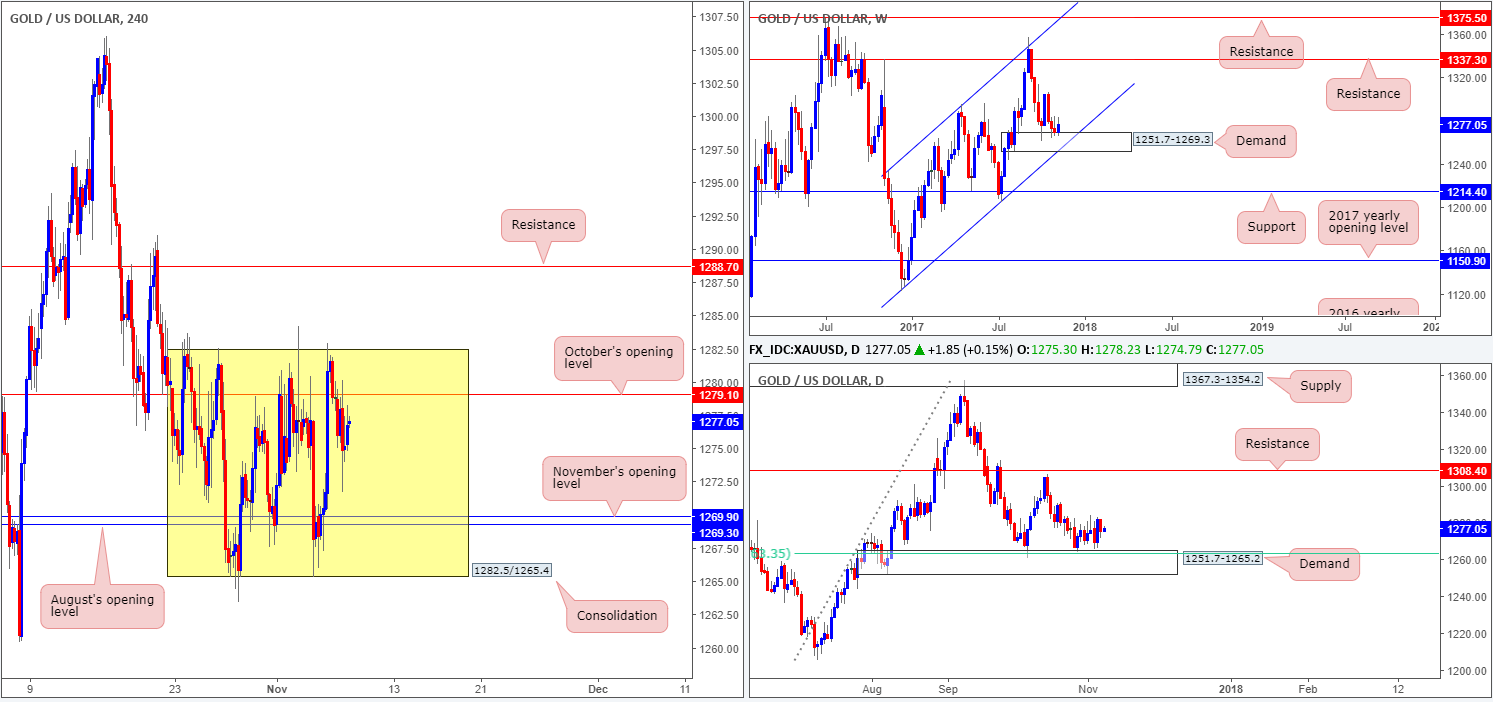
Levels to watch/live orders:
- Buys: 1265.4 region ([waiting for a H4 close back above 1269.9/1269.3 would help prove buyer intent] stop loss: either below the breakout candle’s tail or below the aforementioned H4 range edge).
- Sells: Flat (stop loss: N/A).


