
Key risk events today:
US ADP Non-Farm Employment Change; BOE Gov Bailey Speaks; FOMC Meeting Minutes.
(Previous analysis as well as outside sources – italics).
EUR/USD:
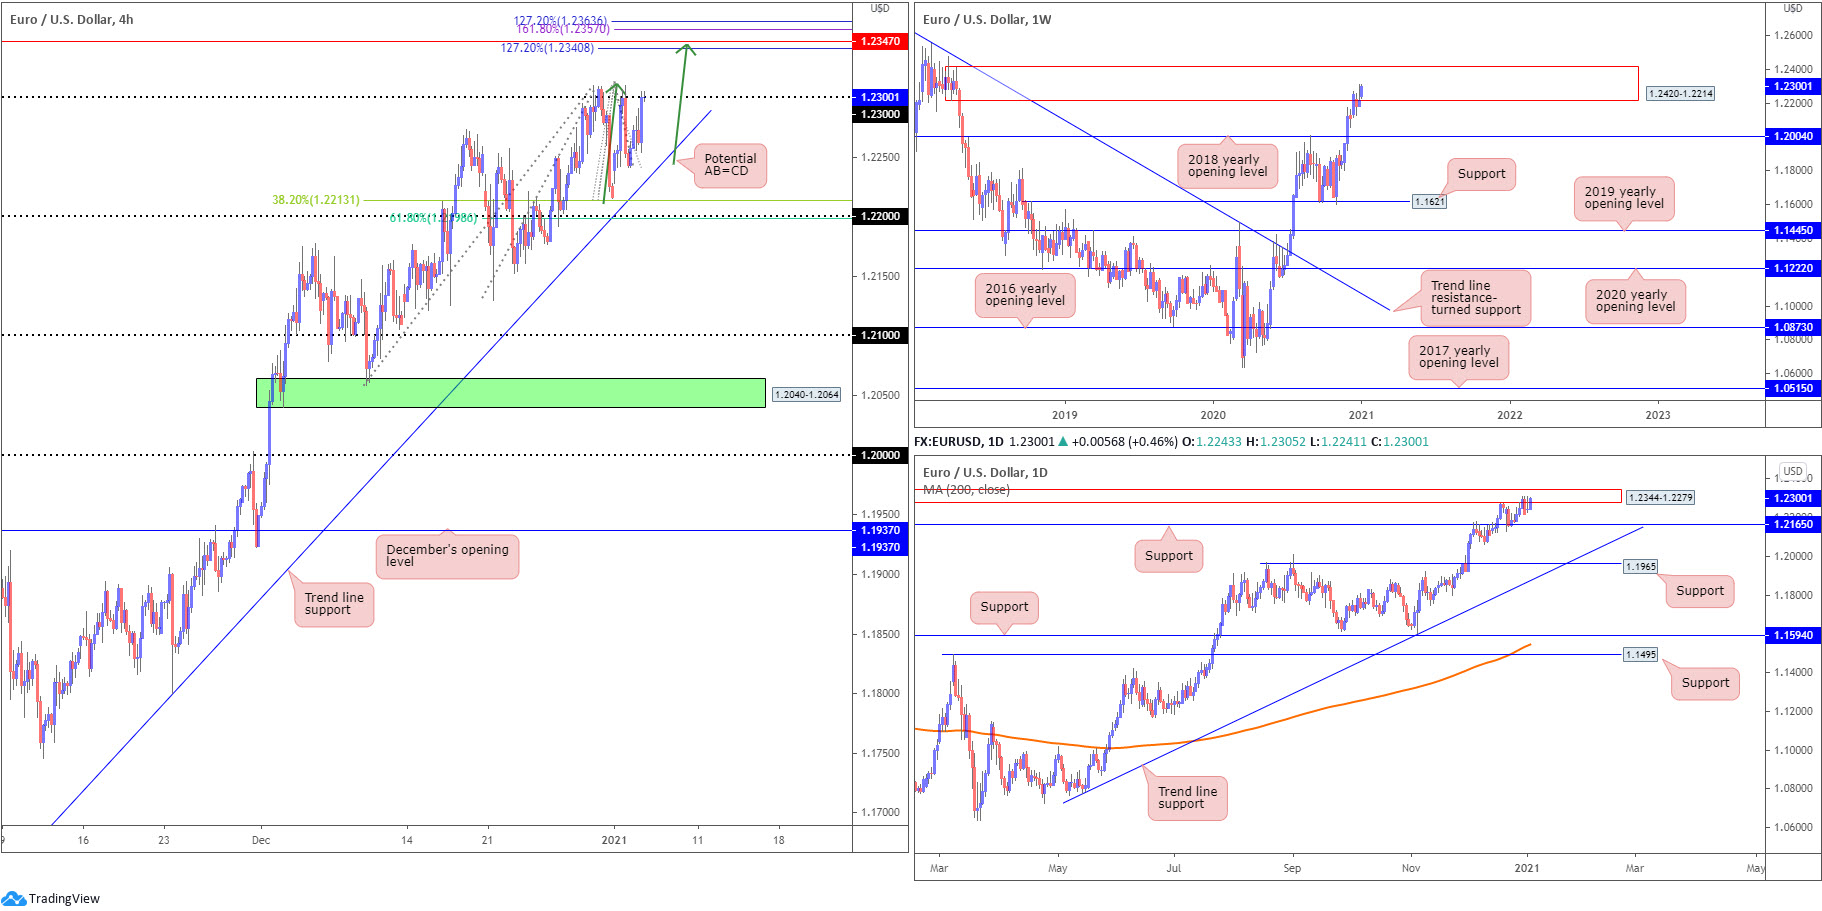
Renewed USD downside (US dollar index < 98.50) provided fresh impetus to EUR/USD Tuesday, with H4 climbing 1.23. Clearing offers around the aforementioned round number swings the pendulum in favour of further gains towards resistance at 1.2347, a level supported by a potential AB=CD pattern (green arrows) and a number of key Fibonacci levels (1.2363/1.2340). H4 downside levels to be aware of are trend line support, taken from the low 1.1602. Also close by are the 38.2% and 61.8% Fibonacci retracement ratios at 1.2213 and 1.2198, respectively, as well as the 1.22 figure.
Meanwhile, on the weekly timeframe, buyers and sellers remain battling for position within supply at 1.2420-1.2214. Should sellers eventually take the reins, the 2018 yearly opening value at 1.2004 is likely a level downside movement may target. In terms of trend, however, upside remains favoured (the pair has been trending higher since late March) – more so if price overthrows the 1.2555 February 12 high (2018).
Against the backdrop of weekly flow, daily supply can be seen at 1.2344-1.2279 (nestled within the walls of weekly supply mentioned above at 1.2420-1.2214). 1.2344-1.2279 was a key zone in the later stages of December, and remains a respected base in early January. Support at 1.2165 is also in sight; a break lower exposes another layer of support at 1.1965 and a merging trend line support, extended from the low 1.0774.
Areas of consideration:
- H4 closing above 1.23 could unleash breakout buying, targeting H4 resistance at 1.2347 (and surrounding Fibonacci levels).
- Should 1.23 give way, this also implies the current uptrend is gaining momentum which is potentially bad news for any sellers out of weekly supply at 2420-1.2214 and daily supply drawn from 1.2344-1.2279.
GBP/USD:
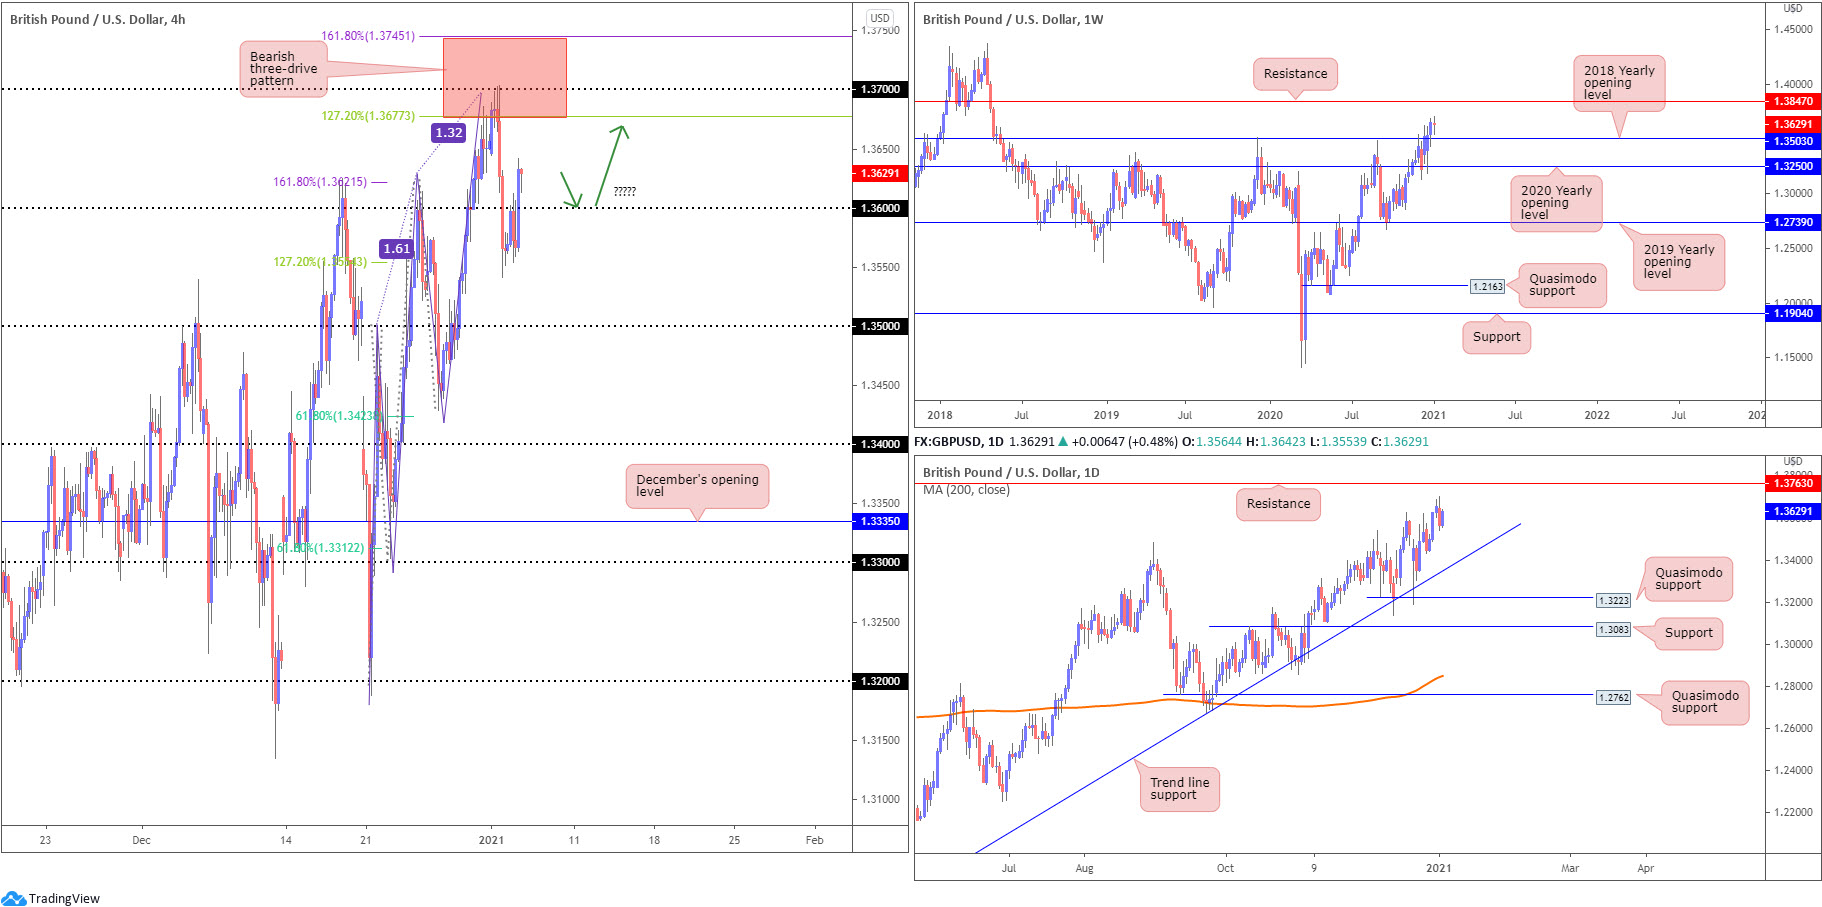
Sterling discovered fresh bids around 1.3550 against a broadly softer US dollar Tuesday – enough to lift GBP/USD back above 1.36. Despite this, we remain south of the 31-month high clocked on Monday at 1.37. As a reminder, 1.37 is surrounded by a three-drive bearish formation, with a termination zone seen between the 161.8%/127.2% Fibonacci projection points at 1.3745 and 1.3677, respectively (it is common to focus on the 127.2% ratios; however, leaving 161.8% on the chart provides price some wiggle room and an area to help determine stop-loss placement).
Higher on the curve, weekly price reveals the unit concluded 2020 at fresh multi-month highs. The 2018 yearly opening value at 1.3503 displays support, while further buying places emphasis on resistance at 1.3847. Also of technical interest was the engulf of 1.3514 (December 9 [2019] high), helping to confirm the current uptrend. From the daily timeframe, price is seen hovering between 1.3763 resistance (previous Quasimodo support level) and trend line support, etched from the low 1.1409.
Areas of consideration:
- Reclaiming 1.36 to the upside on the H4 is obviously a plus for intraday action (it also helps confirm upside strength on the bigger picture – the trend in this market has been higher since March [2020]).
- 1.37, therefore, may be an eyed upside target north of 1.36. A retest at 1.36, preferably joined by a H4 bullish candlestick (confirming) pattern, may tempt dip-buyers to engage.
- 1.35 stands as potentially strong support, merging with weekly support at 1.3503.
AUD/USD:
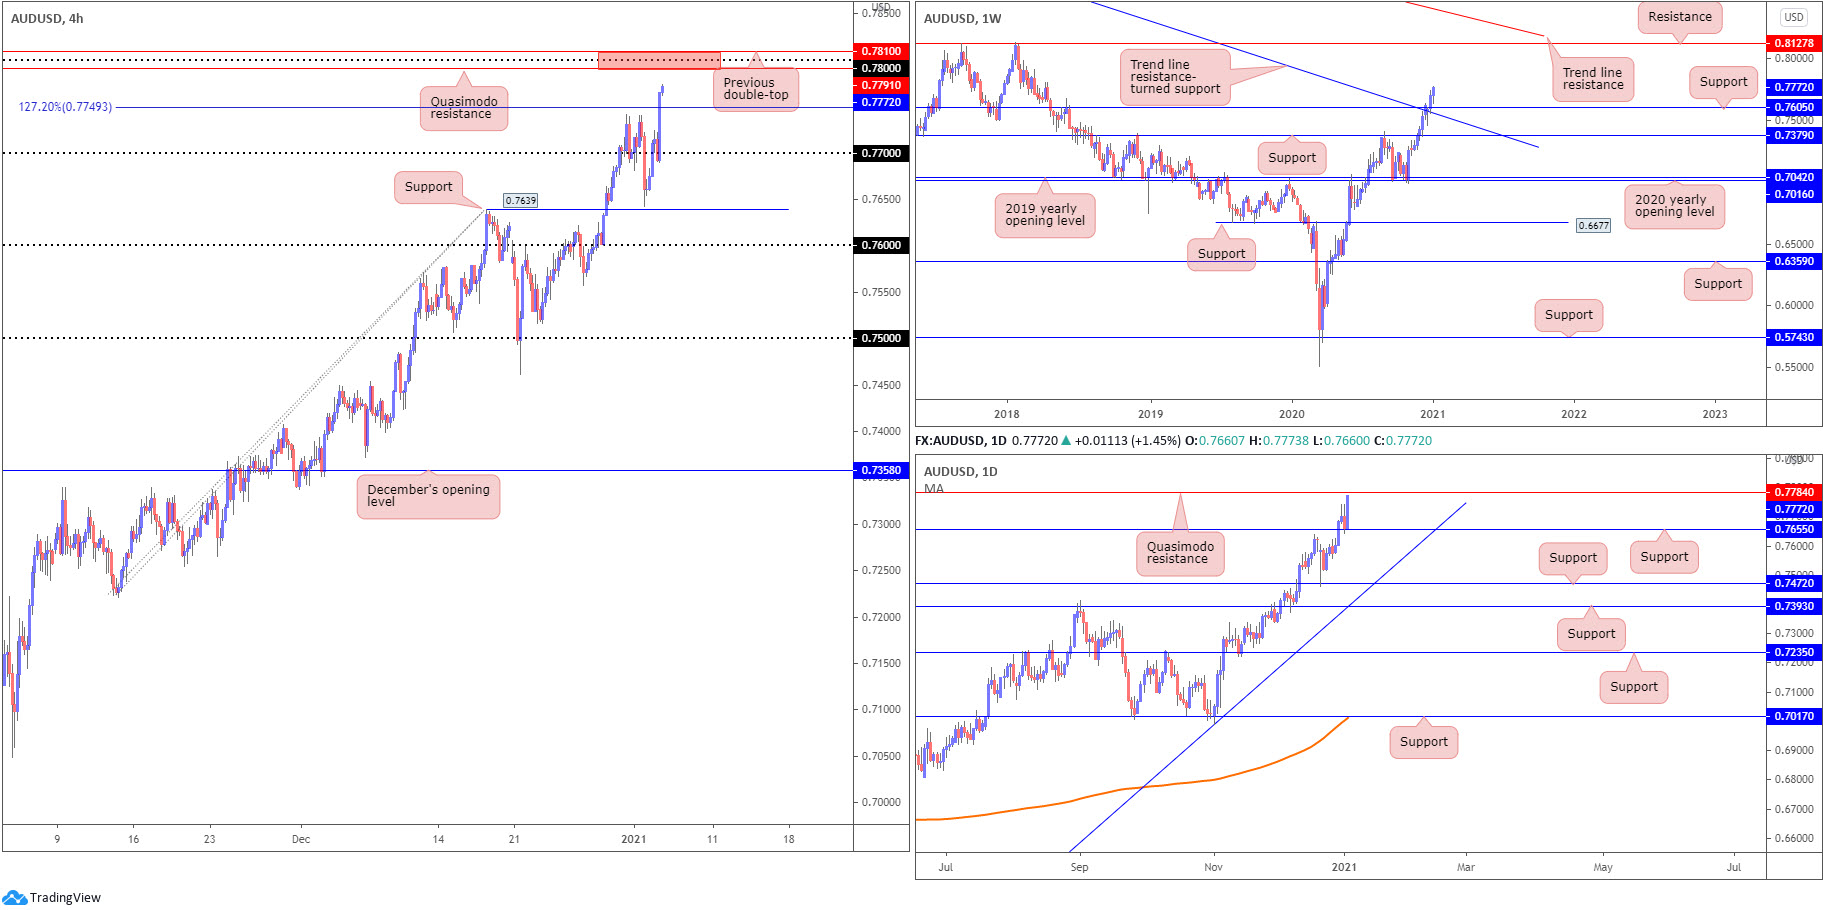
Upbeat risk sentiment, together with USD weakness, watched AUD/USD refresh multi-month highs on Tuesday. Following a retest at the 0.77 figure on the H4, buyers powered on to the scene, taking out recent highs around 0.7740ish and the 1.272% Fibonacci projection point at 0.7749. Next in firing range is the 0.78 figure, surrounded by resistances at 0.7810 and 0.7791 (the former represents a previous double-top while the latter is a Quasimodo resistance).
The weekly timeframe’s technical landscape, given levels are widely separated, remains unchanged:
The Australian dollar wrapped up 2020 on the front foot against the US dollar. Consequently, the trend remains to the upside. Price glided through Quasimodo resistance at 0.7605 (now serving support) and trend line resistance, taken from the high 1.1065. This places buyers in a strong position as we enter 2021 with room to possibly reach as far north as resistance coming in at 0.8127.
From the daily timeframe, resistance-turned support at 0.7655 proved its worth Tuesday. Holding off this level has thrown Quasimodo resistance at 0.7784 in the mix, located a few pips under the H4 Quasimodo formation.
Areas of consideration:
- Overall, the AUD/USD’s technical trend remains pointing north.
- 78 offers a resistance to be watchful of, converging with additional H4 resistances and a daily Quasimodo resistance drawn from 0.7784.
- Conquering 0.78 is likely to welcome additional buying.
USD/JPY:
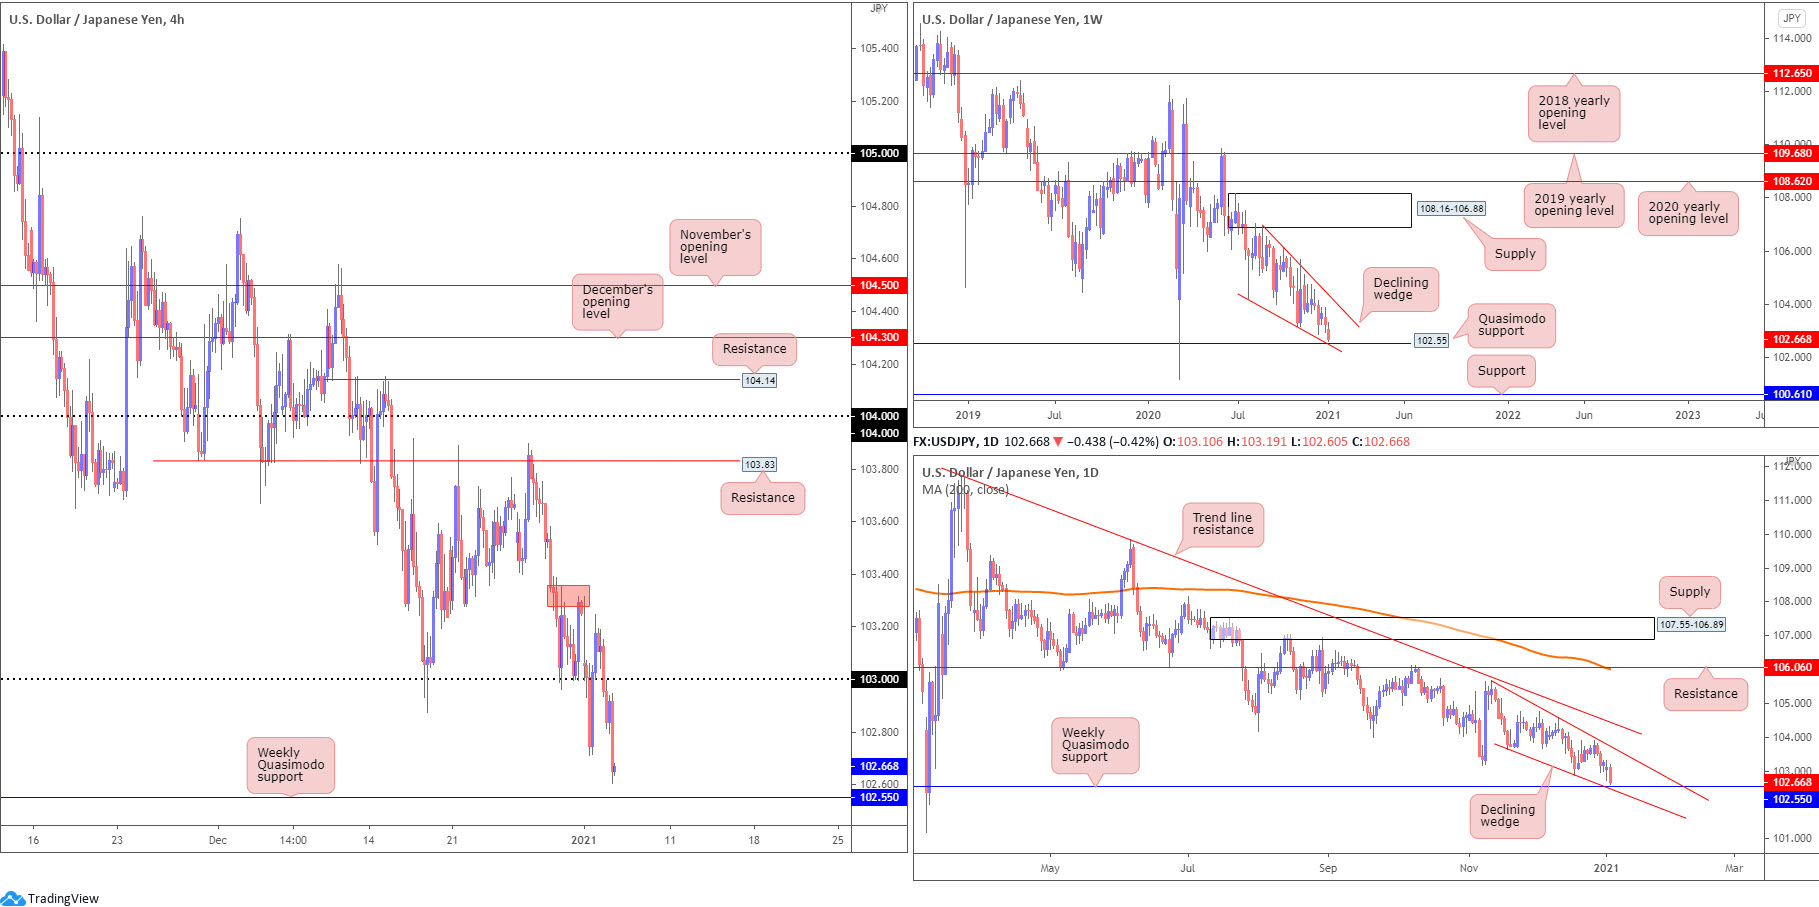
The US dollar slumped to its lowest level since early March (2018) against the Japanese yen on Tuesday, pressured by a soft USD across the board (DXY voyaged south of 89.50).
H4 made quick work of 103, clearing remaining bids and filling sell-stops (breakout sellers). Recent hours observed Monday’s low at 102.71 give way, a move that potentially exacerbated downside momentum. This has elbowed a key level into the limelight: the weekly Quasimodo support at 102.55. Traders who monitor multi-timeframes will also note the weekly Quasimodo converges with the lower edges of two declining wedge patterns (weekly timeframe: 104.18 daily timeframe: 103.65).
A strong bounce from 102.55 may provide enough impetus for buyers to attempt a breakout above the current declining wedge patterns.
Areas of consideration:
- The weekly Quasimodo support is a key level at 102.55. Rebounding from the latter has the 103 figure on the H4 in sight, while moves under 102.55 could take aim at 102.
USD/CAD:
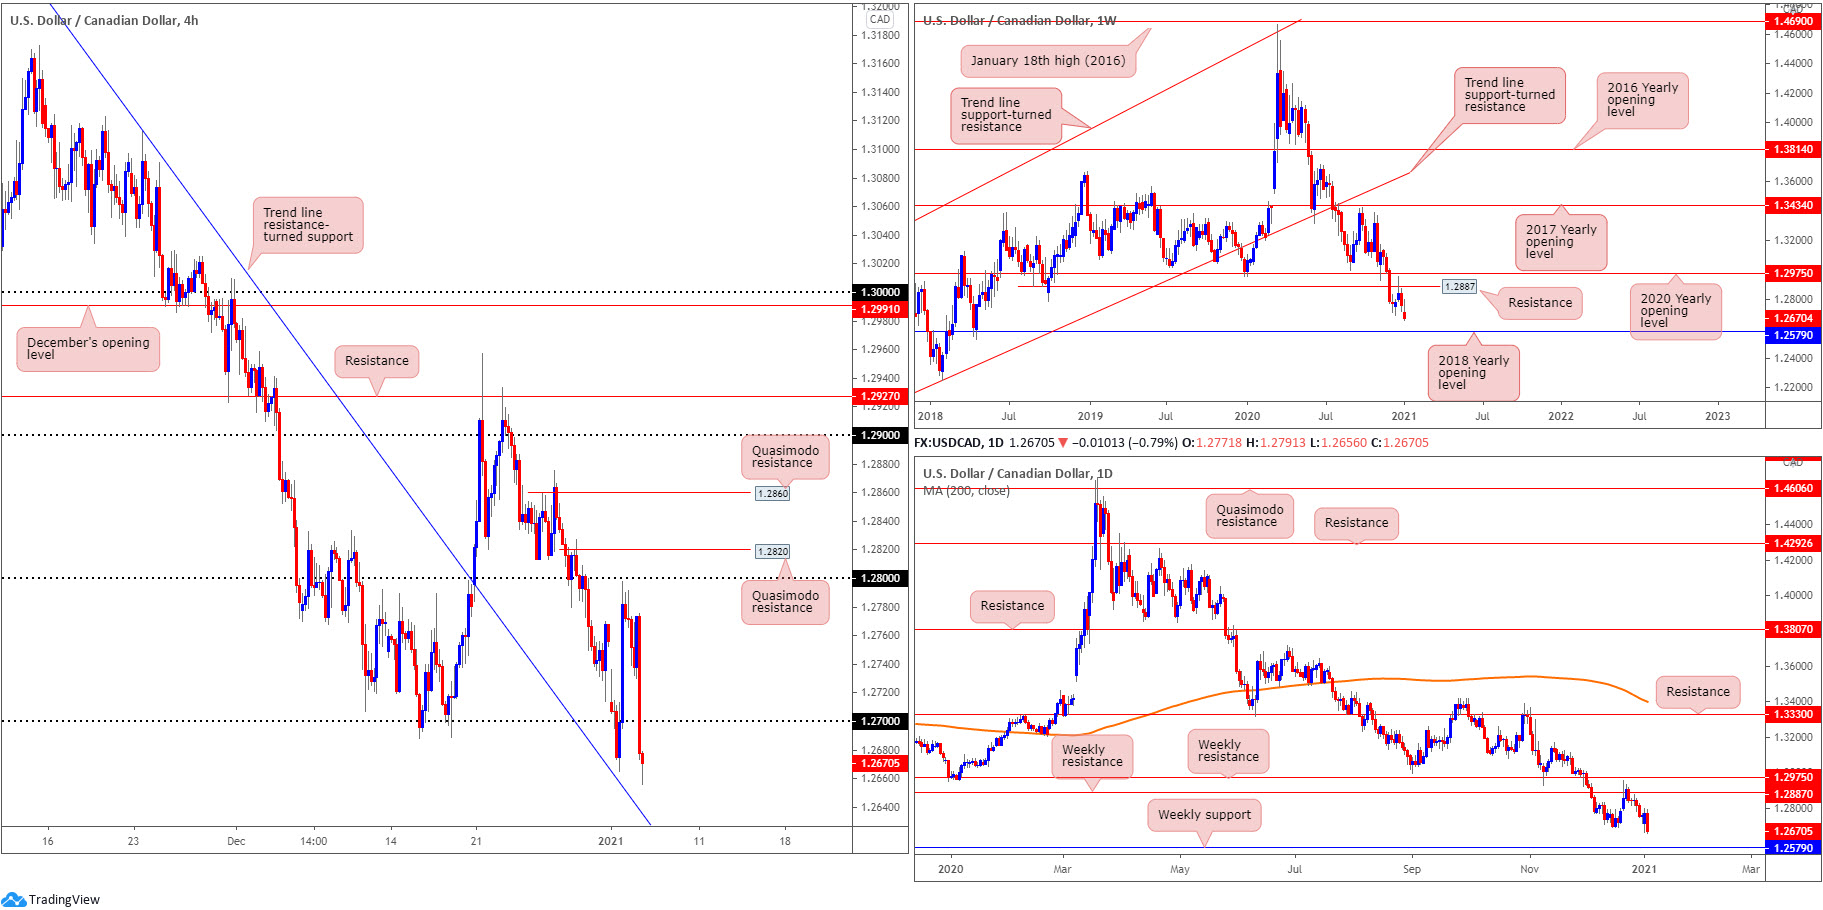
A heavily bid oil market (highs at $50.18 a barrel), along with USD downside, witnessed USD/CAD hit the ropes Tuesday. Nosediving through 1.27 on the H4, the pair recently refreshed multi-month lows at 1.2656 and landed short-term candle action within touching distance of trend line resistance-turned support, extended from the high 1.3389.
Further afield, weekly price has buyers and sellers going toe-to-toe between resistance at 1.2887 (previous Quasimodo support level) and support priced in at 1.2579 (the 2018 yearly opening value). From the weekly timeframe, we can also see the pair has been under pressure since topping at 1.4667 in March. Elsewhere, a similar picture is visible on the daily chart.
Areas of consideration:
- All three timeframes, according to the technical studies presented above, exhibit bearish posture.
- The break of 1.27 on the H4 likely brought with it breakout selling. A retest at the underside of 1.27, therefore, could be a potential bearish scenario, targeting H4 trend line resistance-turned support as the initial take-profit target. Ultimately, traders are likely to be eyeing weekly support around 1.2579, or the 1.26 figure on the H4.
USD/CHF:
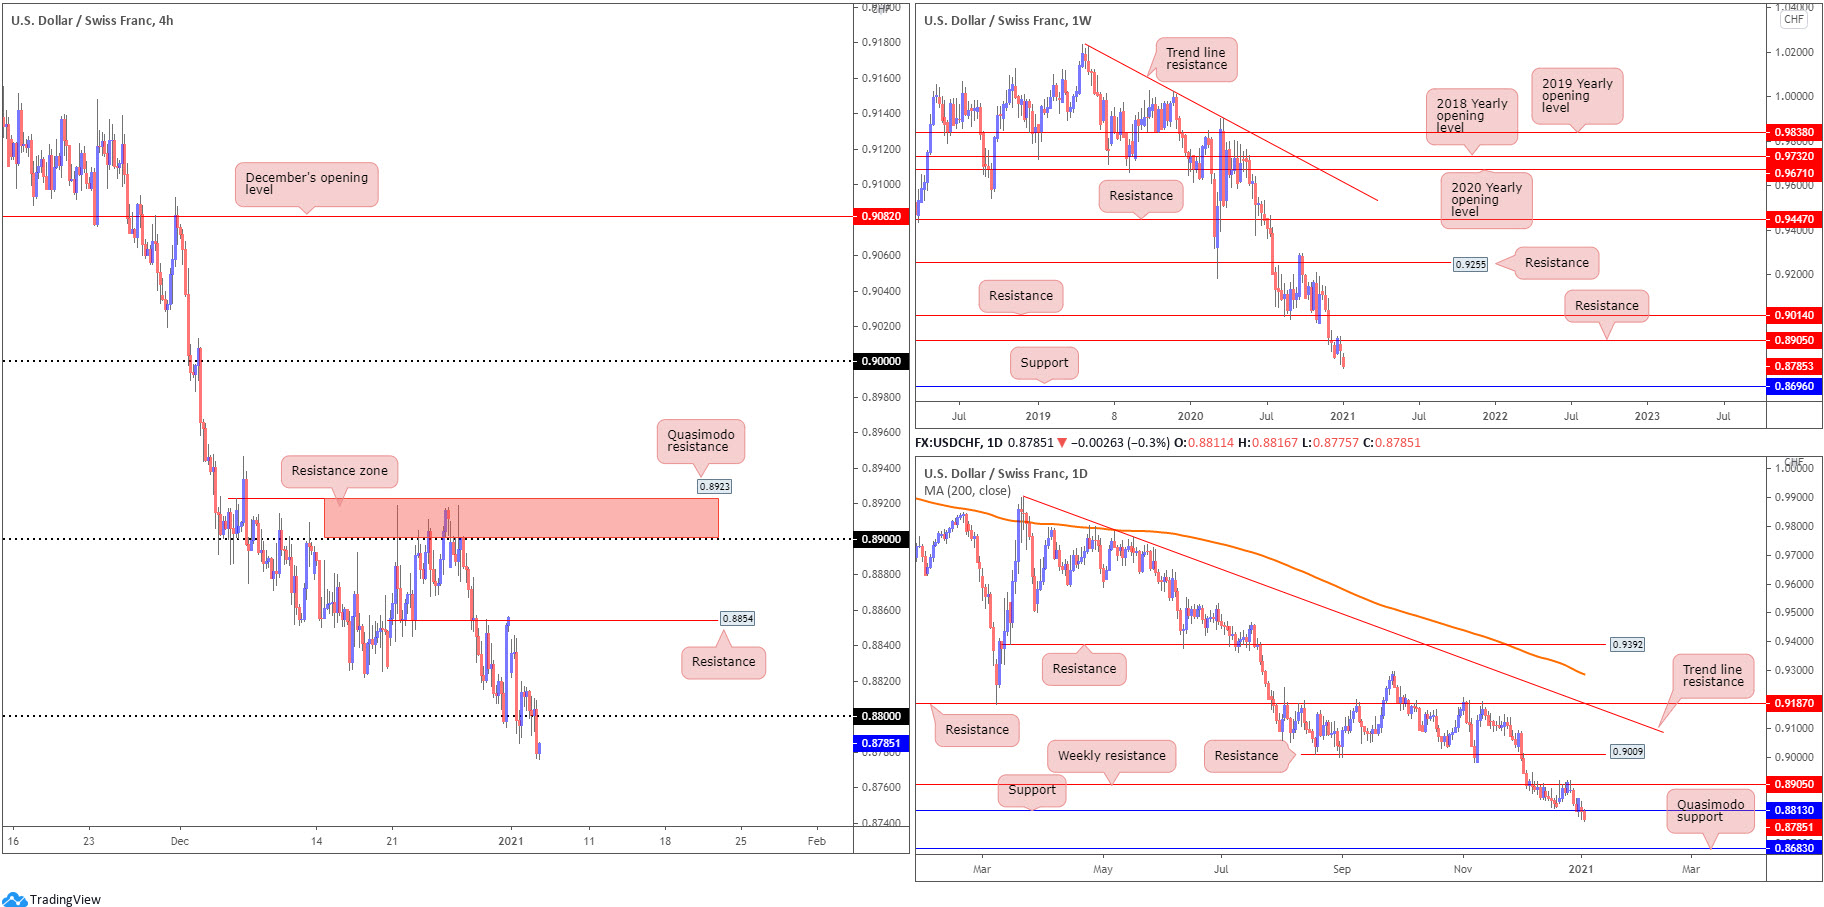
The technical position in USD/CHF suggests sellers continue to hold the upper hand.
From the weekly timeframe, following a December retest at resistance from 0.8905, the ducks appear to be lined up for further weakness over the coming weeks until shaking hands with support priced in at 0.8696.
The daily timeframe had price elbow through support at 0.8813 yesterday, clocking lows not seen since early 2015. Interestingly, the next downside target on the daily scale is seen a touch beneath weekly support at 0.8683, a Quasimodo support.
Across the page on the H4, following a number of attempts at defending 0.88, the psychological figure ceded ground Tuesday. Clearance of this level brings light to the 0.87 figure, in line with the current downtrend (lower since April 2019).
Areas of consideration:
- 88/0.8813 giving way has sparked a bearish scenario towards weekly support at 0.8696 – essentially the 0.87 figure on the H4. Conservative sellers are likely to seek a 0.88 retest before pulling the trigger. Should the retest be accompanied by a H4 bearish candlestick signal, this will likely attract additional sellers.
Dow Jones Industrial Average:
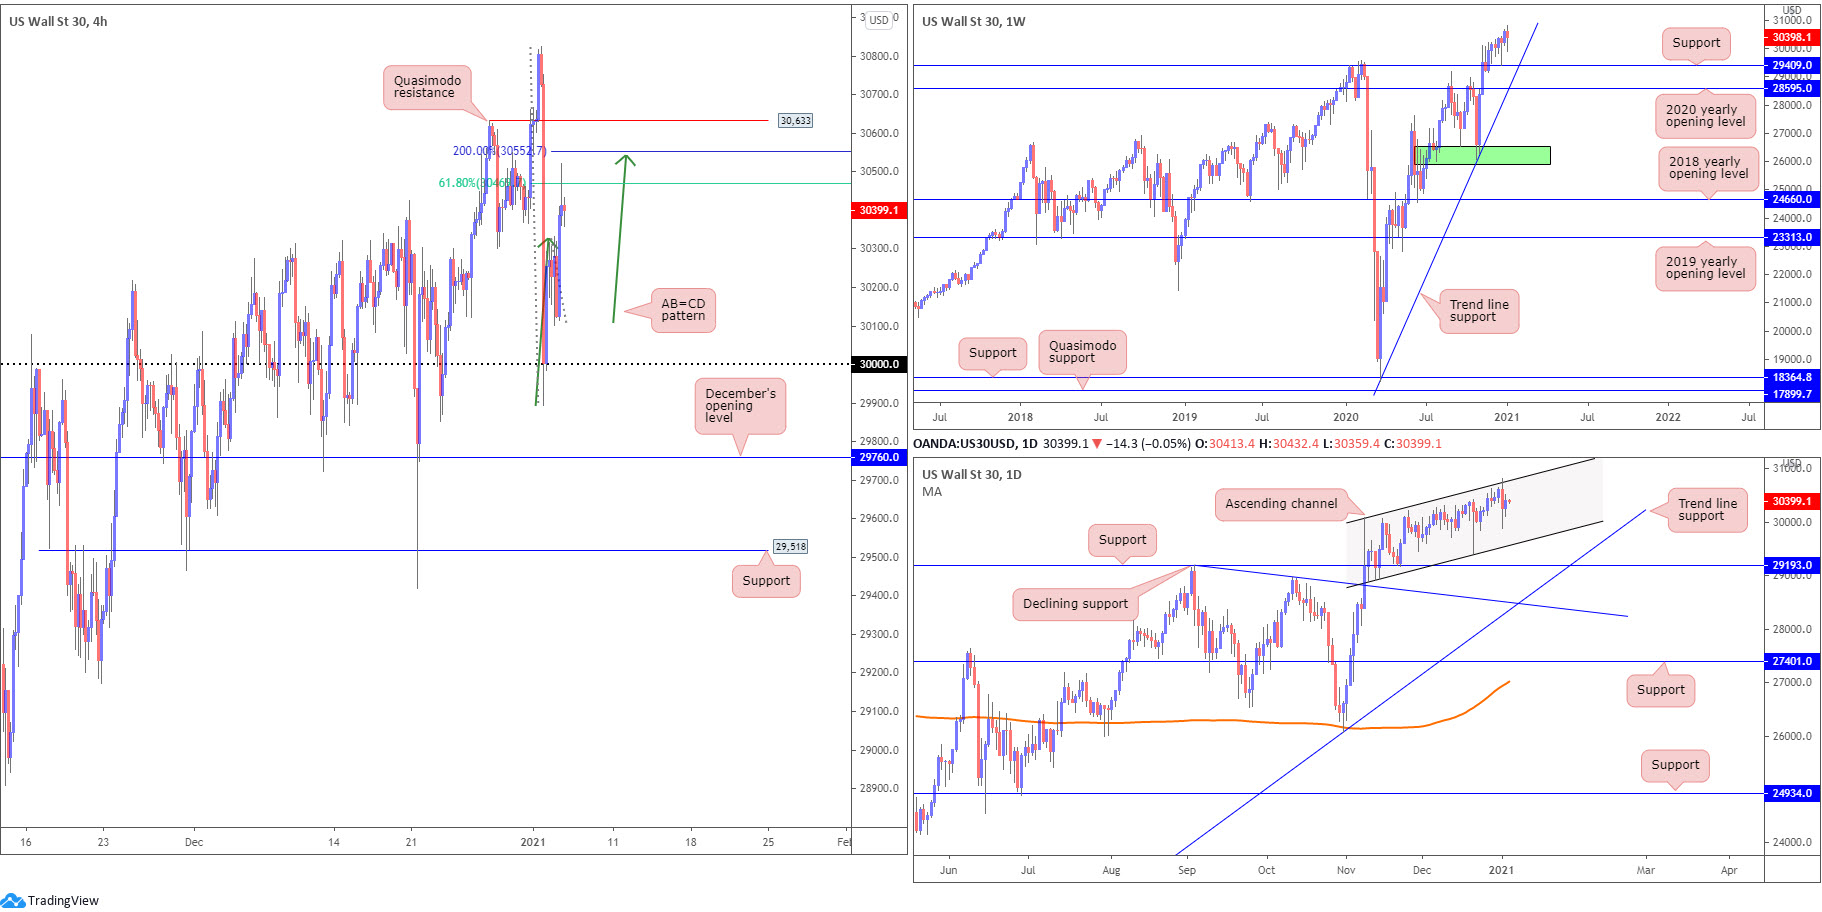
Equities on Wall Street wrapped up higher Tuesday, a day after broad losses. The Dow Jones Industrial Average added 167.71 points, or 0.55%; the S&P 500 advanced 26.21 points, or 0.71% and the Nasdaq advanced 120.51 points, or 0.95%.
On the technical front, H4 recently fashioned an AB=CD bearish pattern (green arrows), forming a potential reversal zone between the 2.0 BC projection at 30,552 and a 61.8% Fibonacci retracement ratio at 30,467. Directly above resides a Quasimodo resistance at 30,633.
From the weekly timeframe, support at 29,409 (previous Quasimodo resistance) remains in view, as does trend line support, extended from the low 18,213. A closer reading of price action on the daily timeframe reveals the unit is currently encased within an ascending channel formation between 30,097 and 28,881. Below here, support at 29,193 is seen.
Overall, the uptrend remains strong.
Areas of consideration:
- H4 AB=CD bearish pattern between 30,552/30,467, targeting the 30,000 figure. However, a short here, of course, is against the overall uptrend.
- Moving through H4 Quasimodo resistance at 30,633 could spark continuation buying, in favour of fresh all-time highs.
XAU/USD (GOLD):
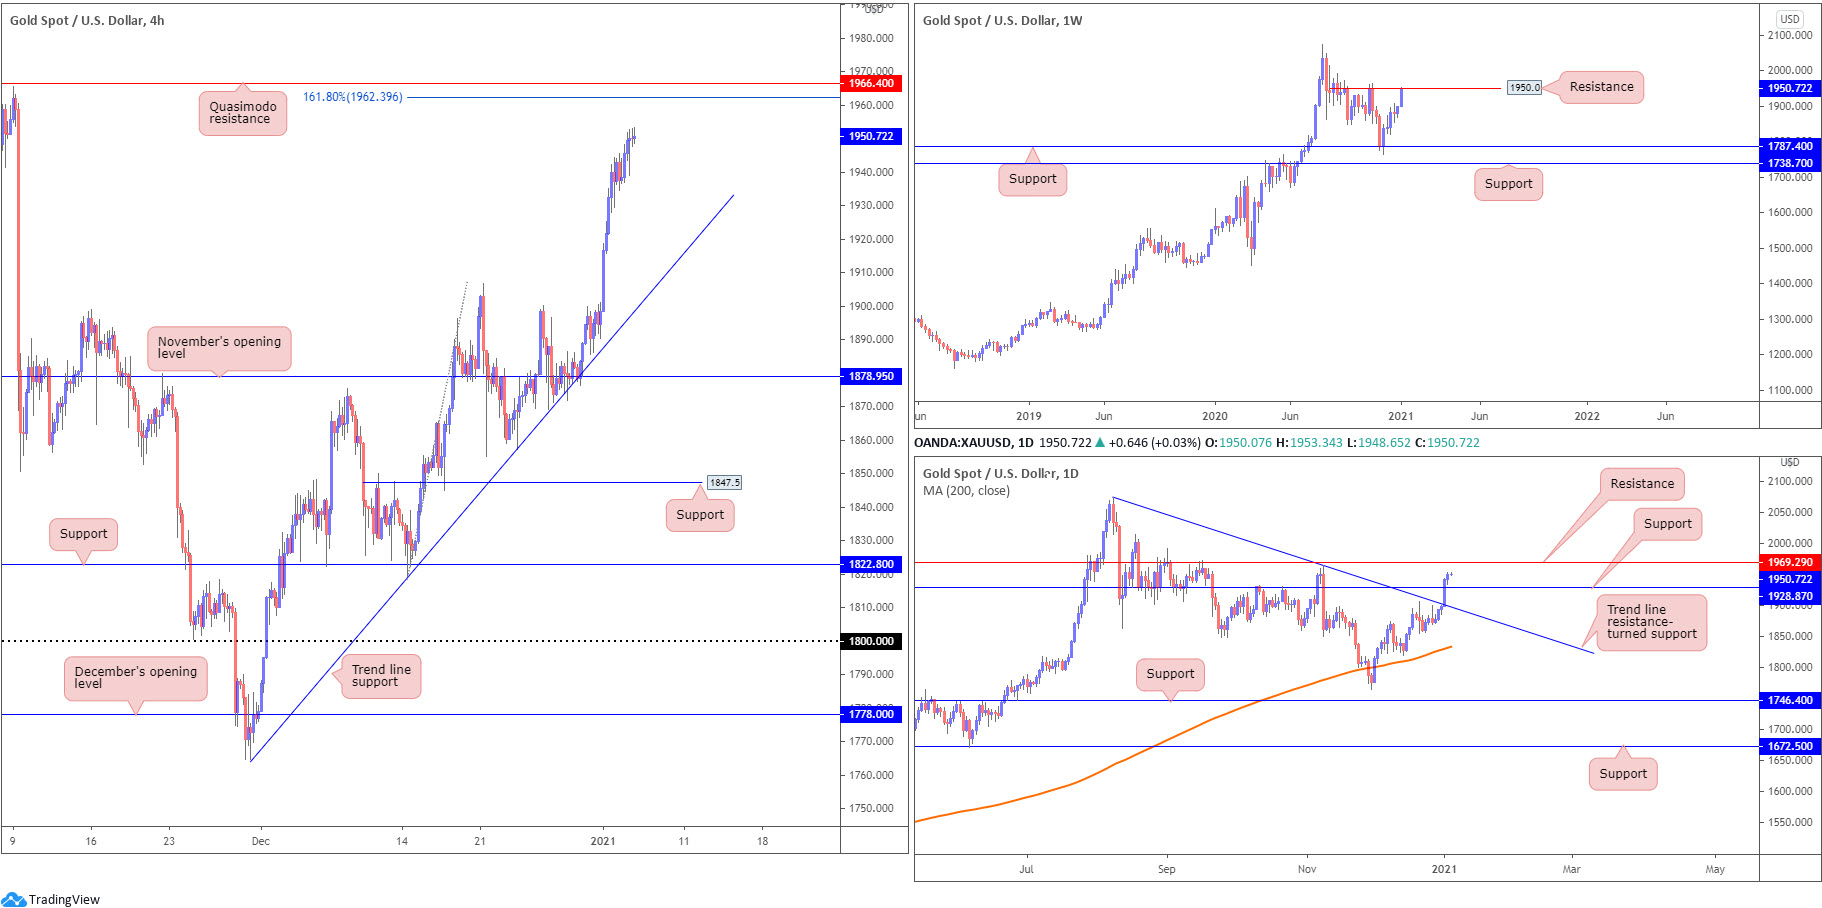
Tuesday’s modest advance had weekly price cross swords with resistance at $1,950 and register a fifth consecutive daily gain. A break here perhaps unlocks access to all-time peaks at $2,075. In terms of trend, the weekly timeframe shows we’ve been higher since early 2016.
A closer examination of price action on the daily chart reveals the metal remains north of trend line resistance, taken from the high $2,075, and resistance at $1,928 (now possible support). Technically, as noted in Tuesday’s technical briefing, this shifts interest to resistance at $1,969.
Across the page on the H4 chart, trend line support, etched from the low $1,764, served buyers well. The recent advance placed Quasimodo resistance at $1,966 and a 161.8% Fibonacci projection point at $1,962 in the limelight.
Areas of consideration:
- Daily overthrowing resistance at $1,928 helps confirm an upside presence. Weekly resistance at $1,950, however, is a level to be mindful of.
- H4 Quasimodo resistance at $1,966 and a 161.8% Fibonacci projection point at $1,962 are additional resistances traders may have noted, given the connection with daily resistance at $1,969.
The accuracy, completeness and timeliness of the information contained on this site cannot be guaranteed. IC Markets does not warranty, guarantee or make any representations, or assume any liability regarding financial results based on the use of the information in the site.
News, views, opinions, recommendations and other information obtained from sources outside of www.icmarkets.com.au, used in this site are believed to be reliable, but we cannot guarantee their accuracy or completeness. All such information is subject to change at any time without notice. IC Markets assumes no responsibility for the content of any linked site.
The fact that such links may exist does not indicate approval or endorsement of any material contained on any linked site. IC Markets is not liable for any harm caused by the transmission, through accessing the services or information on this site, of a computer virus, or other computer code or programming device that might be used to access, delete, damage, disable, disrupt or otherwise impede in any manner, the operation of the site or of any user’s software, hardware, data or property.


