
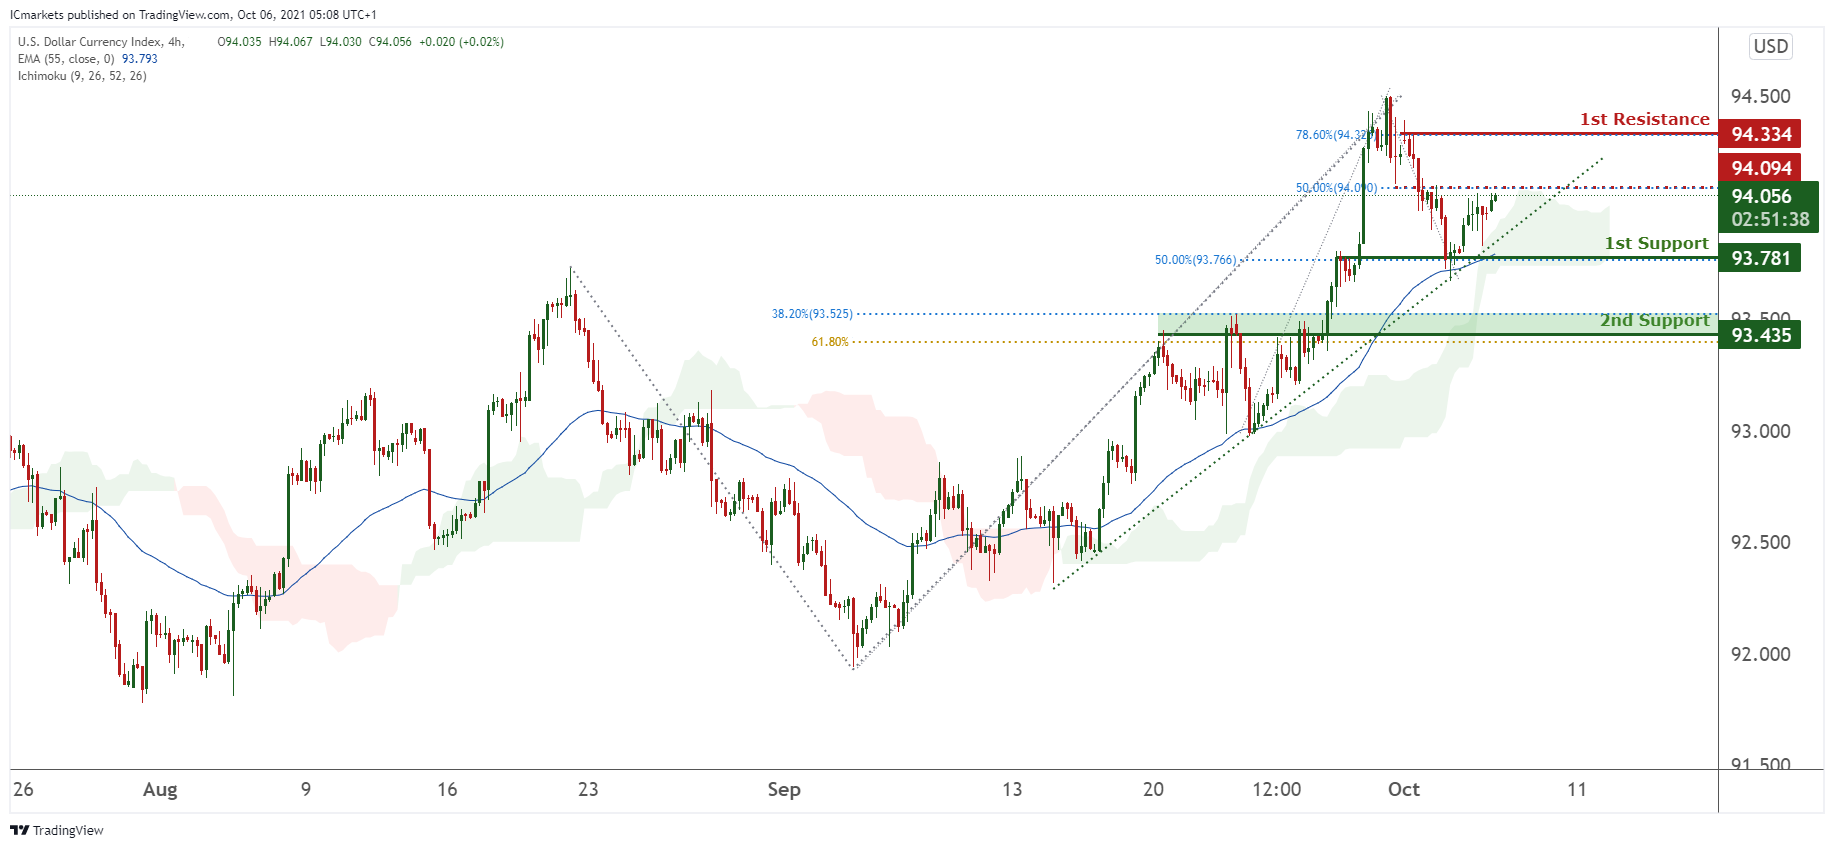
DXY:
On the H4 timeframe, prices have recently tested our 1st support at 93.781 in line with the bullish trendline, 50% Fibonacci Retracement and experienced a bounce. We see a potential of prices climbing higher from 1st support towards our intermediate resistance at 94.056 in line with 50% Fibonacci retracement and 1st resistance at 94.506 which is a graphical swing high. Technical indicators are showing bullish momentum. Alternatively, prices may dip further towards our 2nd support at 93.435 in line with 38.2% and 61.8% Fibonacci retracement.
Areas of consideration:
- H4 time frame, intermediate resistance at 94.056
- H4 time frame, 1st support of 93.781
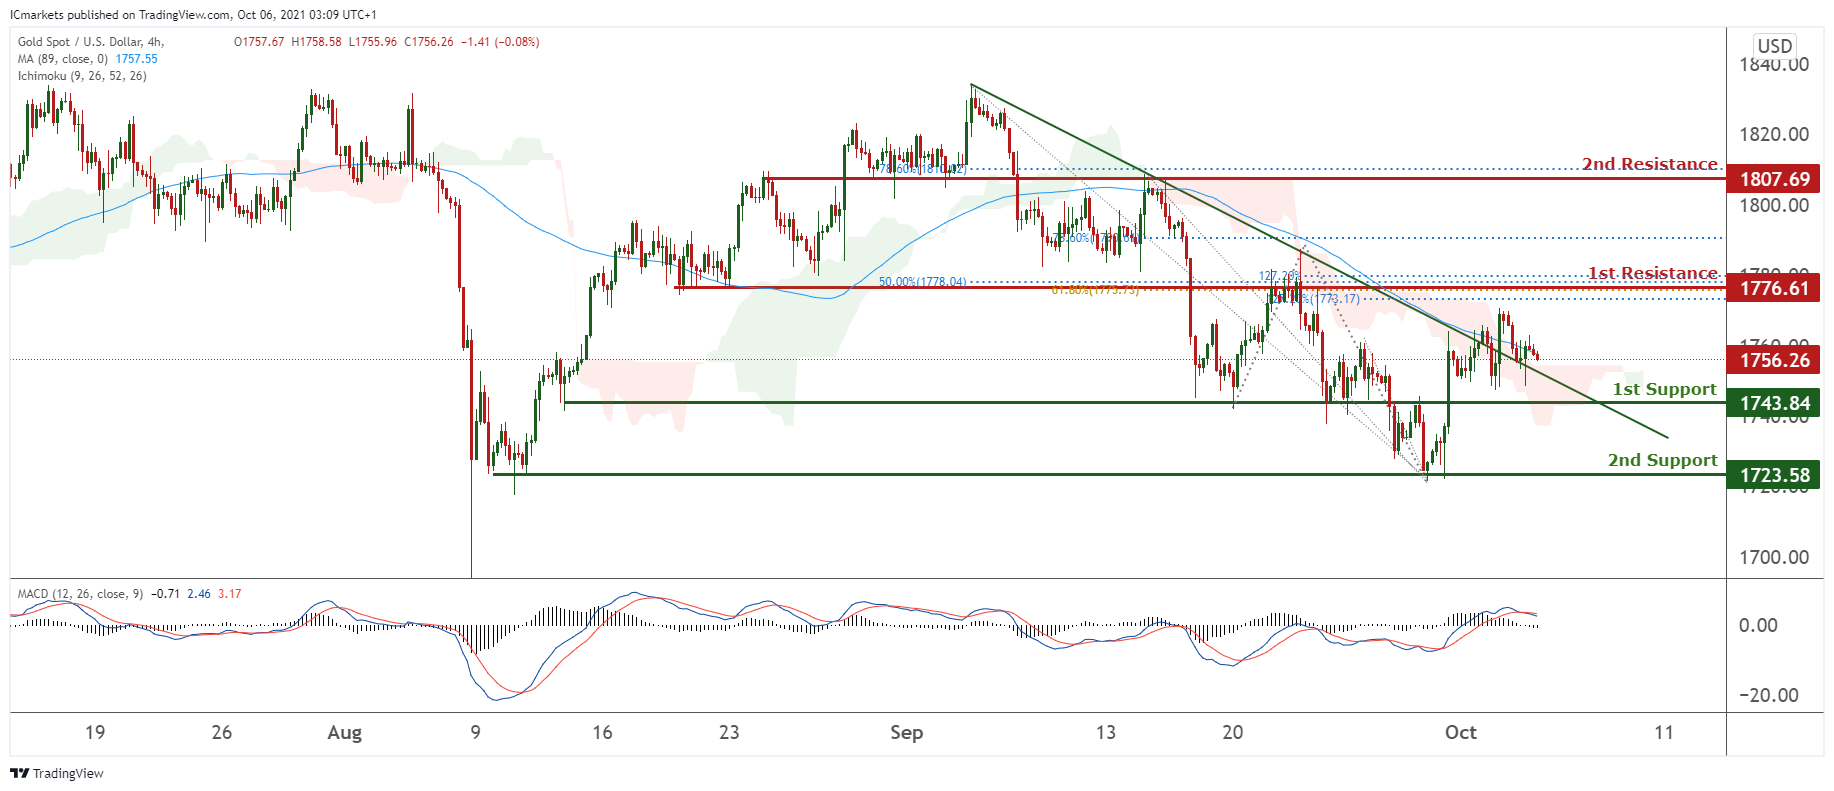
XAU/USD (GOLD):
On the H4 chart, as forecasted previously, price has recently experienced a breakout and has retested the bearish trendline. Price is currently dipping towards our 1st support at 1743.84 which is strong graphical overlap. As indicators are showing mixed signals, we prefer to remain neutral for now. Alternatively, we might wish to observe if prices will climb to our 1st resistance at 1776.61 which is in confluence with 50%, 61.8%, 127.2% Fibonacci retracement and 127.2% Fibonacci extension.
Areas of consideration:
- 4h 1st support at 1743.84
- 4h 1st resistance at 1776.61
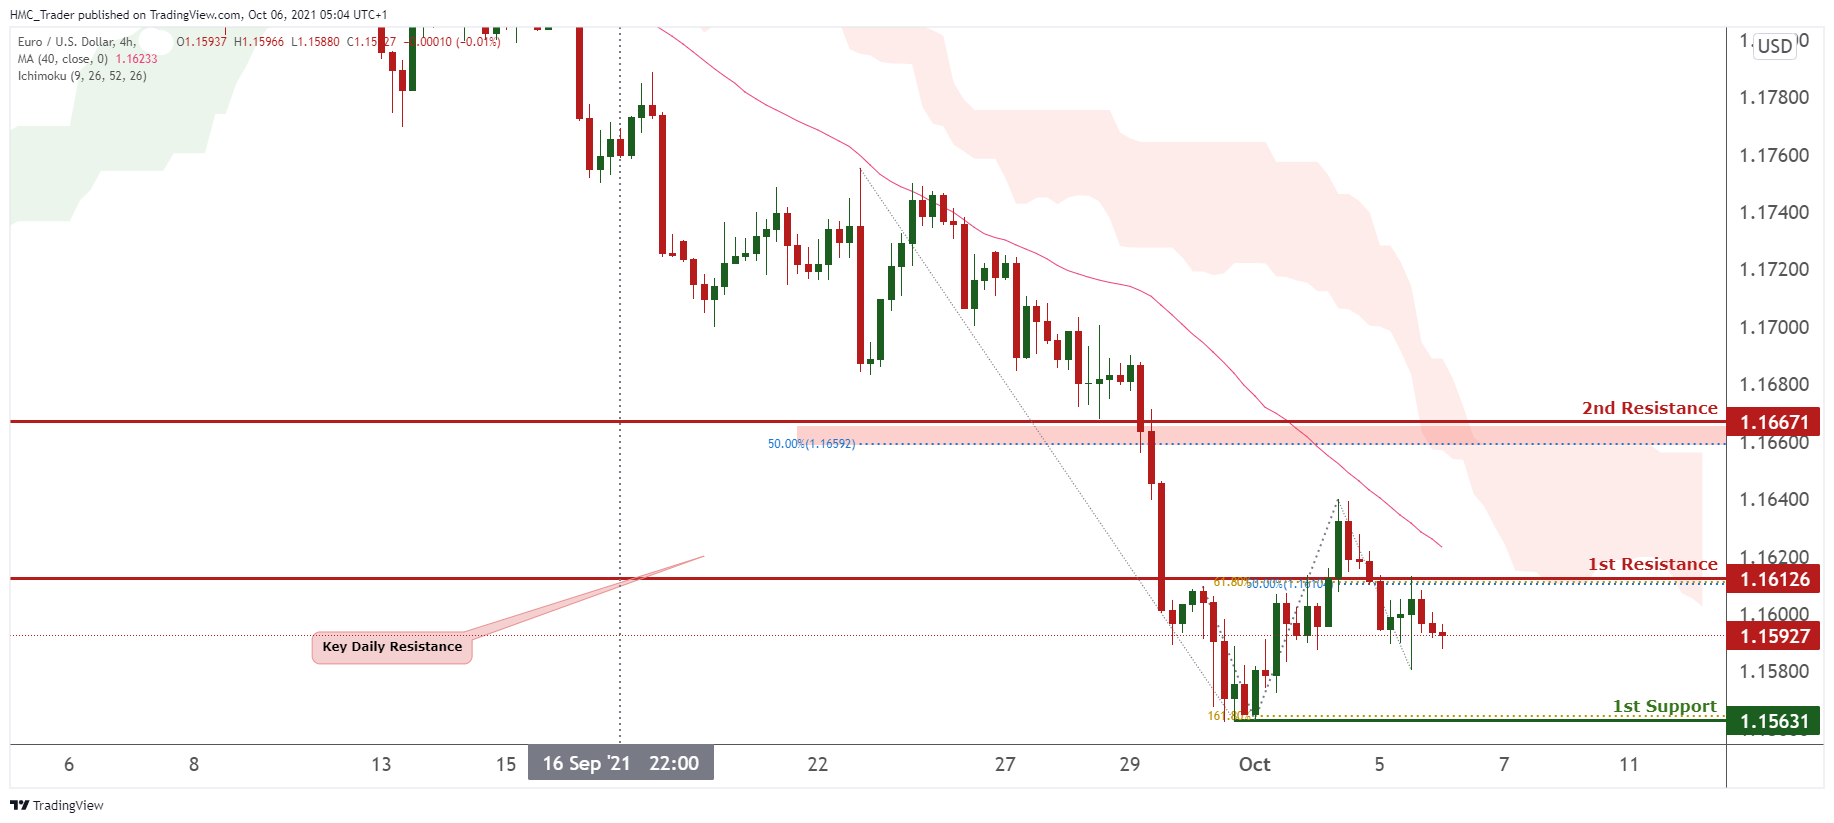
EUR/USD:
On the H4 timeframe, price has recently broken our 1st resistance at 1.16047 which is a key daily resistance but failed to test our intermediate resistance in line with 50% Fibonacci retracement and 61.8% Fibonacci projection . We foresee a continuation of the bearish trend with price testing our 1st support at 1.15631 again which is a graphical swing low. Technical indicators are showing bearish momentum.
Areas of consideration:
- 1st Resistance level at 1.16126
- 2nd Resistance at 1.16671
- 1st support level at 1.15631
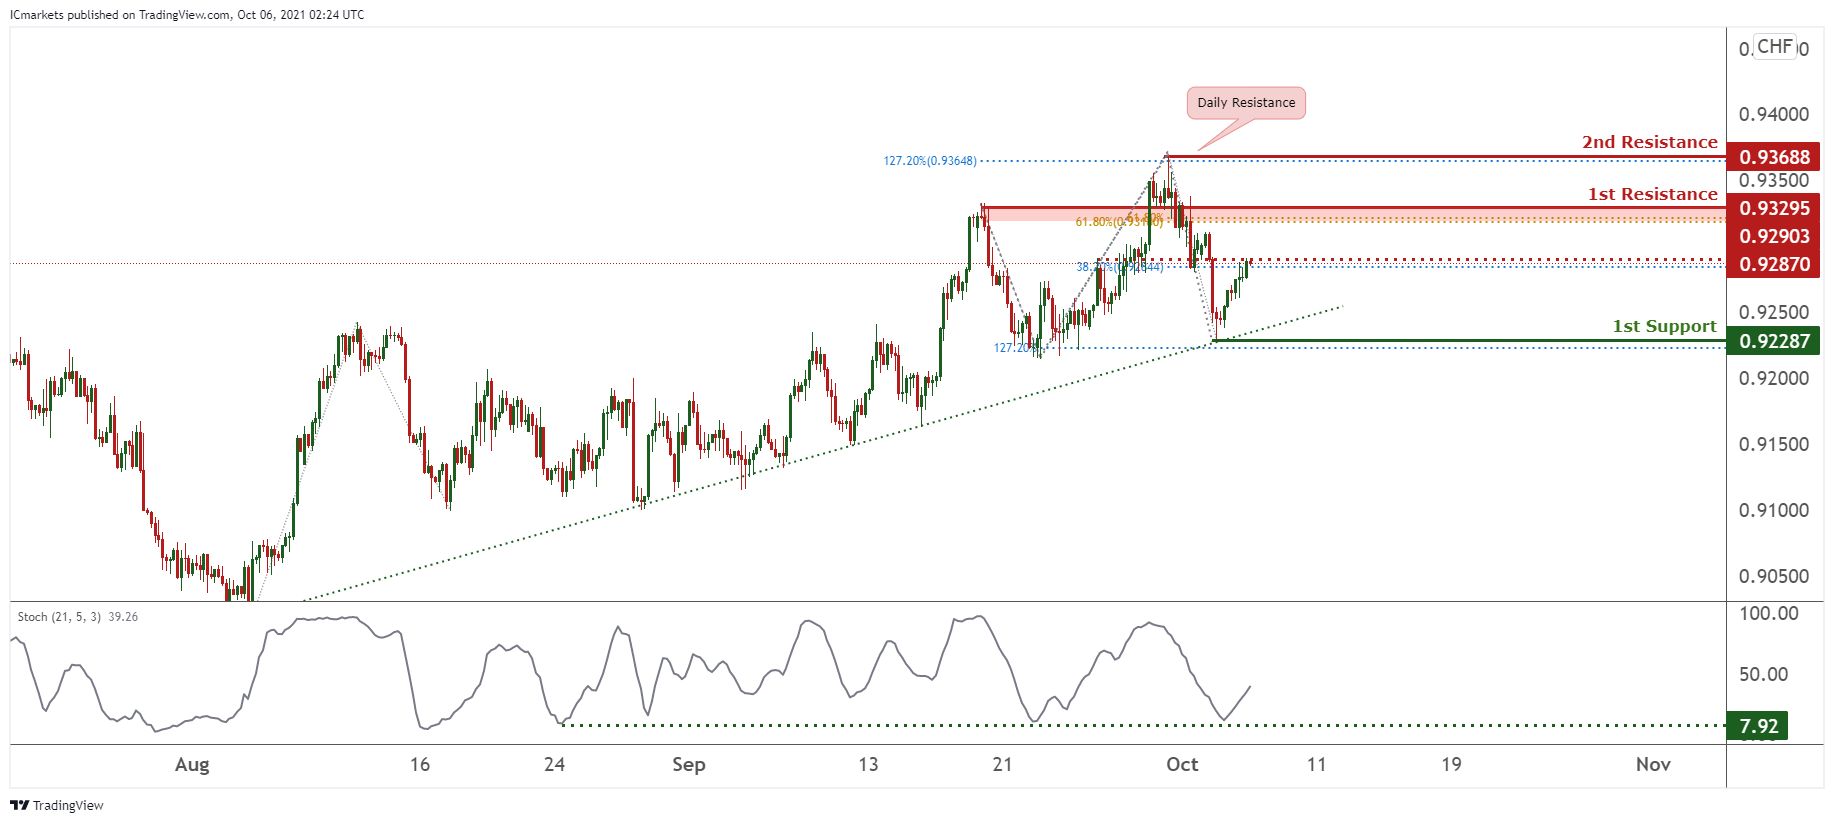
USD/CHF:
On the H4, price is seen to be reacting in between 1st Resistance 0.93295 and 1st Support 0.92287 and holding above the ascending trendline support. Prices have bounced off the 1st Support, and hit an intermediate resistance level, we can expect a bullish momentum towards the 1st Resistance in line with 61.8% Fibonacci retracement and 61.8% Fibonacci Projection if price pushes pass that intermediate resistance level . Our bullish bias is further supported by the stochastic indicator where the %K line bounced off the support line.
Areas of consideration:
- Watch 1st Resistance at 0.93295
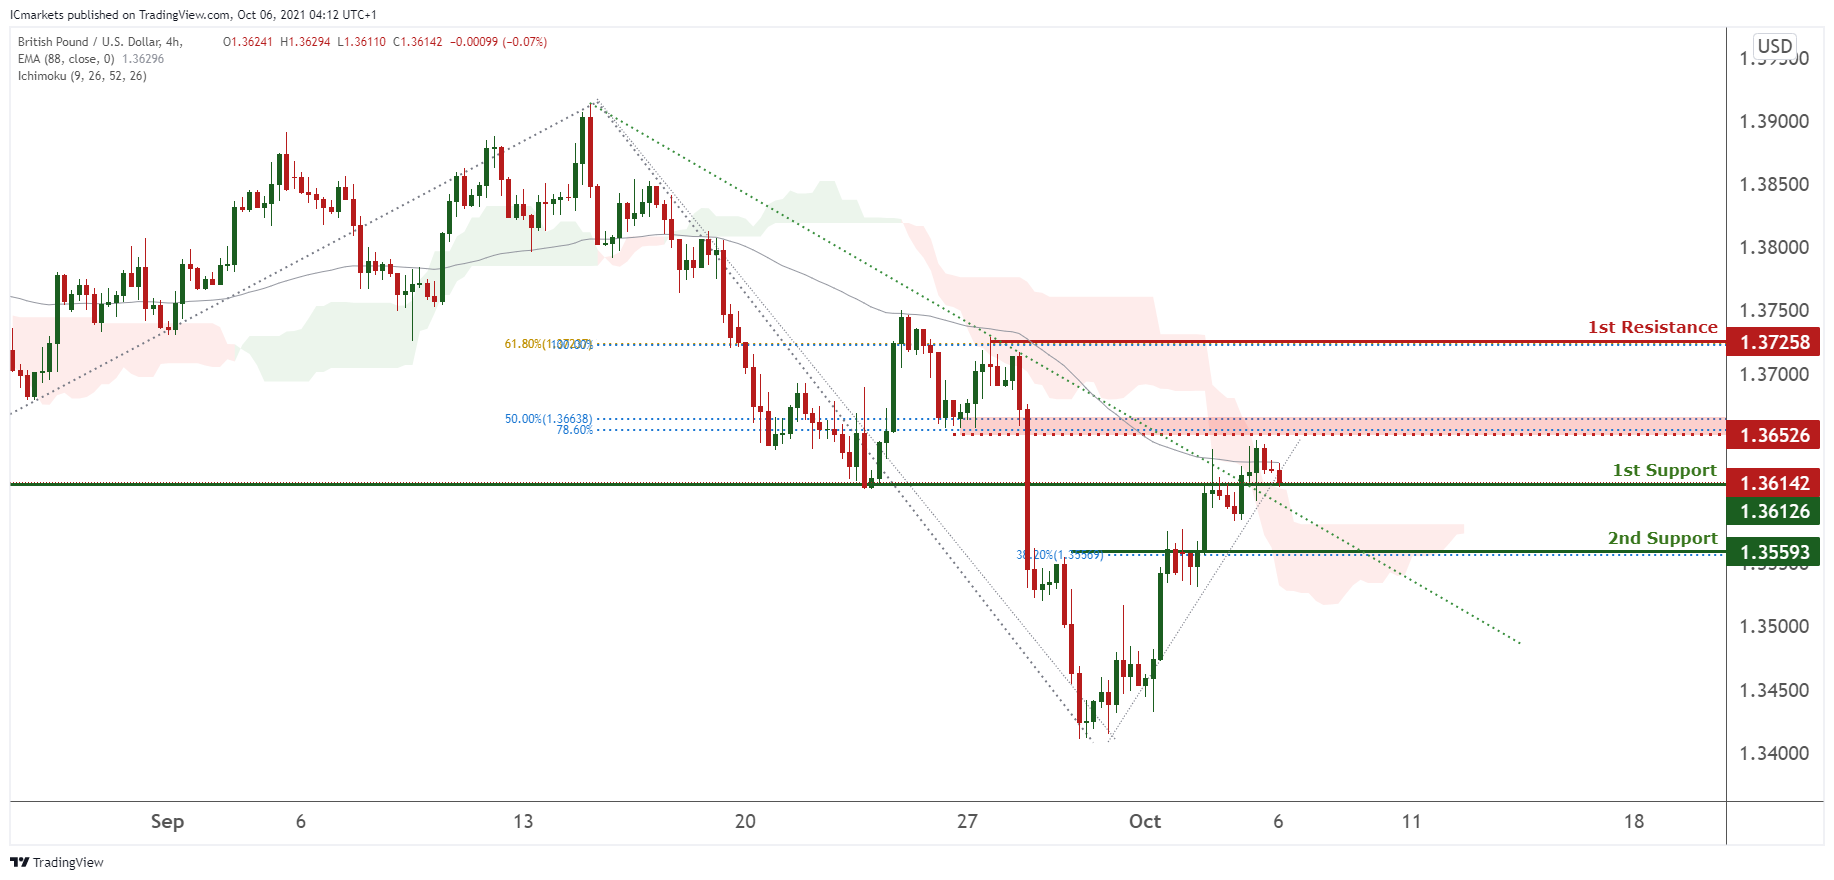
GBP/USD:
On the h4 chart , price has recently broken out from the descending trendline and is currently testing its first support. If price were to break the 50% Fibonacci retracement level and 78.6% Fibonacci projection level, it can potentially go up to its first resistance level of 0.93295 which is on the level of Fibonacci projection level of 100% and retracement level of 61.8%.
Alternatively, if price were to break its first support of 1.36126 it can potentially dip towards its 2nd support of 1.35593.
The Ichimoku cloud indicator shows that price is going to break out of the cloud and thus supporting our bullish momentum.
Areas of consideration:
- 1st Resistance at 1.36126
- 1st Support at at 1.35593
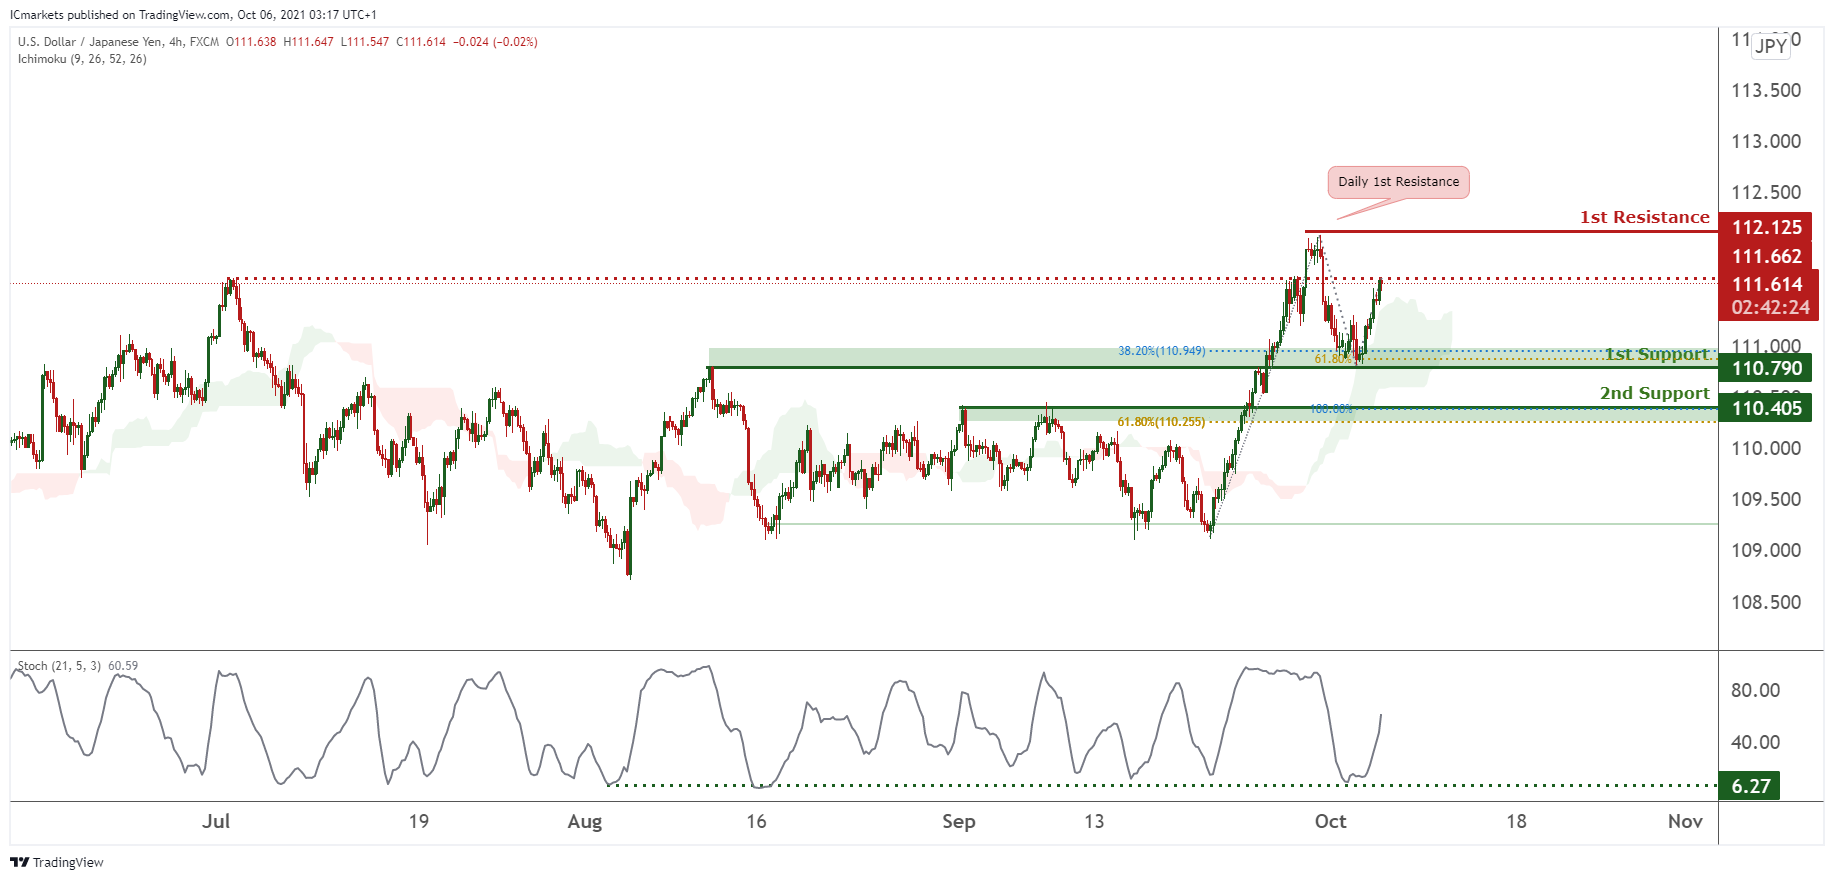
USD/JPY
On the H4 timeframe, price has just bounced nicely at the 1st Support level and hence we can expect a continuation of the short -term bullish trend. We can expect the price to reach the 1st Resistance level in line with daily resistance and previous swing high if price breaks through the intermediate resistance level. Our short-term bullish bias is further supported by the stochastic indicator where the %K line touched the support level and bounced and the Ichimoku indicator where we can see there is strong support from the cloud.
Areas of consideration:
- H4 time frame, 1st resistance of 112.125
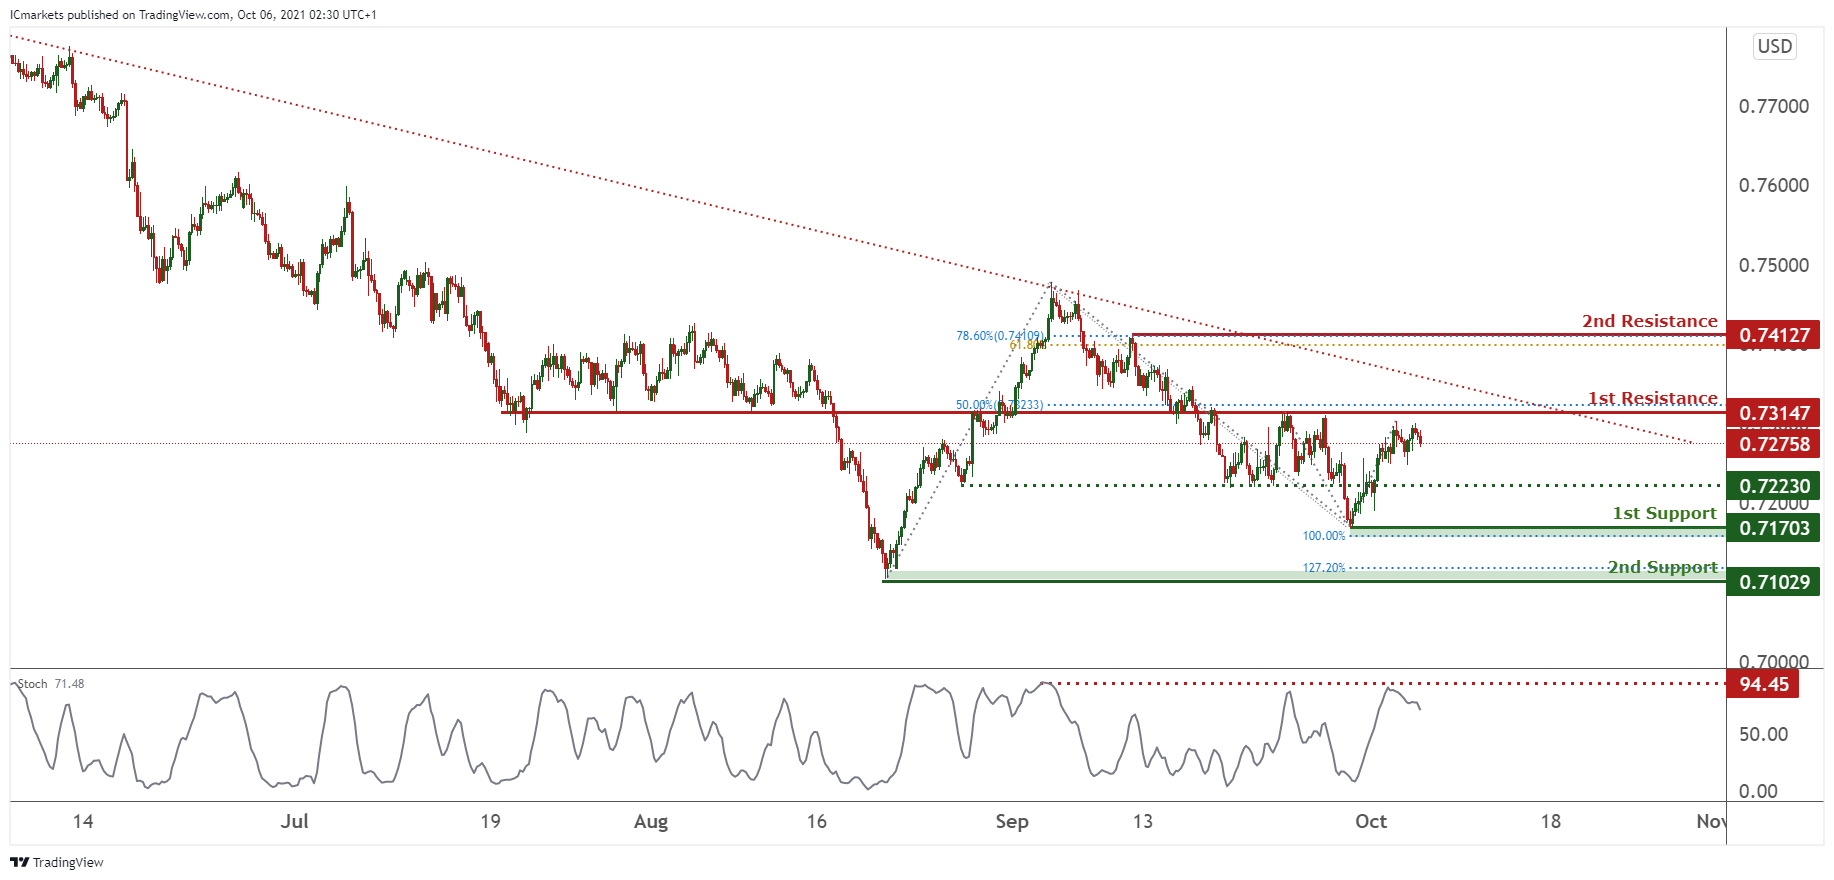
AUD/USD:
On the H4, price is seen to be holding below the descending trendline resistance, signifying a bearish momentum. Price is approaching the 1st resistance where price was not able to break previously, hence we can expect price to drop from 1st Resistance in line with 50% Fibonacci Retracement towards the intermediate support then the 1st Support in line with previous swing low. Our bearish bias is further supported by the stochastic indicator where the %K line touched the resistance level and dropped from that level.
Areas of consideration:
- H4 1st resistance level 0.73147
- H4 1st support level 0.71703
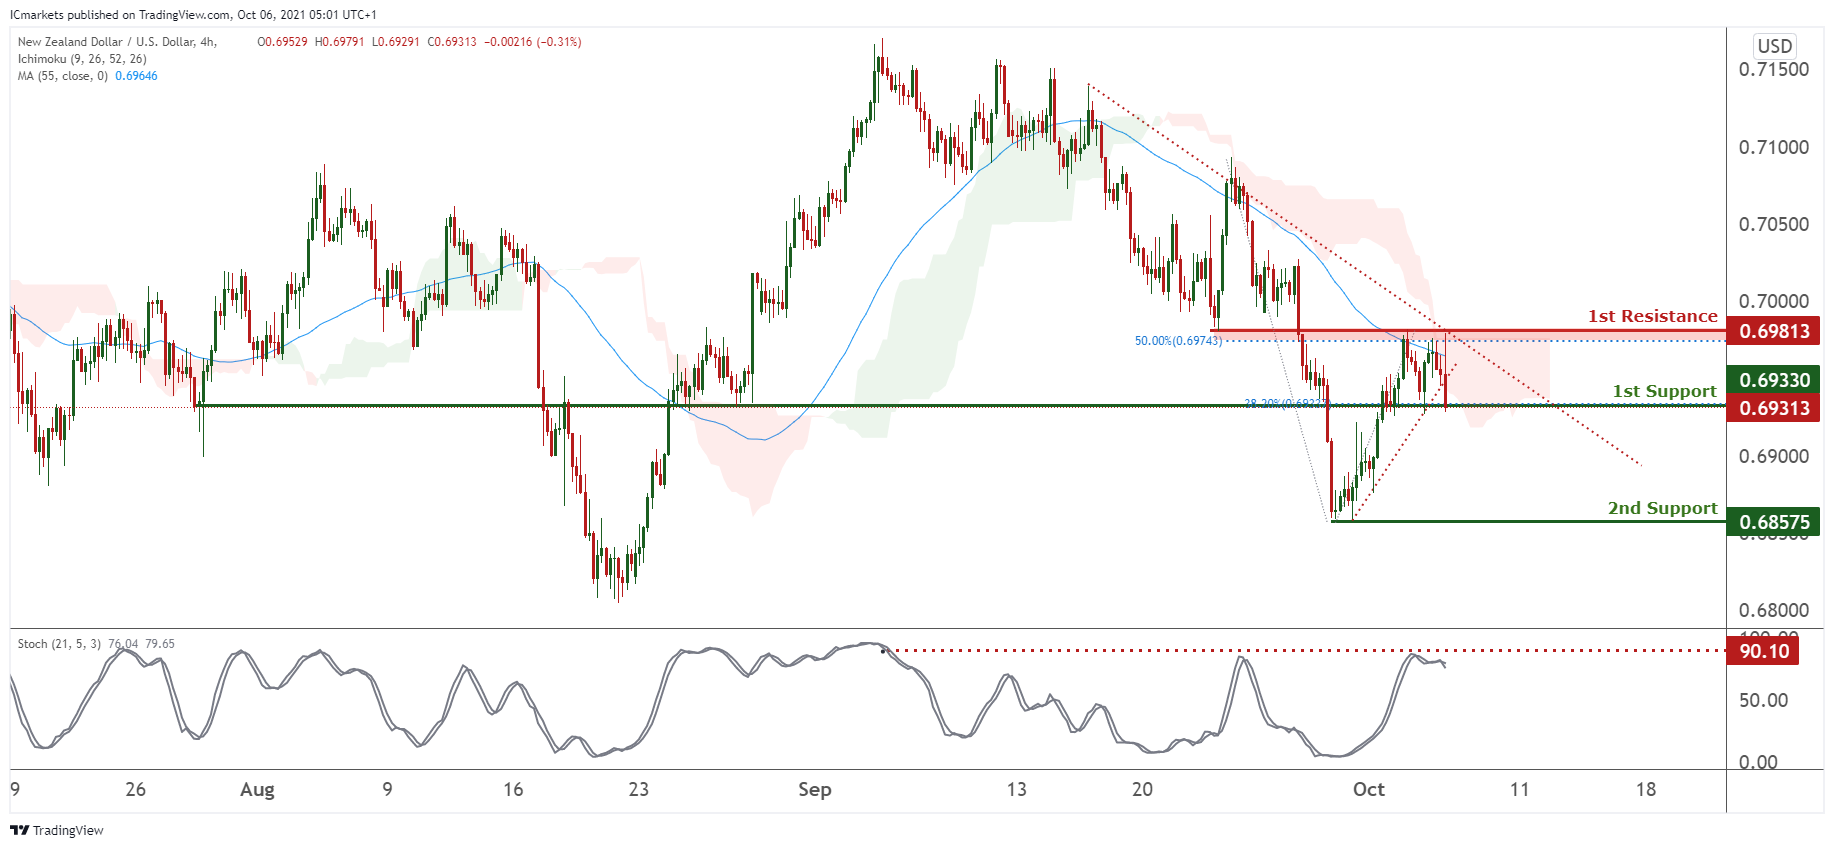
NZD/USD:
On the H4 timeframe, price is on a bearish momentum and has recently tested our 1st support at 0.69330 in line with 38.2% Fibonacci retracement and bearish trendline. We see a possibility of prices breaking through our 1st support at 0.69330 towards our 2nd support at 0.68575 which is a graphical swing low. Technical indicators are showing bearish momentum. Alternatively, a reversal through the ichimoku clouds might find prices testing our area of 1st resistance at 0.69813 in line with 50% Fibonacci Retracement.
Areas of consideration:
- H4 time frame, 1st resistance at 69813
- H4 time frame, 1st support at 0.69330
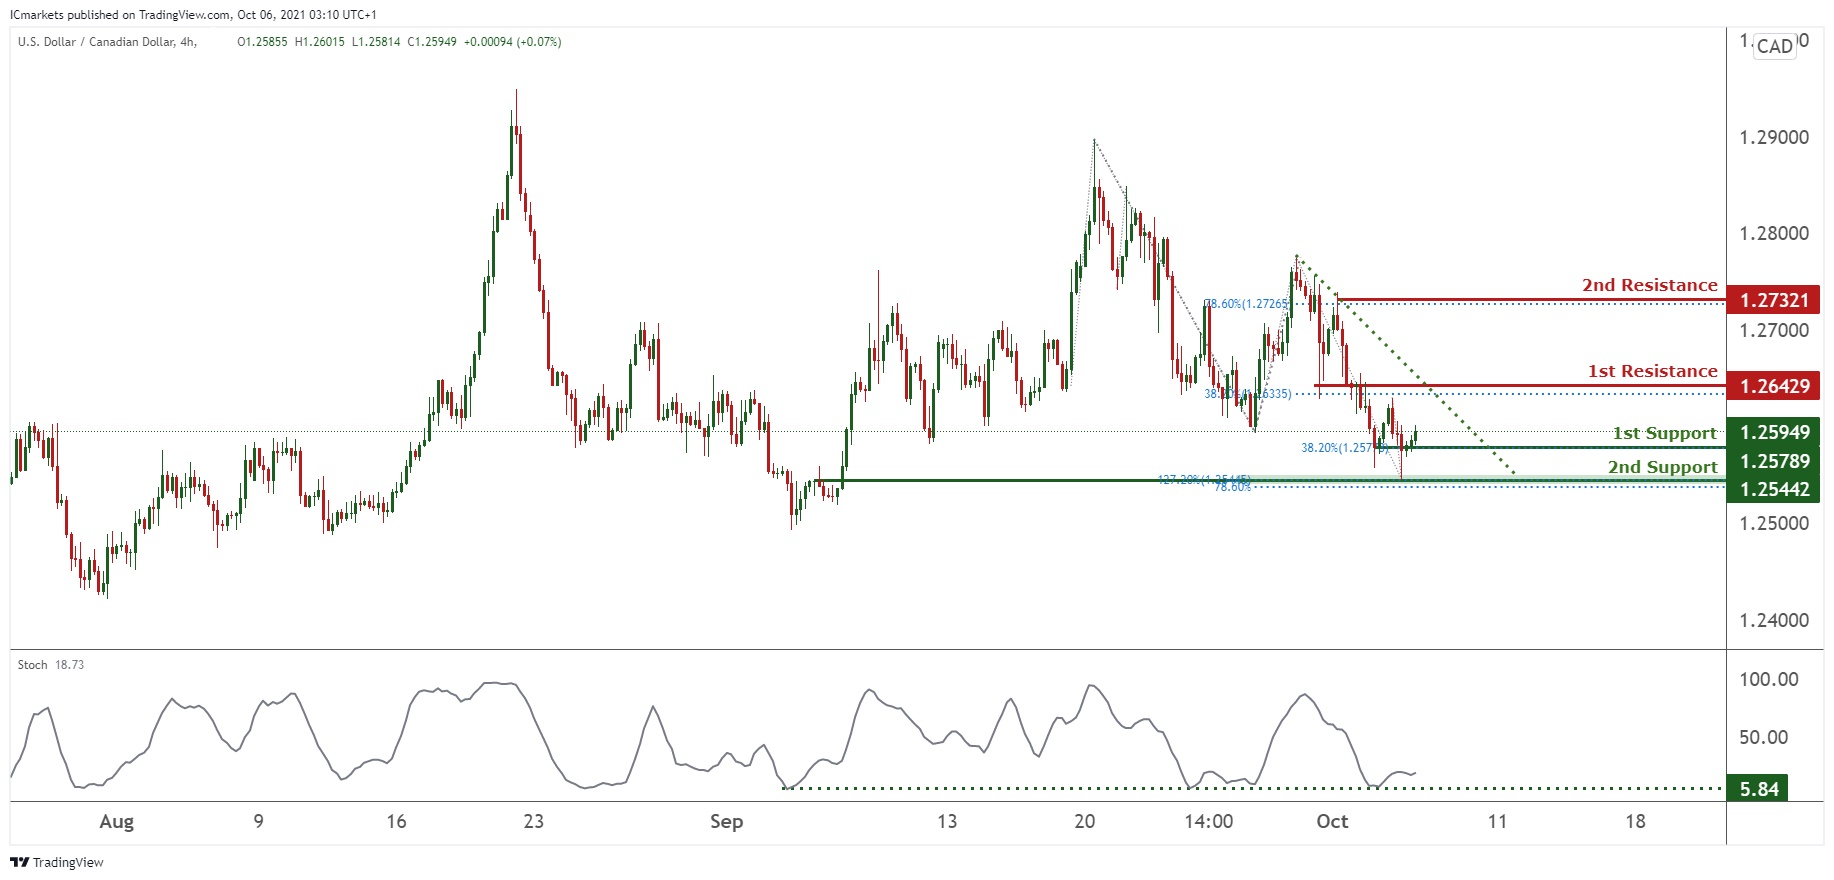
USD/CAD:
On the H4, with stochastic testing resistance where price dropped in the past along with the current price’s respect of the trend line, a retest at 1st support has happened and price is likely heading for 1st resistance at 1.26429 which is in line with the 38.2% Fibonacci retracement If price breaks first resistance, we will see prive heading for second resistance at 1.26951 in line with the 61.8% Fibonacci retracement. Otherwise, breaking below 1st support, we will see price drop towards 2nd support at 1.25442.
Areas of consideration:
- H4 time frame, support at 1.25776
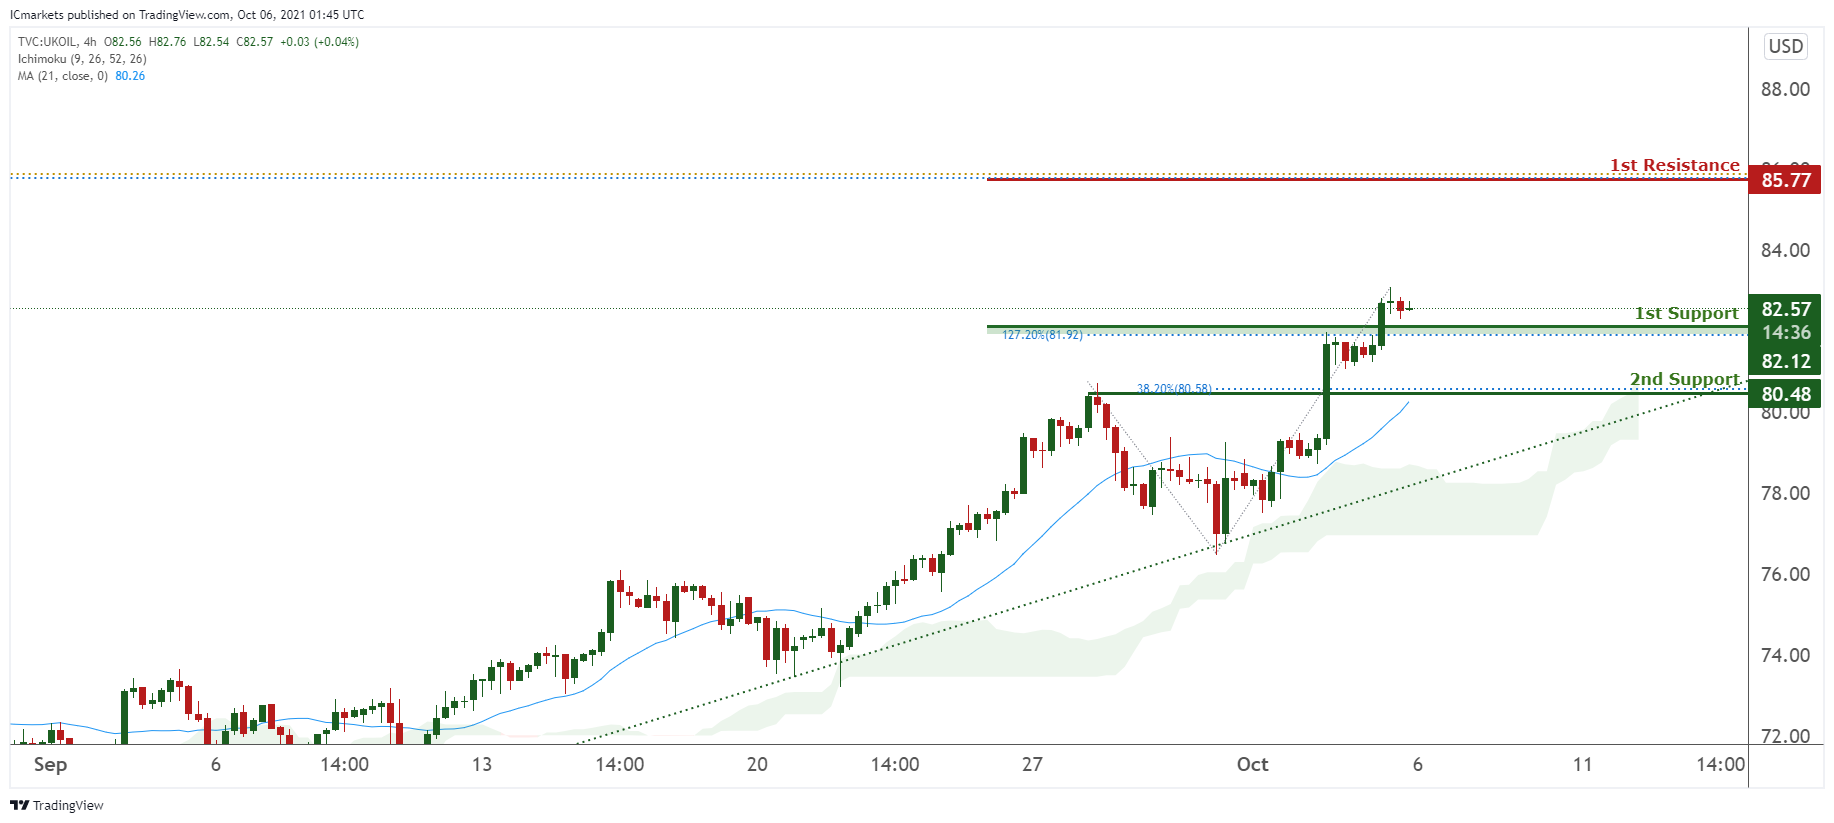
OIL:
On the H4 timeframe, price is still trading above the moving average which is indicating further bullish movement. Supported by the fact that price is above the ichimoku indicator, we are expecting that price bounces off 1st support at 82.68 in line with the 127.2% Fibonacci retracement back to 1st resistance at 85.77. Otherwise, breaking 1st support, we will see price head towards 2nd support at 82.12 in line with 38.2% Fibonacci retracament.
Areas of consideration:
- H4 time frame, 1st resistance of 85.77
- H4 time frame, 1st support of 82.68
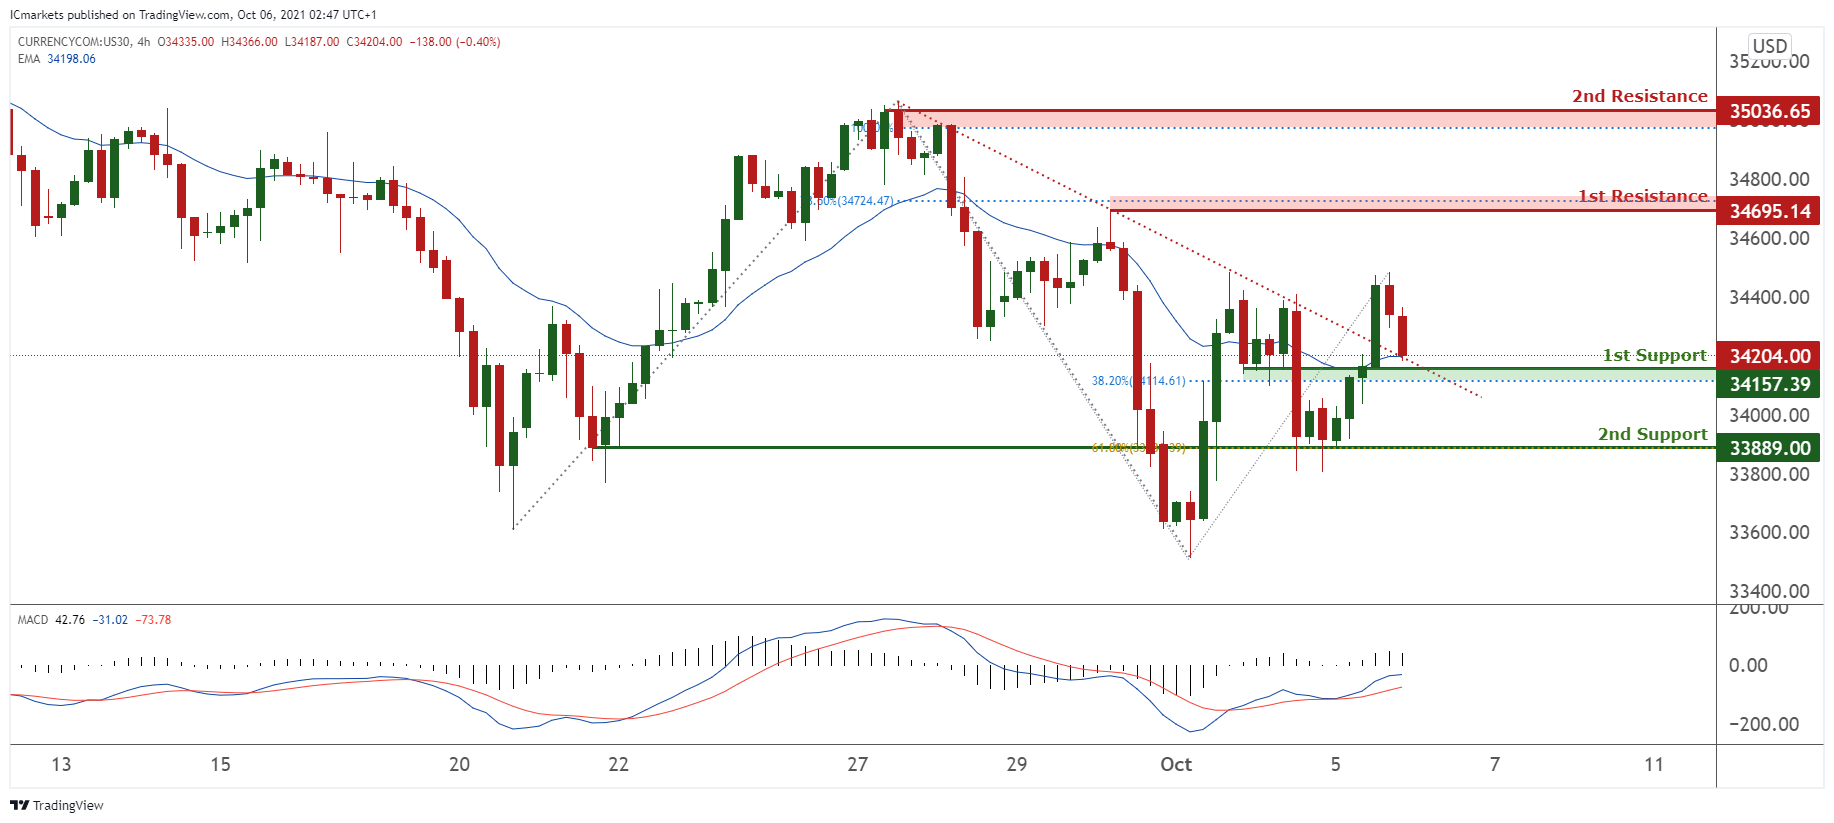
Dow Jones Industrial Average:
On the H4, we may expect to see a short term bullish move to 1st resistance at 34695 in line with the 78.6% Fibonacci retracement with recent price closing above the moving average. If price breaks 1st resistance, we may see further bullish moves to second resistance at 35037 in line with the 100% Fibonacci projection as a potential upside target. Otherwise, breaking 1st support at 34157 in line with the 38.2% Fibonacci retracement, will see price rise towards 2nd support at 33889 in line with the 61.8% Fibonacci retracement.
Areas of consideration:
- 4H resistance at 34695
- 4H support at 34157
The accuracy, completeness and timeliness of the information contained on this site cannot be guaranteed. IC Markets does not warranty, guarantee or make any representations, or assume any liability regarding financial results based on the use of the information in the site.
News, views, opinions, recommendations and other information obtained from sources outside of www.icmarkets.com.au, used in this site are believed to be reliable, but we cannot guarantee their accuracy or completeness. All such information is subject to change at any time without notice. IC Markets assumes no responsibility for the content of any linked site.
The fact that such links may exist does not indicate approval or endorsement of any material contained on any linked site. IC Markets is not liable for any harm caused by the transmission, through accessing the services or information on this site, of a computer virus, or other computer code or programming device that might be used to access, delete, damage, disable, disrupt or otherwise impede in any manner, the operation of the site or of any user’s software, hardware, data or property.


