
EUR/USD:
In recent sessions, market participants witnessed the EUR/USD’s advance run into headwinds as Eurozone inflation cooled according to latest CPI data, boosting speculation the European Central Bank may deliver a dovish statement and press conference Thursday.
The US dollar index, or DXY, entered a somewhat choppy state Tuesday after a slate of Fed speak, consequently extending Monday’s Bullard-induced losses.
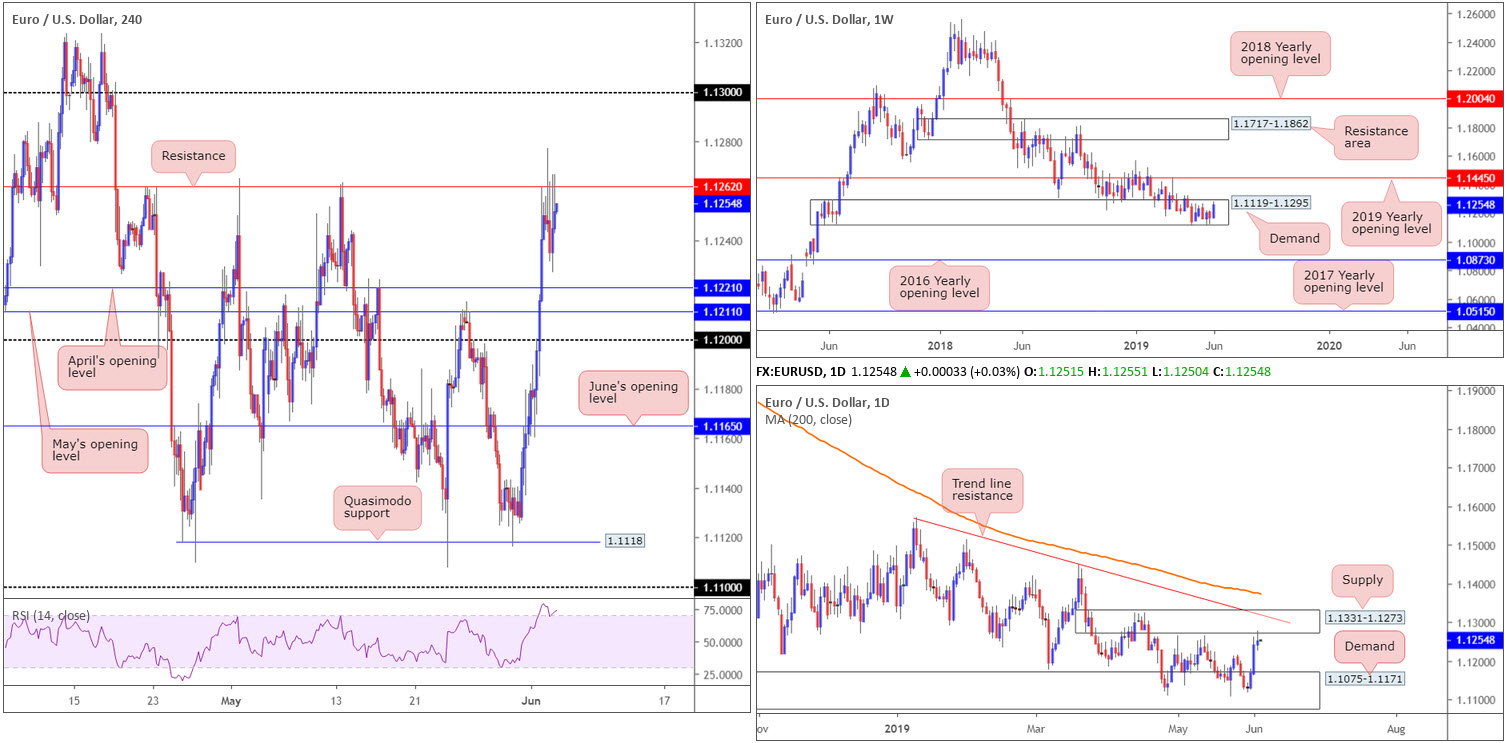
On the technical side of things, weekly action remains sited within a long-standing demand zone at 1.1119-1.1295. Upside from this point shows room for extension to as far north as the 2019 yearly opening level at 1.1445. Despite a positive start to June, however, traders may still want to acknowledge the overall trend remains facing a southerly bearing since topping in early 2018.
Daily supply at 1.1331-1.1273 elbowed its way into the spotlight yesterday, following a modest run from daily demand at 1.1075-1.1171 (glued to the underside of the current weekly demand). Note within the supply we have a daily trend line resistance extended from the high 1.1569.
A closer reading of price action on the H4 timeframe reveals resistance at 1.1262 capped upside Tuesday, in spite of price action clocking a session high of 1.1277. Beyond this region, the research team notes limited resistance until shaking hands with the 1.13 neighbourhood, whereas continued rejection off 1.1262 may witness a pullback to April’s opening level plotted at 1.1221, shadowed closely by May’s opening level at 1.1211. Indicator-based traders may also wish to acknowledge the RSI is currently testing overbought waters.
Areas of consideration:
Despite EUR/USD bulls attempting to make a stance from weekly demand at 1.1119-1.1295, daily supply at 1.1331-1.1273, along with its associated trend line resistance, may hamper upside. In addition to this, let’s also be mindful to the fact resistance on the H4 timeframe at 1.1262 remains intact.
With the above in mind, and taking into account the overall trend points in a southerly direction, sellers may have the upper hand.
Two points of interest today for potential shorts:
- H4 resistance at 1.1262, targeting a move towards May and April’s opening levels at 1.1211/1.1221.
- The round number 1.13, which is positioned closely with the daily trend line resistance highlighted above. Downside targets form at 1.1262, followed by 1.1211/1.1221.
In addition to the above, a break of H4 resistance at 1.1262 could offer a short-term long position, targeting 1.13; though do recall you’d effectively be entering long into daily supply at this point.
Today’s data points: US ADP Non-Farm Employment Change; FOMC Members Clarida and Bowman Speak; US ISM Non-Manufacturing PMI.
GBP/USD:
Sterling derived additional support Tuesday on the back of comments from US President Trump, stating the UK and US may be able to forge a phenomenal trade deal. The prevalent downside USD bias also remains unabated after Powell’s speech, further bolstering the pound.
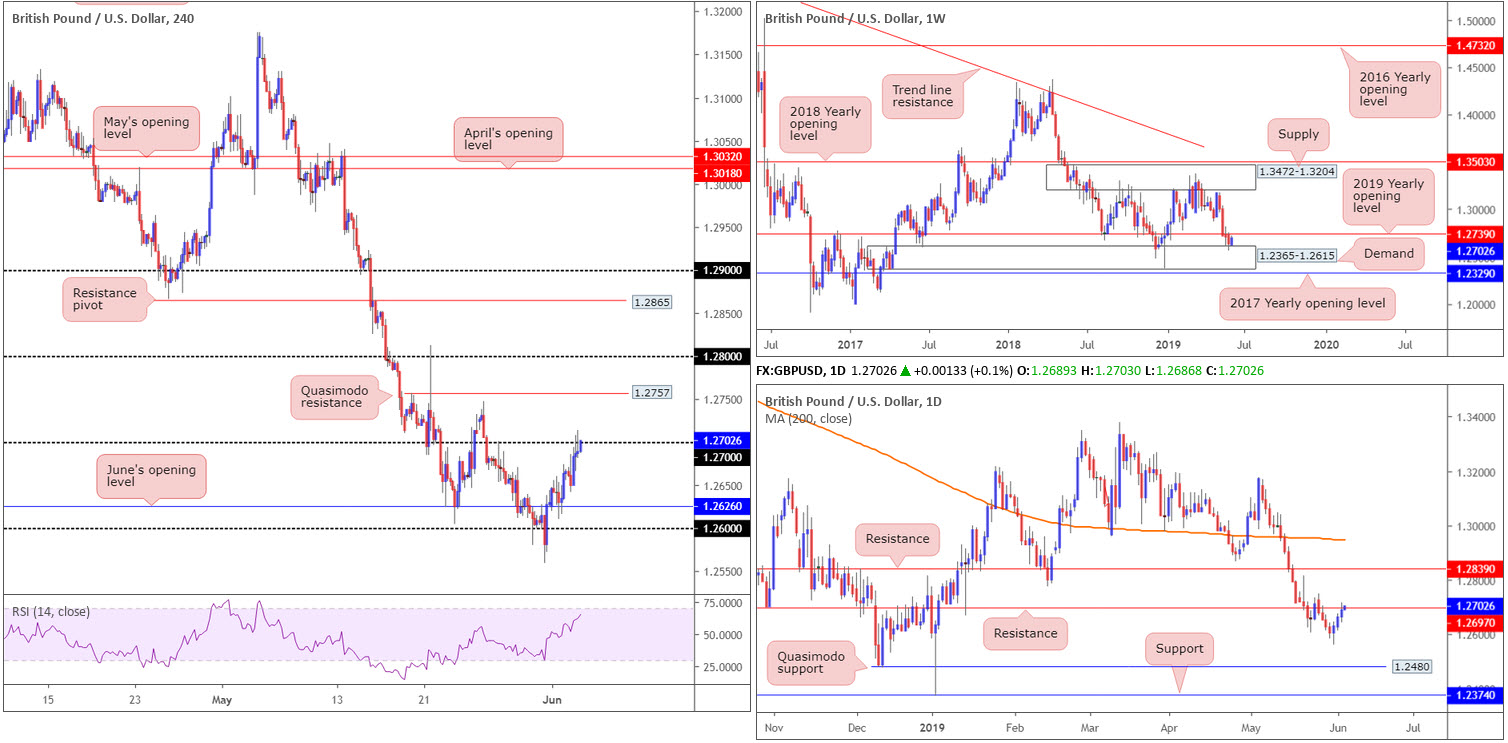
Registering its third consecutive daily gain Tuesday, the GBP/USD’s H4 candles shook hands with 1.27 into the close. As highlighted in yesterday’s briefing, daily structure also has resistance pencilled in at 1.2697.
Beyond 1.27, H4 Quasimodo resistance resides around 1.2757, which happens to be positioned just north of weekly resistance at 1.2739 by way of the 2019 yearly opening level. It might also be worth noting weekly price is seen rebounding from the top edge of demand at 1.2365-1.2615.
Areas of consideration:
Between 1.2739/1.27 is likely an area active sellers will want to make an appearance. Therefore, entering long at this point may be best avoided, according to our technical studies.
As for selling, the H4 Quasimodo resistance at 1.2757 appears to be the limit as far as upside structure goes. With that being the case, should this number enter the fold today, by way of a (optional) H4 or H1 bearish candlestick pattern (entry and risk parameters can be determined according to the selected structure), a selloff is likely to develop, targeting 1.27 as the initial port of call.
Today’s data points: MPC Member Ramsden Speaks; UK Services PMI; US ADP Non-Farm Employment Change; FOMC Members Clarida and Bowman Speak; US ISM Non-Manufacturing PMI.
AUD/USD:
The Australian dollar advanced Tuesday following the Reserve Bank of Australia (RBA) lowering its cash rate by 25 basis points to 1.25%. According to RBA Gov Lowe, the board took the decision to support employment growth and provide greater confidence inflation will be consistent with the medium-term target.
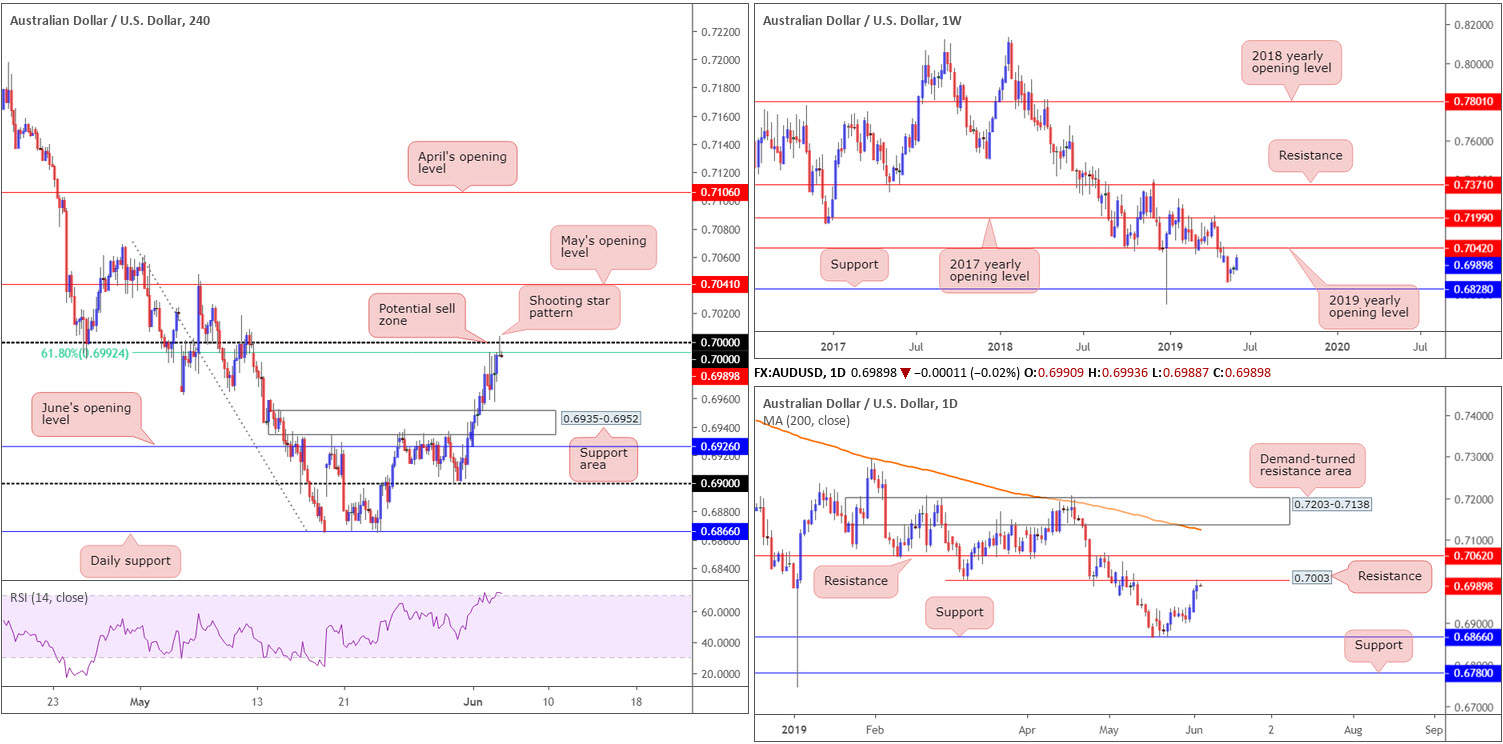
Technically speaking, the AUD/USD concluded Tuesday’s segment crossing swords with key figure 0.70 on the H4 chart, which, according to the research team, is a potential sell zone. Merging closely with a 61.8% H4 Fibonacci resistance value at 0.6992, chalking up a H4 shooting star pattern and aligning closely with daily resistance offering a potential ceiling close by at 0.7003, this area likely has active sellers in waiting. What’s also notable from a technical perspective is the clear-cut downtrend since early 2018 and the H4 RSI indicator visibly testing overbought waters.
The only drawback to shorting 0.70 is weekly price appears poised to drive above the psychological number and approach the 2019 yearly opening level at 0.7042.
Areas of consideration:
0.70, despite weekly price suggesting a move higher, remains a key point of interest today for shorts.
A short at current price based on the H4 shooting star formation is certainly an option, with a protective stop-loss order sited a couple of points above its upper shadow. The first downside target from this point has a H4 support area in sight at 0.6935-0.6952, trailed closely by June’s opening level at 0.6926.
Today’s data points: Australia GDP q/q; US ADP Non-Farm Employment Change; FOMC Members Clarida and Bowman Speak; US ISM Non-Manufacturing PMI.
USD/JPY:
Outlook unchanged.
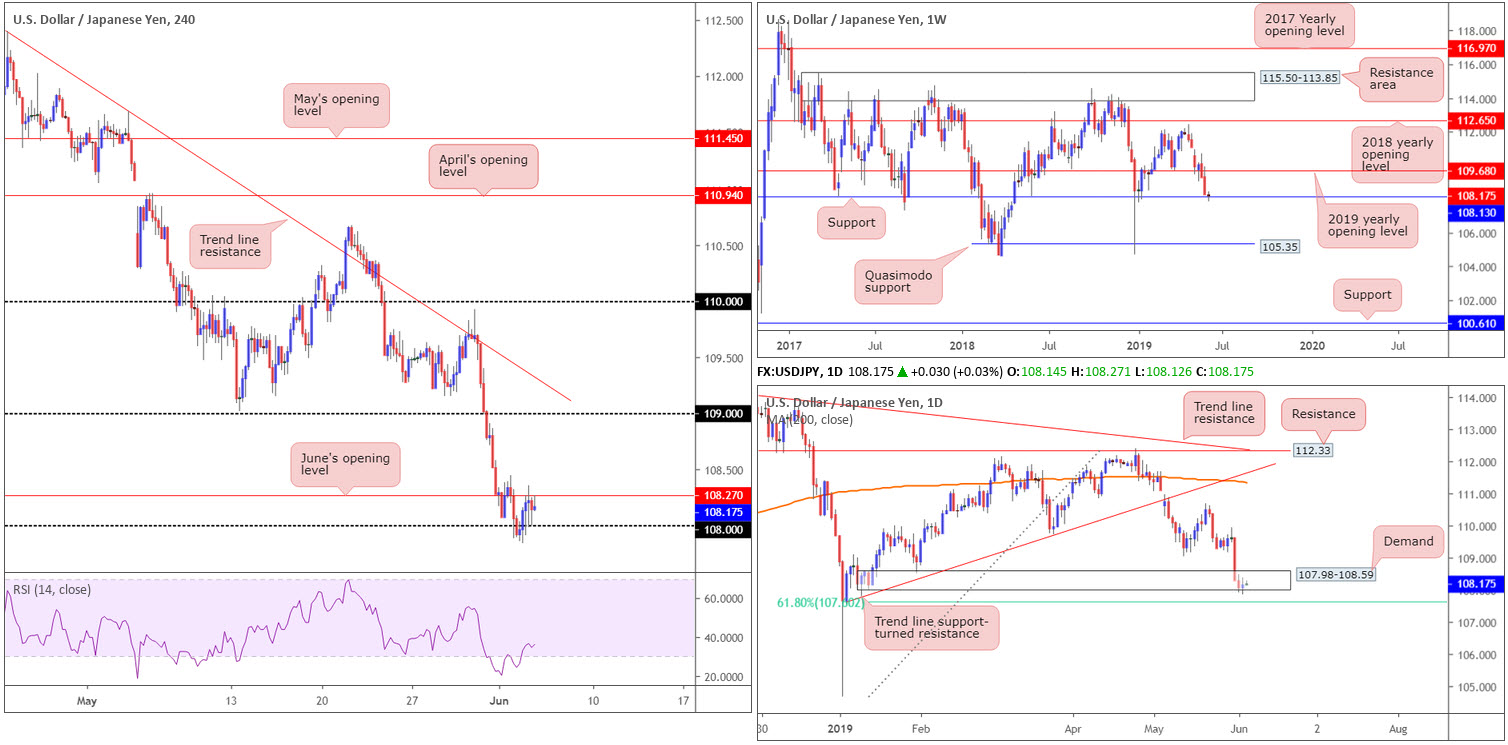
USD/JPY action managed to eke out a 0.08% gain Tuesday, amid subdued movement between June’s opening level at 108.27 and the round number 108 on the H4 timeframe. Bolstered by a recovery in the 10-year Treasury bond yield (3.42%), the pair struck a session high of 108.36, though struggled to maintain an upside presence amid broad-based USD weakness – DXY eyeing 97.00.
Above 108.27 on the H4 timeframe, limited resistance is visible until reaching the 109 neighbourhood, whereas a move beneath 108 appears starved of support until reaching 107.
In conjunction with H4 action, daily price recently breached the lower edge of demand at 107.98-108.59, potentially opening the gates towards a 61.8% Fibonacci support at 107.60. The story on the weekly timeframe has price trading at weekly support priced in at 108.13. Should this level give way, the river south appears ripple free until Quasimodo support at 105.35.
Areas of consideration:
A decisive H4 close formed beneath 108 today likely seals downside to at least the 61.8% daily Fibonacci support mentioned above at 107.60. The ultimate downside target can be seen on the weekly timeframe at 105.35, though traders should also expect some buying to materialise around 107 and 106.
On account of the above, a decisive H4 close beneath 108 that’s followed up with a retest, preferably by way of a H4 bearish candlestick configuration, is considered a high-probability move. Entry and risk levels can be applied according to the selected bearish candlestick pattern.
Today’s data points: US ADP Non-Farm Employment Change; FOMC Members Clarida and Bowman Speak; US ISM Non-Manufacturing PMI.
USD/CAD:
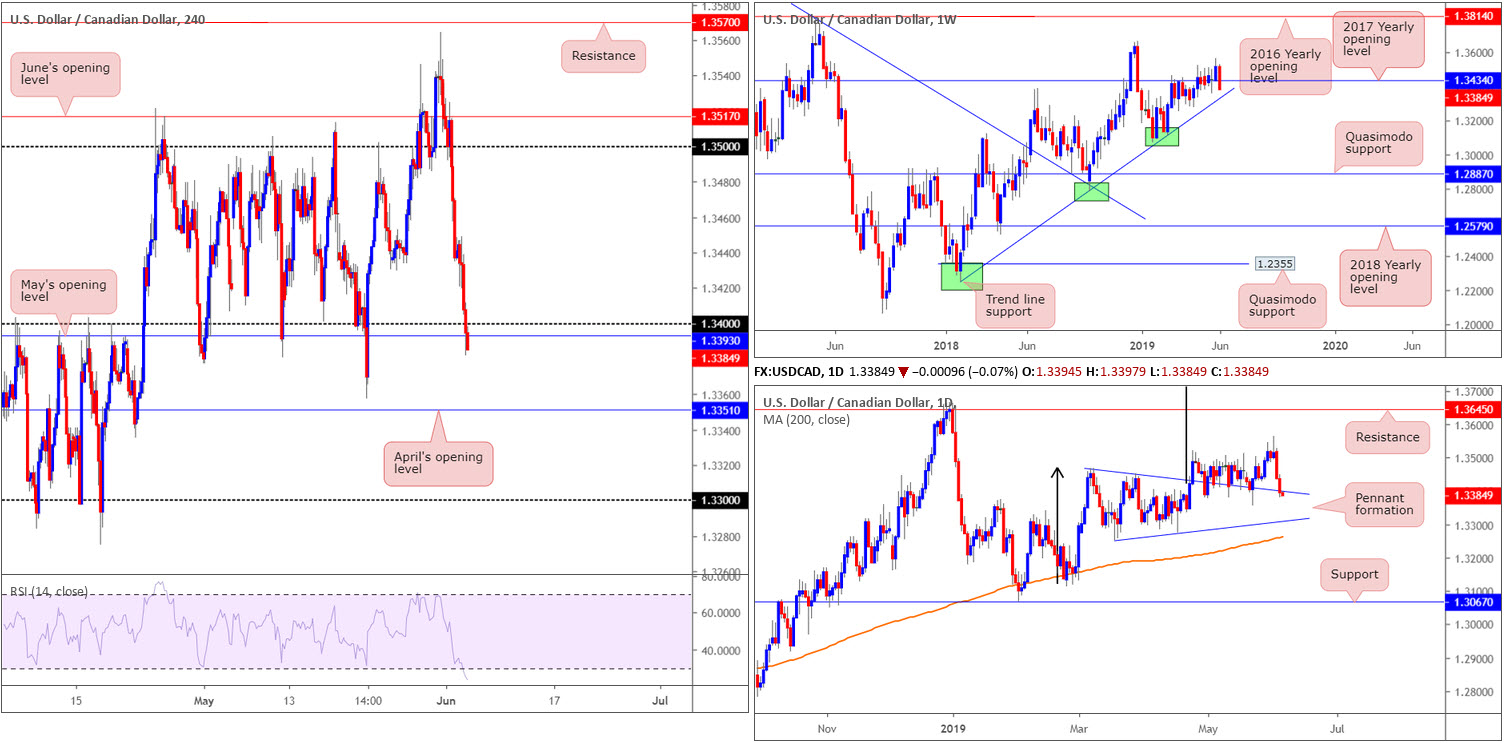
Broad-based USD weakness, along with WTI stabilising around $53.00 amid improved risk appetite on the back of Fed Chair Powell’s speech, the USD/CAD’s H4 candles recently crossed beneath 1.34 and also May’s opening level at 1.3393. Indicator-based traders may also wish to note the RSI is seen engaging with oversold territory. The next area of interest in terms of support here falls in around April’s open level at 1.3351.
Against the backdrop of H4 flow, higher-timeframe structure has weekly price eyeing a possible run towards a trend line support extended from the low 1.2247, following a break of the 2017 yearly opening level at 1.3434. Closer analysis of the daily timeframe also shows price action meandering just south of support in the form of a pennant pattern (1.3467). For the past month, price action has been feeding off this level. Assuming the barrier holds once again, the traditional price target (calculated by taking the distance from the beginning of the preceding move and adding it to the breakout price) remains on the chart at 1.3768 (black arrows), though the next upside target from a structural standpoint falls in around resistance at 1.3645.
Areas of consideration:
Short-term flow has the needle facing a southerly bearing at the moment, with 1.34 likely to serve as resistance today and support not expected to emerge until April’s opening level at 1.3351. However, selling based on this structure faces opposition from potential daily buying off its pennant formation, although the unit is seen trading marginally beyond this limit, as we write.
Supporting downside, though, is weekly structure at least until we connect with trend line support taken from the low 1.2247. Therefore, traders may wish to attempt a short should the H4 candles retest the underside of 1.34, targeting 1.3351.
Today’s data points: US ADP Non-Farm Employment Change; FOMC Members Clarida and Bowman Speak; US ISM Non-Manufacturing PMI.
USD/CHF:
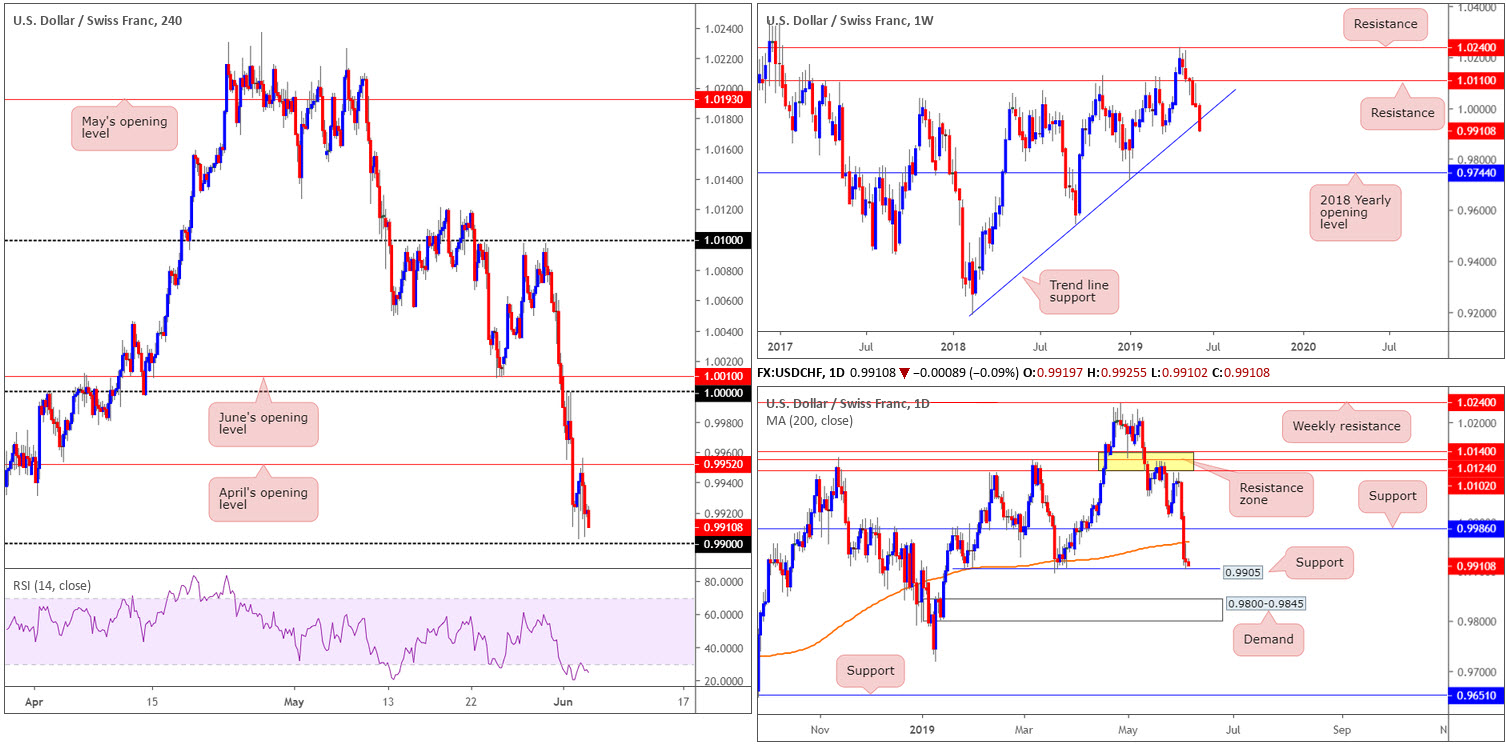
Using a top-down approach this morning, traders may wish to acknowledge the USD/CHF’s weekly candle recently overthrew notable trend line support extended from the low 0.9187. In the event price action remains beneath this boundary, longer-term action may attempt an approach towards the 2018 yearly opening level at 0.9744. Contrary to weekly activity, daily price is testing support pencilled in at 0.9905, though do remain cognisant of the 200-day SMA lurking just north, currently trading around 0.9960.
Shorter-term movement on the H4 timeframe rose to a high of 0.9956 Tuesday, largely bolstered by rising US treasury yields. Despite this, price action struggled to overcome April’s opening level at 0.9952 amid broad-based USD weakness – DXY eyeing 97.00.
Areas of consideration:
The 0.99 handle applied to the H4 chart is likely to offer some respite should it be tested today. This is largely due to its connection with daily support at 0.9905. Whether a bounce from here will amount to much, though, is difficult to decipher, given weekly price recently took out trend line support. Therefore, traders looking to fade 0.99 are urged to trade cautiously and adopt strict trade management rules.
With the above in mind, focus, according to our technical studies, is on a break of 0.99 to the downside, targeting the top edge of a daily support area at 0.9800-0.9845 (the next downside target on the daily timeframe). A break of 0.99, followed up with a retest is likely to be viewed as a high-probability shorting opportunity (entry and risk can be defined on the back of the rejection candle’s structure).
Today’s data points: US ADP Non-Farm Employment Change; FOMC Members Clarida and Bowman Speak; US ISM Non-Manufacturing PMI.
Dow Jones Industrial Average:
US equities marched sharply higher in afternoon trading Tuesday following the head of the Federal Reserve signalling the central bank is prepared to cut interest rates to sustain US economic growth. The Dow Jones Industrial Average added 2.06%, while the S&P 500 gained 2.14% along with the tech-heavy Nasdaq 100 advancing 2.70%.
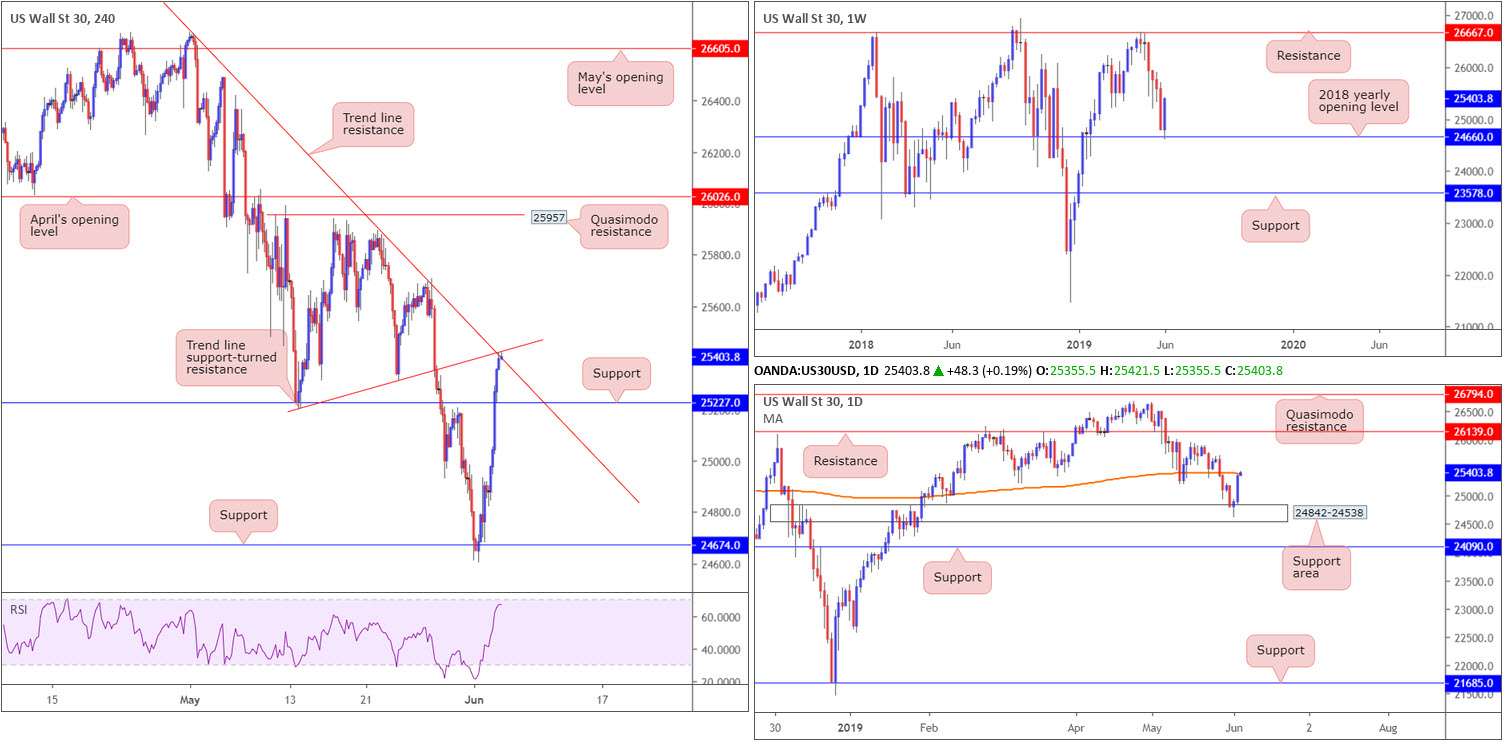
The technical view on the DJIA, however, reveals resistance emerging on the daily timeframe in the shape of a 200-day SMA. In addition to this, we can see H4 action shaking hands with trend line resistance etched from the high 26663, along with another trend line support-turned resistance taken from the low 25198. Note also the H4 RSI indicator is seen nearing its overbought value.
Although both daily and H4 price exhibit scope to rotate lower, the weekly timeframe displays room to press higher. Following its near-to-the-point reaction off the 2018 yearly opening level at 24660, the index shows room to advance as far north as resistance coming in at 26667.
Areas of consideration:
As H4 price crosses swords with two trend line resistances and daily price greets its 200-day SMA, the research team feels a reaction may be on the cards towards at least H4 support priced in at 25227. The only grumble, of course, is the fact weekly price exhibits scope to explore higher ground. For that reason, it might be worth considering holding fire and waiting and seeing if H4 price chalks up a bearish candlestick formation (entry and risk can be determined according to the candlestick’s rules of engagement) before pulling the trigger.
Today’s data points: US ADP Non-Farm Employment Change; FOMC Members Clarida and Bowman Speak; US ISM Non-Manufacturing PMI.
XAU/USD (GOLD):
Outlook unchanged.
By way of a clear-cut daily indecision candle, the price of gold entered a somewhat subdued state Tuesday. For that reason, much of the following will echo thoughts put forward in Tuesday’s brief.
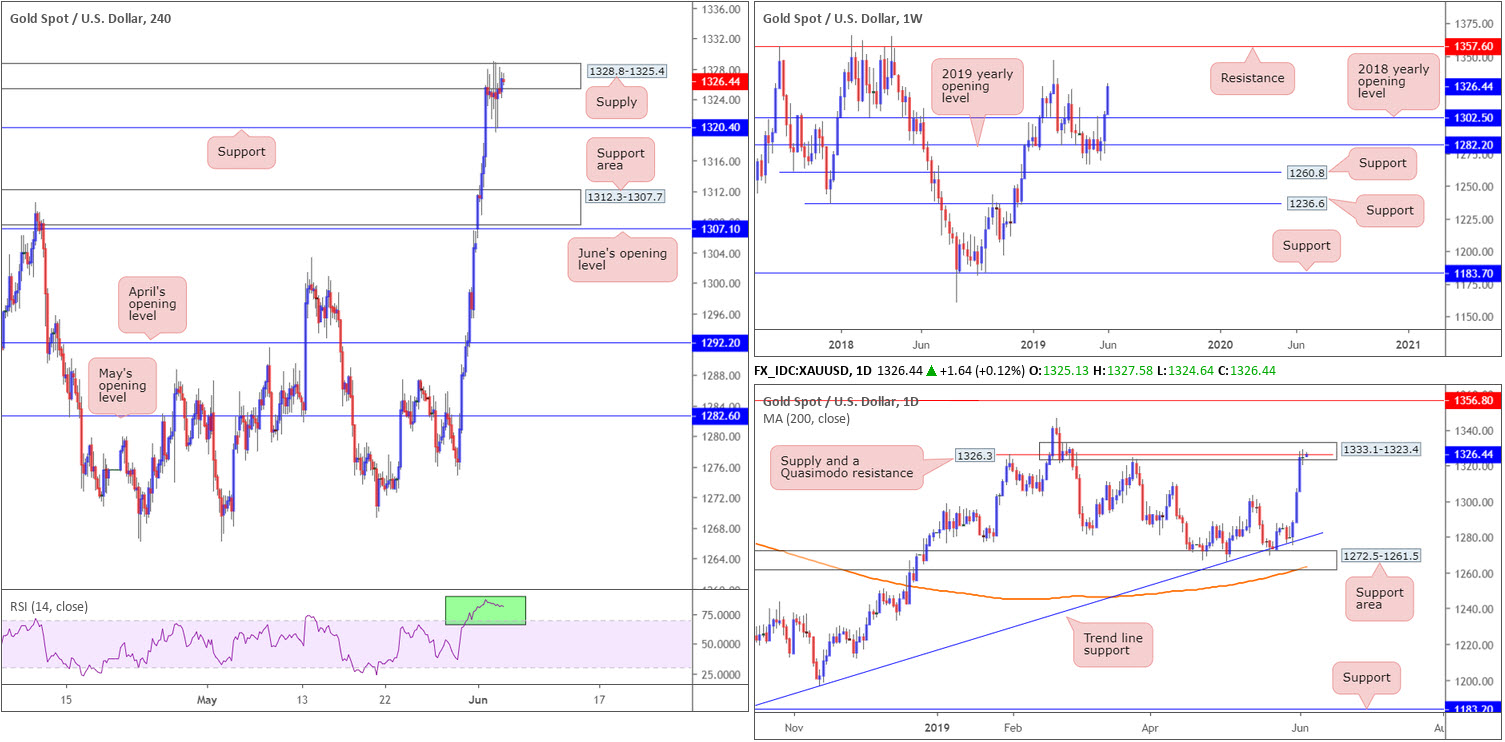
Analysing the weekly timeframe, we can still see that aside from the possibility of shorts emerging from the 1346.7 February high, limited resistance is visible above 1302.5 (the 2018 yearly opening level) until reaching 1357.6. In contrast to weekly direction, though, daily price recently crossed paths with supply at 1333.1-1323.4, which happens to align with a Quasimodo resistance at 1326.3.
Across on the H4 timeframe, we also see supply around 1328.8-1325.4 (note the top edge of this base was mildly taken out yesterday), with the next downside support target emerging from 1320.4. Beyond here, the next port of call can be seen around a support area coming in at 1312.3-1307.7. Note also the RSI indicator is seen testing waters deep within overbought territory (green).
Areas of consideration:
Having seen a daily supply enter the fight at 1333.1-1323.4, along with a daily Quasimodo resistance at 1326.3, the current H4 supply is likely to hold price action lower.
Shorting at current price, knowing the unit already tested 1320.4, is chancy, according to our technical reading. Therefore, to prove seller intent, waiting for the H4 candles to close beneath 1320.4 might be an idea worth considering. A retest to the underside of 1320.4 as resistance would, given the technical picture on the H4 and daily timeframes, be considered a high-probability setup, targeting 1312.3-1307.7 as the initial take-profit zone.
The accuracy, completeness and timeliness of the information contained on this site cannot be guaranteed. IC Markets does not warranty, guarantee or make any representations, or assume any liability with regard to financial results based on the use of the information in the site.
News, views, opinions, recommendations and other information obtained from sources outside of www.icmarkets.com.au, used in this site are believed to be reliable, but we cannot guarantee their accuracy or completeness. All such information is subject to change at any time without notice. IC Markets assumes no responsibility for the content of any linked site. The fact that such links may exist does not indicate approval or endorsement of any material contained on any linked site.
IC Markets is not liable for any harm caused by the transmission, through accessing the services or information on this site, of a computer virus, or other computer code or programming device that might be used to access, delete, damage, disable, disrupt or otherwise impede in any manner, the operation of the site or of any user’s software, hardware, data or property.


