
EUR/USD:
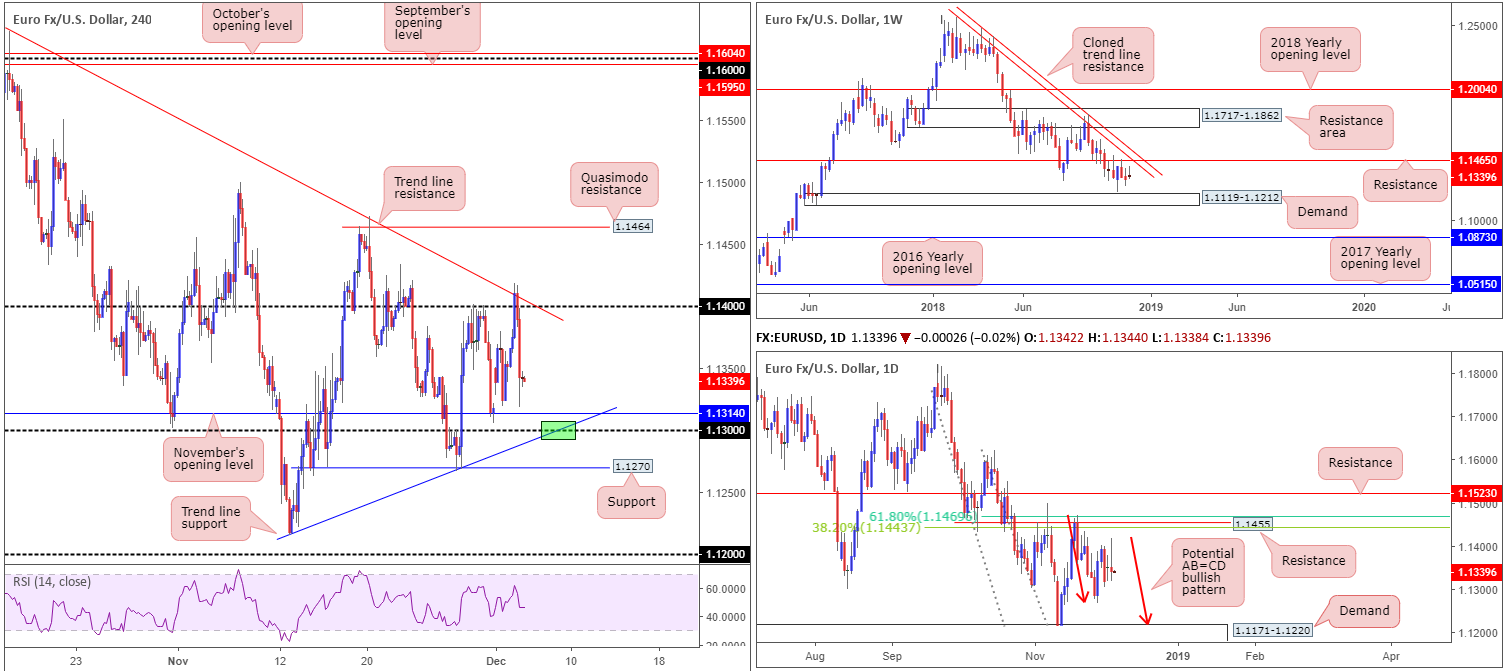
In recent sessions, traders observed the H4 candles aggressively breach 1.14 and touch gloves with a nearby trend line resistance (extended from the high 1.1621) amid early London, before just as aggressively turning lower. For folks who read Tuesday’s briefing you may recall the piece highlighting 1.14 as a potential sell zone. Well done to any of our readers who managed to jump aboard here.
Continued selling from current price will likely pull November’s opening level at 1.1314 into the frame, followed closely by 1.13 and a trend line support (etched from the low 1.1215). As a reminder, 1.13 (green) remains an area of interest for possible longs in this market.
In terms of where we stand on the higher timeframes, weekly movement continues to meander between resistance priced in at 1.1465 (brings with it a nearby cloned trend line resistance [extended from the high 1.2413]), and demand coming in at 1.1119-1.1212. Closer attention to daily structure adds the possibility of an AB=CD bullish pattern (red arrows) developing this week, terminating around the top edge of a demand drawn from 1.1171-1.1220 (glued to the top edge of the aforementioned weekly demand). If it follows the pair turns northbound prior to completing the harmonic formation, however, traders are urged to pencil in resistance at 1.1455 that merges closely with two Fibonacci resistances: a 61.8% and a 38.2% at 1.1469 and 1.1443, respectively.
Areas of consideration:
With 1.14 (on the H4) holding price action firmly lower, 1.13 is likely on the radar for many traders going forward, particularly those who are short from 1.14. With that being said, however, caution is advised. 1.13 houses limited higher-timeframe convergence and, therefore, may only produce a bounce.
For that reason, conservative traders are likely to opt to wait for additional confirmation by way of a candlestick signal. That way, traders are able to observe buyer/seller intent and also have defined levels for entry and stop-loss orders. As for take-profit targets, ultimately, we would be looking for a bounce off 1.13 to reach 1.14ish.
Today’s data points: ECB President Draghi Speaks.
GBP/USD:
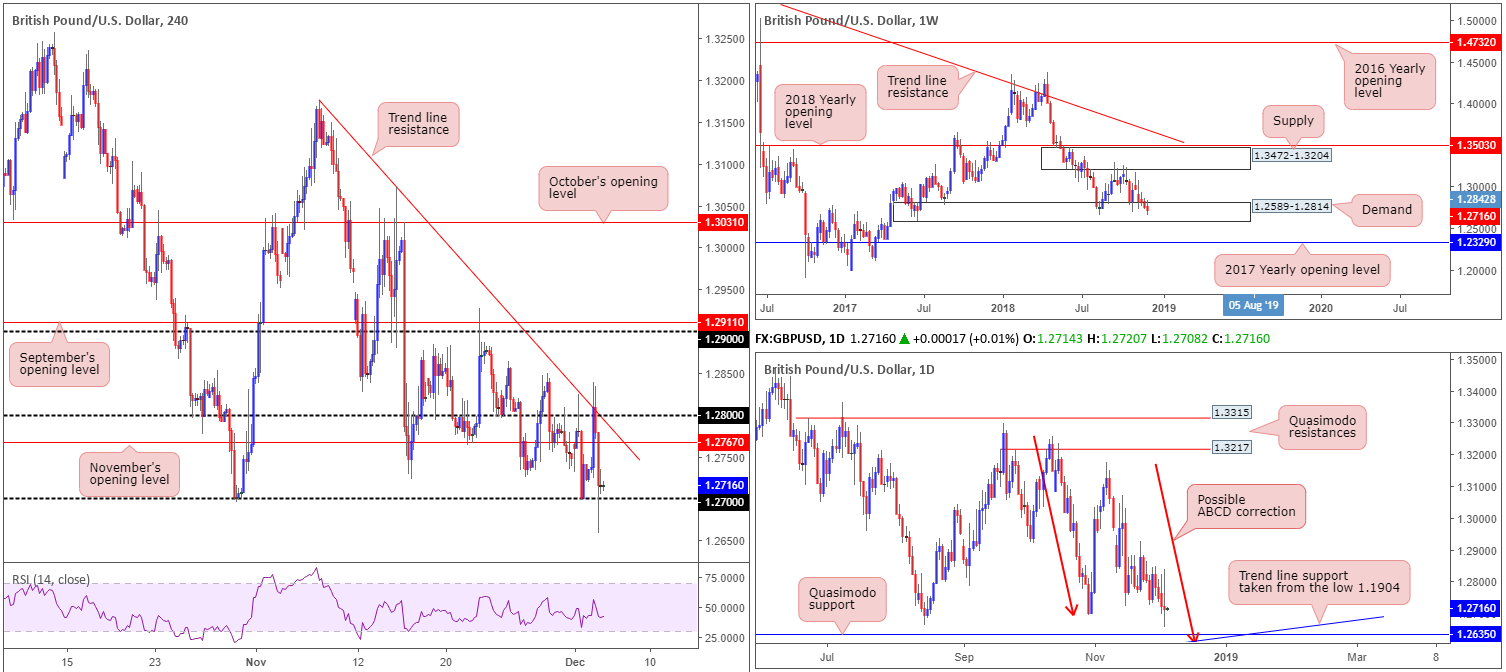
After clocking highs of 1.2839 Tuesday, the British pound was mauled on news the UK Parliament voted 311 to 293 to hold the government in contempt after it failed to release the full Brexit legal advice. The H4 candles scraped the 1.2658 level – the lowest in more than a year – though recovered amid US trade to reclaim 1.27+ status.
Stop-loss orders from traders looking to fade 1.27 were likely tripped as a result of yesterday’s move, as were breakout sellers’ sell orders. Beneath 1.27 we do not see a whole lot stopping the pair from pressing as far south as a daily Quasimodo support at 1.2635. Aside from 1.2635 fusing with trend line support (taken from the low 1.1904), the approach, should we push for lower levels, will form by way of an ABCD bullish pattern (red arrows) terminating just south at 1.2614. Although we feel a break of 1.27 is a likely move, traders may also want to take note the weekly candles remain loitering within demand at 1.2589-1.2814, though as of yet price has failed to produce anything meaningful to the upside from here.
Areas of consideration:
Ultimately we feel 1.27 will be consumed today, eventually leading to a move south towards the daily Quasimodo support mentioned above at 1.2635. A retest to the underside of 1.27 in the shape of a bearish candlestick configuration (entry/stop parameters can be defined according to this pattern) would likely be enough to justify a sell. The reason for requiring additional candle confirmation is simple. While both H4 and daily timeframes indicate a bearish presence, weekly price remains in demand, despite representing a fragile base at this time.
Today’s data points: UK Services PMI.
AUD/USD:
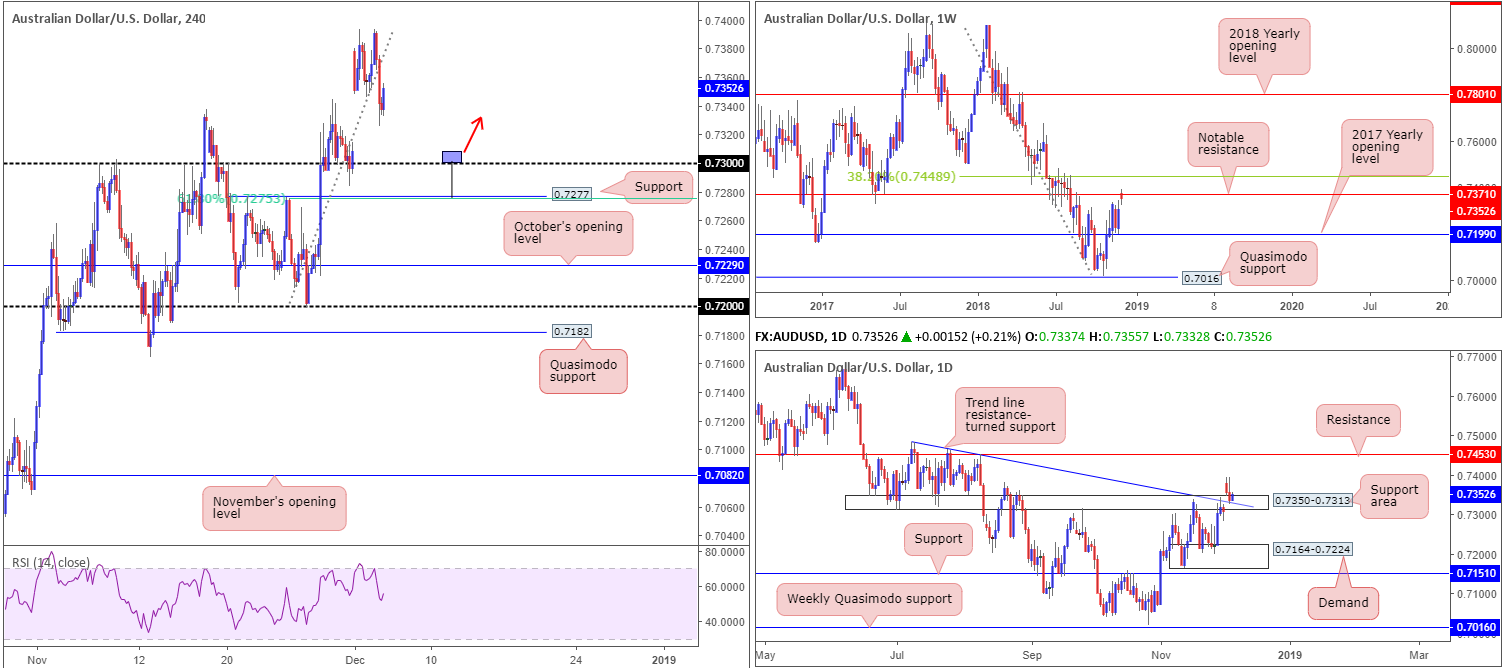
Early Asia witnessed the RBA leave its policy rate unchanged at 1.5%, as expected. This triggered demand for the Australian dollar, sending the AUD/USD to highs of 0.7394 into early London. It was from here, though, the tables turned as the US dollar found support off 96.38 (US dollar index), forcing the commodity currency to lows of 0.7326 into the closing stages of the day.
In terms of where we stand on the H4 timeframe, the 0.73 handle is the next barrier of support on the hit list, shadowed closely by support priced in at 0.7277/61.8% H4 Fibonacci support at 0.7275, though the unit is currently finding intraday support off 0.7326. A move lower would also fill the weekend gap.
Aside from a healthy US dollar, the fact weekly price is seen fading notable resistance at 0.7371 is likely contributing to downside pressure. On the other side of the spectrum, however, daily flow is seen testing the top edge of a support area coming in at 0.7350-0.7313, which happens to merge closely with a trend line resistance-turned support (extended from the high 0.7483). This, by and of itself, could be enough to hinder downside.
Areas of consideration:
Irrespective of the direction one selects, higher-timeframe structure is emphasizing a conflicting tone at the moment.
From an intraday perspective, a fakeout play through 0.73 to H4 support at 0.7277/61.8% H4 Fibonacci support at 0.7275 is of interest for a bounce higher this morning. An ideal scenario would be for H4 price to chalk up a bullish pin-bar pattern that pierces through 0.73 and tags 0.7277 (see chart for a visual – entry/stop parameters can be defined according to this pattern). As for take-profit targets, it’s a little difficult to judge given we have yet to see the approach, though 0.7340 appears a logical starting point, as of writing.
Today’s data points: Limited.
USD/JPY:
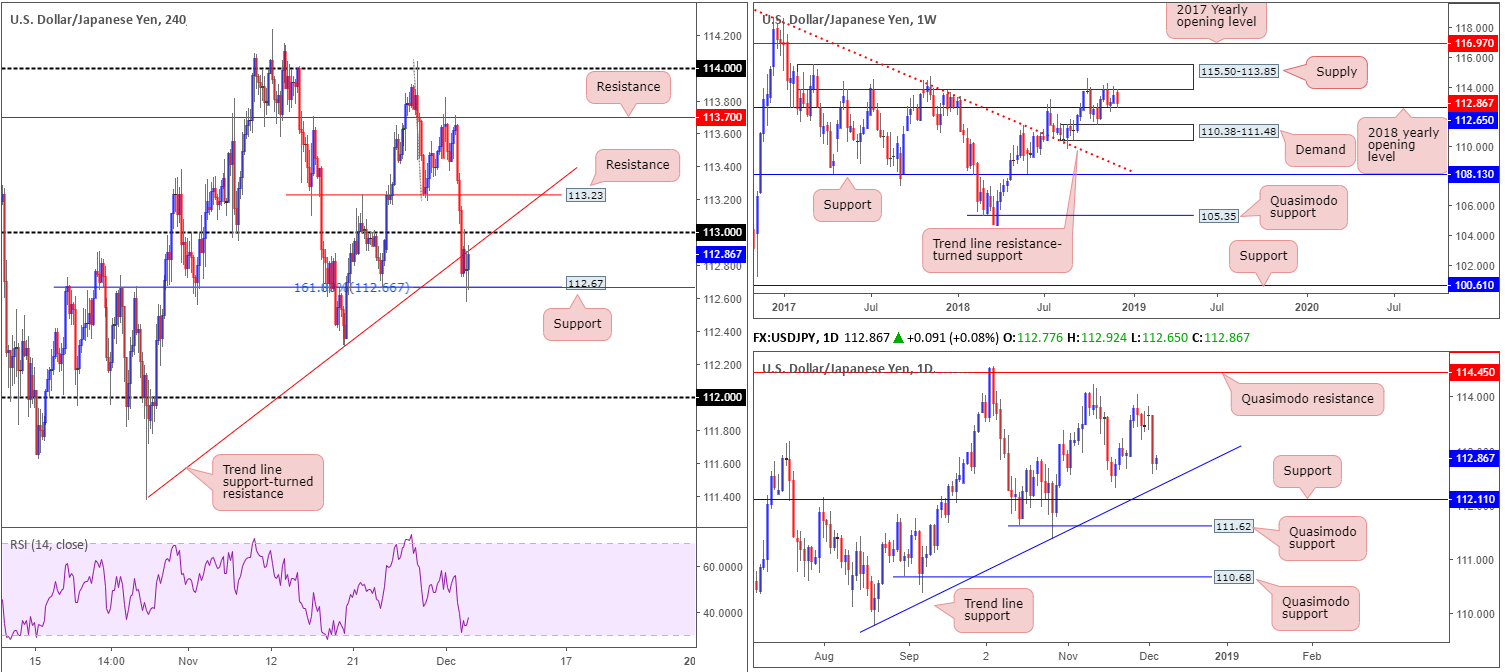
The major safe-haven Japanese currency found strong demand Tuesday amid a flight to safety. US equities recorded heavy losses and US Treasury yields also took a hit, adding weight to the USD/JPY’s recent selloff, down 0.77% by the day’s close.
The H4 candles, as you can see, violently overthrew its 113 handle amid early European hours and eventually took out trend line support (etched from the low 111.37). The day ended with the unit crossing swords with nearby H4 support at 112.67. This is an interesting base, given it merges closely with a 161.8% H4 Fibonacci extension point at 112.66 and also represents the 2018 yearly opening level at 112.65 on the weekly timeframe. As for daily action, nevertheless, further selling could be on the cards until the major tests trend line support (taken from the low 109.77).
Areas of consideration:
As of current price, the buyers and sellers are encased between the H4 support mentioned above at 112.67 (bolstered by additional support from the weekly timeframe) and H4 trend line support-turned resistance. The odds of price breaking higher from here are high given the connection with weekly support. Therefore, tread carefully should you be looking to sell this market right now.
Rather than looking to short, traders may want to consider waiting and seeing if H4 price can reclaim 113 to the upside. A H4 close above this number, followed up with a retest would, according to the weekly picture, likely be enough to draw in buyers. The first area of concern falls in at 112.23: a local H4 resistance level, followed by H4 resistance at 113.70.
Today’s data points: Limited.
USD/CAD:
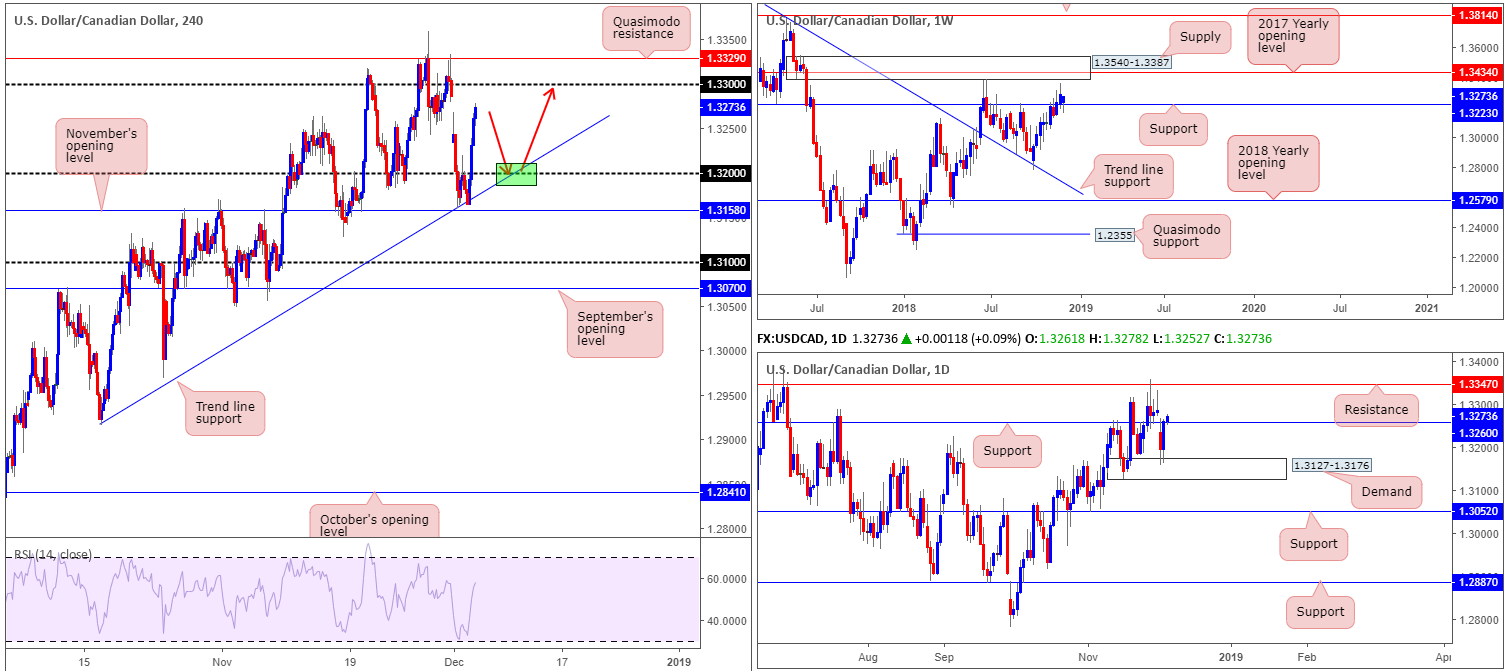
A stern USD pullback, along with crude oil prices extending losses below $53, bolstered the USD/CAD amid US hours Tuesday. Leaving November’s opening level at 1.3158 unchallenged on the H4 timeframe, price action reclaimed 1.32 to the upside. The next upside target on the H4 scale rests around 1.33, trailed closely by a Quasimodo resistance at 1.3329.
Further upside is also a possibility according to higher-timeframe structure. Weekly action is finding support off 1.3223 and displays room to advance as far north as supply coming in at 1.3540-1.3387 (houses the 2017 yearly opening level within at 1.3434). In conjunction with weekly flow, we can also observe daily price trading marginally above resistance at 1.3260 (now acting support), eyeing a potential run up to resistance at 1.3347.
Areas of consideration:
On account of the above reading, the research team have noted possible buying opportunities at 1.32 should the H4 candles pullback (red arrows) from current price. In an ideal world, testing 1.32 at the point where the H4 trend line support (extended from the low 1.2916) merges with the number would likely stack the odds in favour of a move higher. Stop-loss orders are best positioned below November’s opening level at 1.3158, with upside targets ranging from 1.33, 1.3329, 1.3347 and 1.3387.
Today’s data points: BoC Rate Statement and Overnight Rate.
USD/CHF:
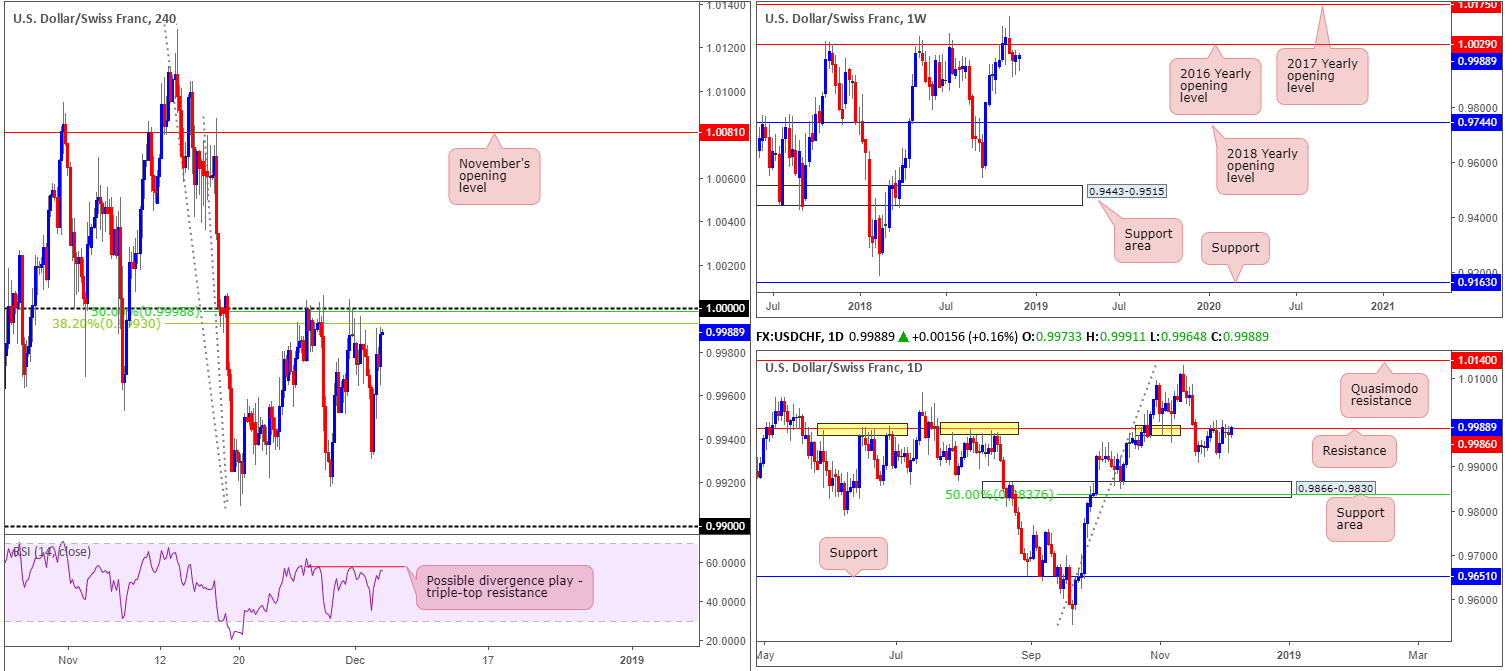
Broad-based USD buying lifted the USD/CHF to higher ground Tuesday, positioning H4 price within striking distance of 1.0000 (parity). While a key figure by and of itself, it is worth noting the number is surrounded by a 38.2% Fibonacci resistance value at 0.9993, along with a 50.0% resistance value at 0.9999. In addition to this, a potential divergence play is being seen out of the RSI indicator by way of a triple-top resistance.
Against the backdrop of H4 structure, we can also see daily resistance in play at 0.9986. The level, as you can see (yellow), boasts incredibly strong historical significance, and, therefore, has a chance of holding ground. Downside from this angle, apart from local support around 0.9920ish, seems reasonably free until a support area seen at 0.9866-0.9830 enters the fold.
The only drawback to a selloff printing from 1.0000 is the weekly timeframe showing room to potentially advance as far north as resistance plotted nearby at 1.0029 in the shape of the 2016 yearly opening level.
Areas of consideration:
Although weekly action portends higher prices, daily/H4 confluence strongly suggests a move lower is in store from 1.0000ish, targeting 0.99. Why 0.99? This is simply due to the lack of active demand present on the H4 chart. Each area has already been tested/potentially consumed.
In the event a H4 bearish candlestick configuration prints from 1.0000 today/this week (entry/stop parameters can be defined according to this pattern), this would provide a good indication a selloff is likely to take place.
Today’s data points: Limited.
Dow plunges as Tariff Man takes action It was good while it lasted. The rally Monday on the back of the respite in the China-US trade war came to a crashing halt today after President Trump raised doubts that the two countries will be able to find middle ground by the 90-day deadline they have put in place this weekend. Trump called himself the Tariff Man in a series of ambiguous tweets where he repeated the threat of raising the tariffs on China from 10% to 25% if the two countries don’t end up agreeing on trade issues within the next three months. Markets turned on full withdrawal mode
Dow Jones Industrial Average:
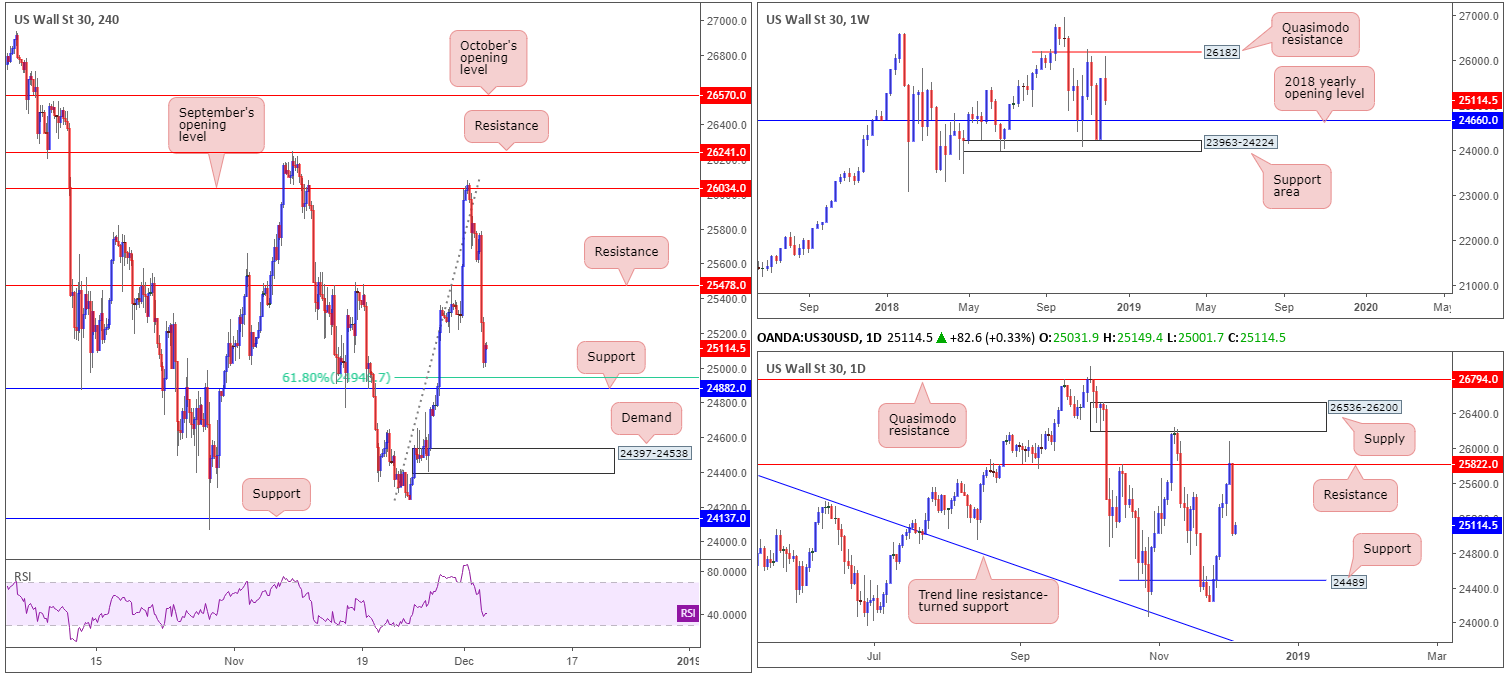
US stocks tumbled lower Tuesday as US/China trade truce optimism waned. Down in excess of 3%, the Dow Jones Industrial Average sold off from just south of a weekly Quasimodo resistance located at 26182. Further selling from current price could land the index around its 2018 yearly opening level at 24660.
Closer analysis shows daily price faded resistance priced in at 25822, and is poised to challenge support plotted at 24489. This is a support due to it being an ignored Quasimodo support and, therefore, likely holds unfilled buy orders. Note, however, this level is positioned just south of the 2018 yearly opening level mentioned above on the weekly timeframe at 24660.
The story on the H4 timeframe reveals the recent bout of selling firmly washed through orders at support drawn from 25478 (now acting resistance), and bottomed just north of support coming in at 24882. It might also be worth noting there’s a 61.8% Fibonacci support value seen just above at 24946, as well as the RSI indicator heading for oversold terrain.
Areas of consideration:
Taking all of the above on board, the H4 demand plotted at 24397-24538 is of interest for longs today/this week. Not only is the area sited just south of the 2018 yearly opening level on the weekly timeframe at 24660, it also houses the daily support at 24489. Entry around the top edge of this zone is favourable, with stop-loss orders planted a couple of points beneath its lower edge. As for an initial take-profit target, the first port of call rests at 24882ish.
Today’s data points: Limited.
XAU/USD (Gold):
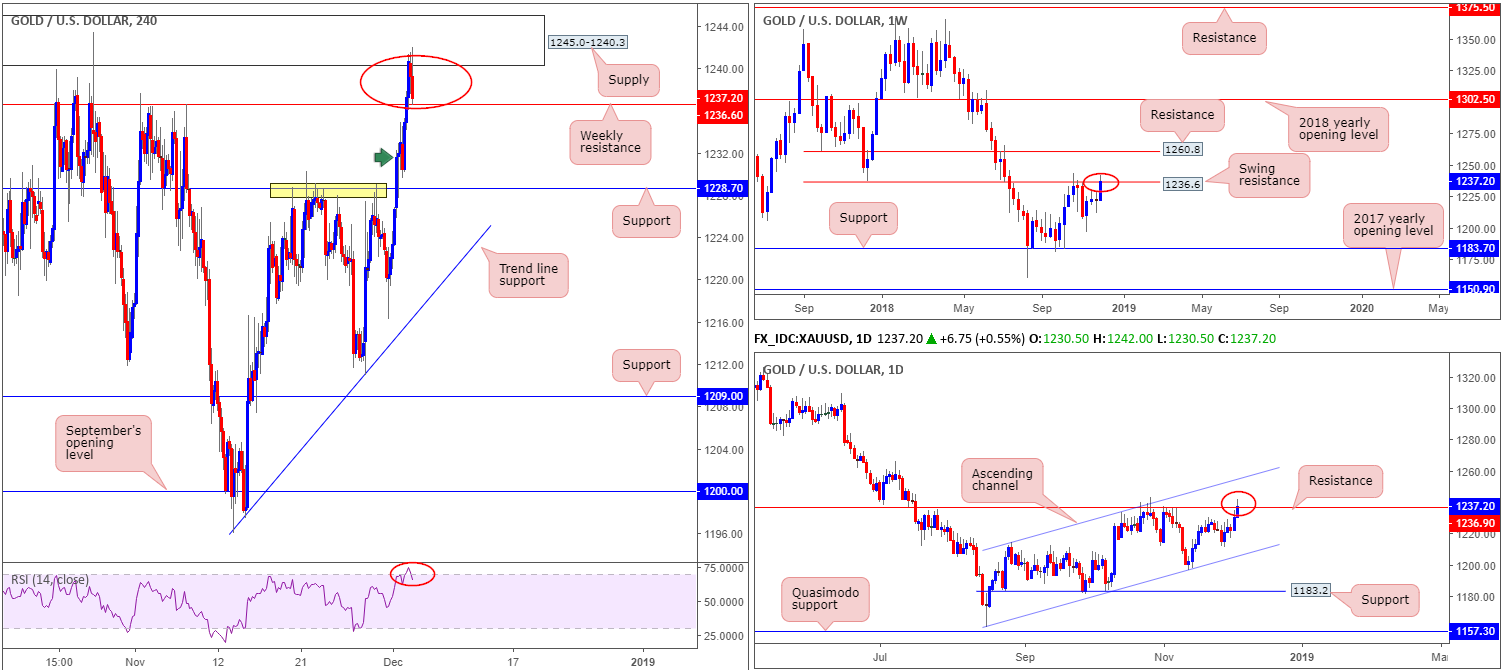
Kicking things off from the weekly timeframe this morning, the research team noted the metal recently shook hands with a key swing resistance level coming in at 1236.6. As highlighted in previous reports, this barrier remains a point of interest, having held price action firmly higher (as support) in Dec 2017 and lower in October 2018. A closer reading reveals the unit is compressing within an ascending channel formation (1160.3/1214.3), with the candles possibly working their way towards a test of resistance at 1236.9 (essentially representing the weekly swing resistance mentioned above at 1236.6).
Drawing things across to the H4 timeframe, traders may recall the team underlining a possible fakeout play through weekly resistance mentioned above at 1236.6 into H4 supply at 1245.0-1240.3. Ultimately, we were looking for a bearish pin-bar pattern to take form, though if H4 price closes back beneath the noted weekly resistance, it will have the same effect: a fakeout or stop run. It may also be worth penciling in the RSI indicator is currently testing overbought territory.
Areas of consideration:
A decisive H4 close beneath 1236.6 would, according to our technical studies, be enough to justify a sell in this market, targeting H4 support priced in at 1228.7 (stop-loss orders can be positioned above the candle’s wick). Why not the H4 demand marked with a green arrow at 1229.6-1232.8? Of course, price could respond off this zone, though the more appealing area for buyers to make an appearance is around the aforementioned support level, having seen how well it held price action lower in late Nov (yellow).
The use of the site is agreement that the site is for informational and educational purposes only and does not constitute advice in any form in the furtherance of any trade or trading decisions.
The accuracy, completeness and timeliness of the information contained on this site cannot be guaranteed. IC Markets does not warranty, guarantee or make any representations, or assume any liability with regard to financial results based on the use of the information in the site.
News, views, opinions, recommendations and other information obtained from sources outside of www.icmarkets.com.au, used in this site are believed to be reliable, but we cannot guarantee their accuracy or completeness. All such information is subject to change at any time without notice. IC Markets assumes no responsibility for the content of any linked site. The fact that such links may exist does not indicate approval or endorsement of any material contained on any linked site.
IC Markets is not liable for any harm caused by the transmission, through accessing the services or information on this site, of a computer virus, or other computer code or programming device that might be used to access, delete, damage, disable, disrupt or otherwise impede in any manner, the operation of the site or of any user’s software, hardware, data or property.


