
Key risk events today:
UK Final Services PMI; US ADP Non-Farm Employment Change; BoC Rate Statement and Overnight Rate; US ISM Non-Manufacturing PMI; Crude Oil Inventories.
(Previous analysis as well as outside sources – italics).
EUR/USD:
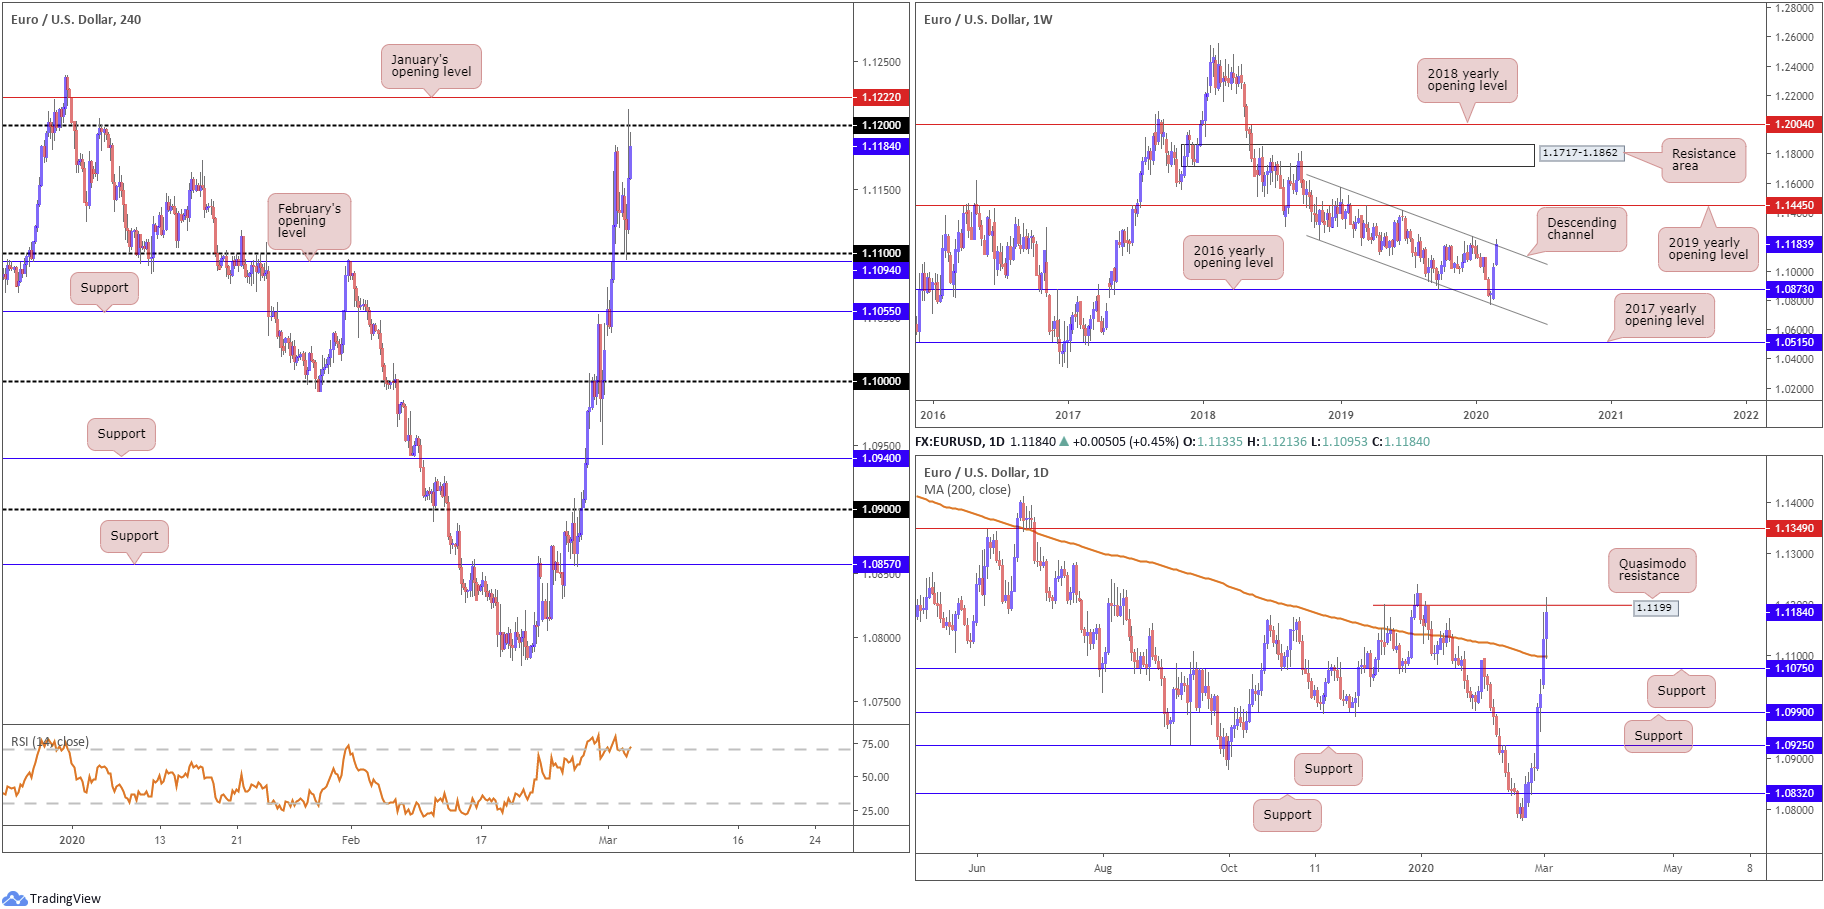
The Federal Reserve surprised markets Tuesday, slashing interest rates amid concern about the potential economic toll of the coronavirus outbreak. Following a near to-the-point retest at 1.11, reinforced closely by February’s opening level at 1.1094, H4 price gained traction, eventually grasping the underside of 1.12. Note just north of 1.12 we have possible resistance coming in at 1.1222, January’s opening level. In terms of the relative strength index (RSI), we remain circulating overbought territory, producing mild bearish divergence.
EUR/USD weekly price recently touched gloves with channel resistance, extended from the high 1.1569. This follows a stronger-than-expected rotation off channel support, taken from the low 1.1109, and sustained upside north of the 2016 yearly opening level at 1.0873.
Closer analysis of price action had daily price retest its 200-day SMA (orange – 1.1098) yesterday and make a run for Quasimodo resistance at 1.1199. Assuming continued upside, another layer of Quasimodo resistance lies around the 1.1349ish region.
Areas of consideration:
The test of 1.12 could be interesting as possible resistance, having seen daily Quasimodo resistance at 1.1199 merge with the level, the current weekly channel resistance and January’s opening level operating nearby at 1.1222. A pullback from this neighbourhood could see 1.11 brought back in view, closely shadowed by the 200-day SMA highlighted above.
Round numbers are prone to whipsaws due to the large number of orders they attract. With that being the case, conservative traders may opt to wait for additional confirmation before committing.
GBP/USD:
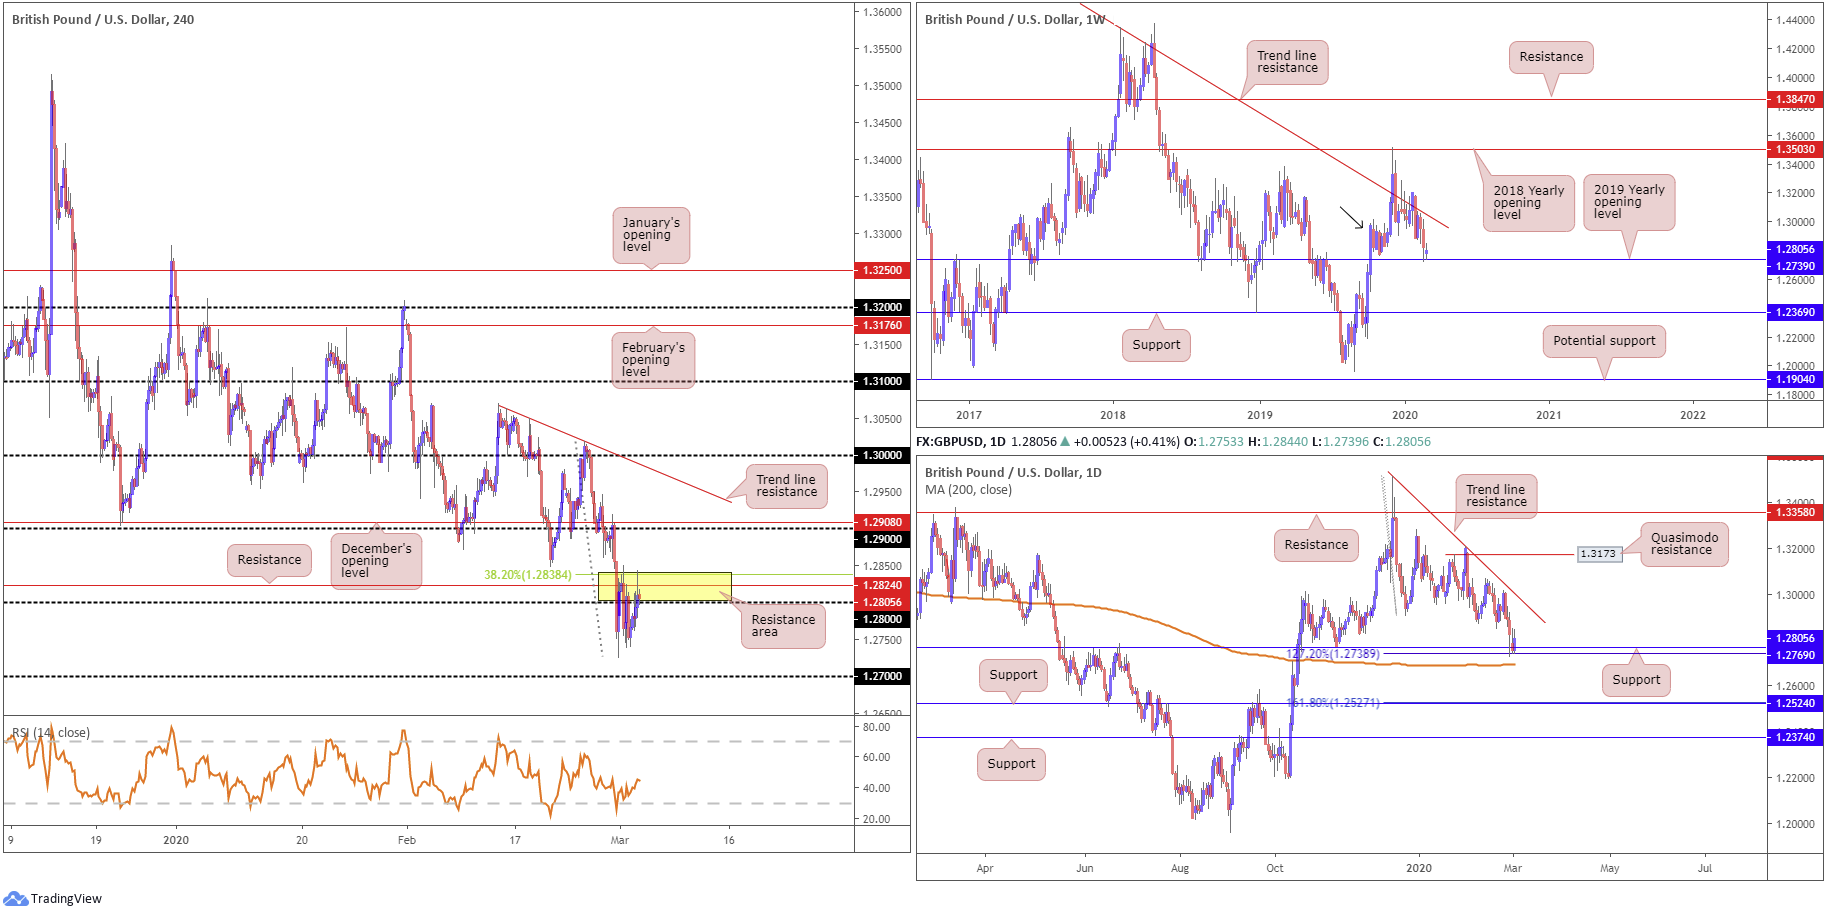
The area between the 38.2% Fibonacci retracement value at 1.2838, H4 resistance at 1.2824 and the 1.28 handle (yellow) remains a prominent zone of resistance on the H4 timeframe, despite GBP/USD firming above 1.28 after the Federal Reserve announced, in a surprise move, a 50-bps cut. This weighed on the broad dollar index, guiding the DXY to lows of 96.98, registering losses for a fourth successive session south of multi-year highs at 99.91.
Since the beginning of the year, weekly price has been languishing beneath long-standing trend line resistance, pencilled in from the high 1.5930. Last week, however, witnessed sellers strengthen their grip and connect with the 2019 yearly opening level at 1.2739, whipsawing through demand around the 1.2939 region (black arrow) and registering fresh YTD lows. A breach of the said support would side-line hopes of recovery and shine the spotlight on support from 1.2369.
In conjunction with the weekly timeframe, we can see price action on the daily timeframe ran into a particularly interesting area of support at 1.2769, a 127.2% Fibonacci extension at 1.2738 and the 200-day SMA. Note the said SMA has been flattening since mid-October 2019. Trend line resistance, extended from the high 1.3514, is next in line should we advance. Failure to hold at 1.2769, nonetheless, has support at 1.2524 to target, which happens to merge closely with a 161.8% Fibonacci extension at 1.2527.
Areas of consideration:
Regardless of the unit clocking YTD lows last week, the combined weekly and daily supports between 1.2739 and 1.2769 is potentially enough to inspire a recovery.
Traders, however, are likely waiting for a H4 close beyond the current H4 resistance area mentioned above at 1.2838/1.28 before considering upside free to 1.29ish. Of course, a break of the current H4 resistance area, followed up with a strong retest off 1.28, is likely a preferred, more conservative, scenario for entry.
AUD/USD:
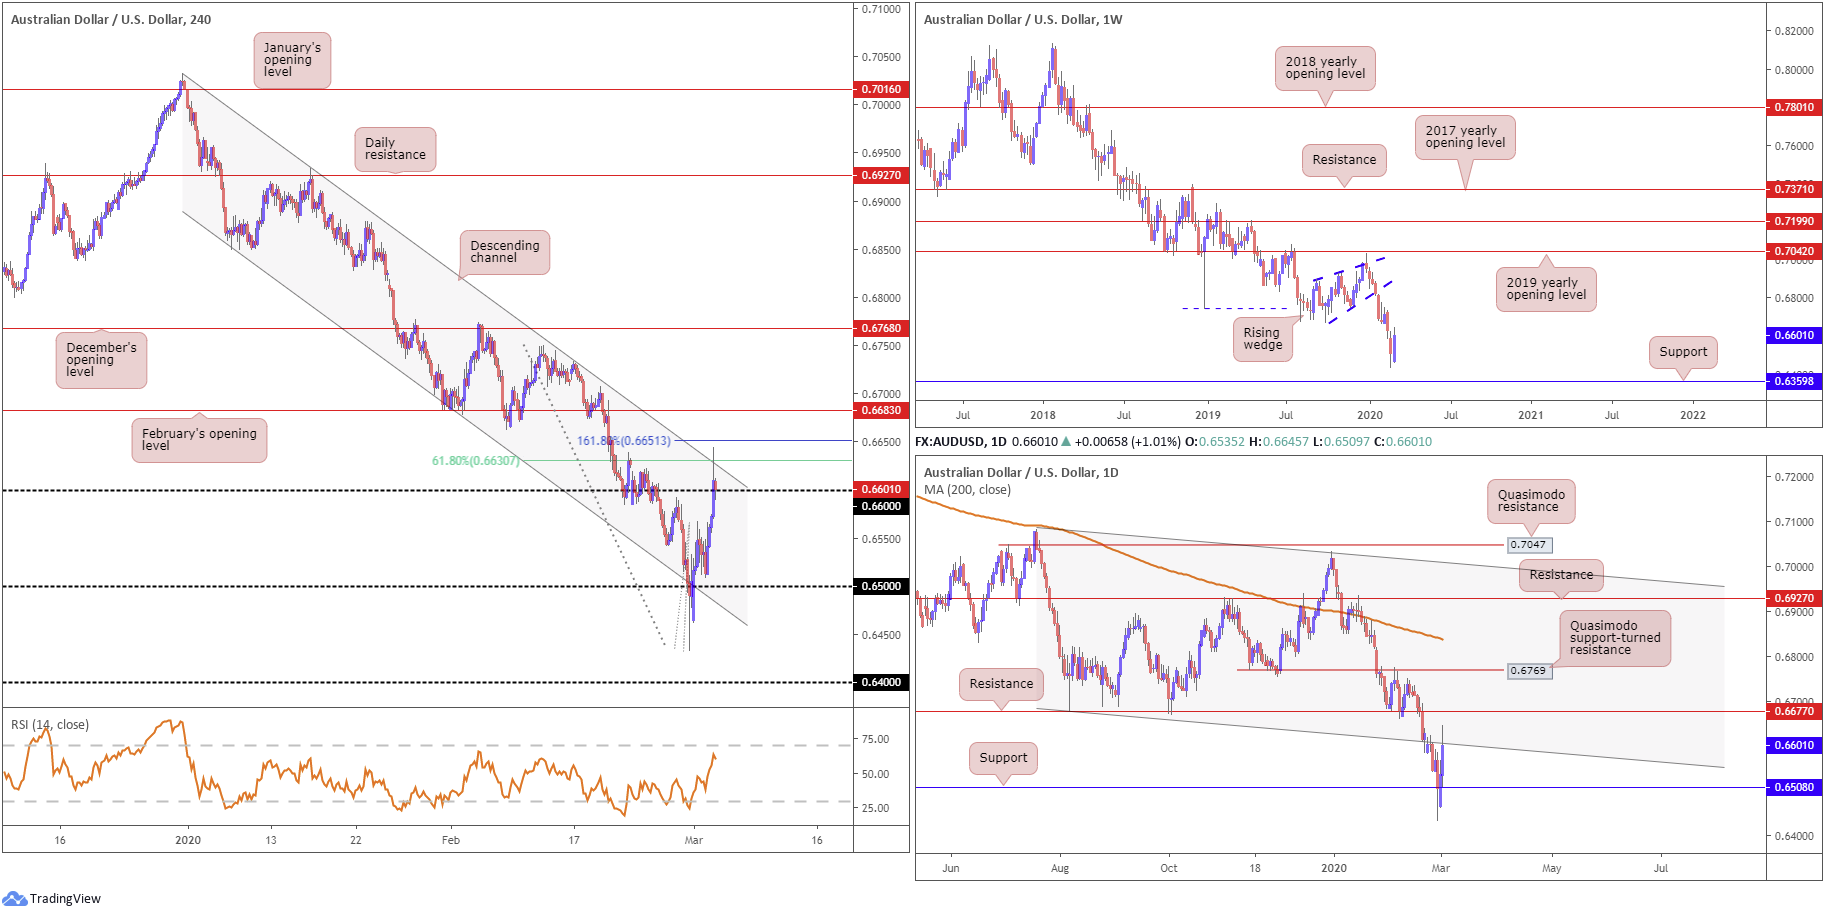
AUD/USD jumped through the 0.66 handle after the Federal Reserve stunned markets with a rate cut to fight the coronavirus. The central bank slashed interest rates by 50 bps in an unscheduled meet; the decision was unanimous.
As of current price, however, the H4 candles are attempting to regain 0.66 to the downside after fading familiar channel resistance, extended from the high 0.7031, which happens to merge closely with a 61.8% Fibonacci retracement value at 0.6630. Note just north of the said channel resistance also lies a 161.8% Fibonacci extension point at 0.6651. What’s also notable from a technical perspective on the H4 timeframe is the relative strength index (RSI) seen closing in on overbought levels.
On more of a broader perspective, daily activity recently checked in with channel support-turned resistance, taken from the low 0.6677. Surpassing this level today could lead to resistance at 0.6677 making its debut. This follows a disorderedly response from support coming in at 0.6508. Traders may find the convergence of the said daily channel resistance and the H4 resistance structures mentioned above of interest.
AUD/USD on the weekly scale still, despite recent recovery above 0.66, has eyes for support coming in at 0.6359. Eight out of nine weeks has seen the pair register losses, since topping a touch south of the 2019 yearly opening level at 0.7042, and completing a five-month rising wedge pattern. Note the primary trend has faced south since 2018, and we’re now testing decade lows in this market.
Areas of consideration:
A H4 close south of 0.66 would be an interesting scenario today, likely confirming seller intent off H4 and daily resistances, targeting daily support underlined above at 0.6508, closely trailed by the 0.65 handle on the H4 timeframe.
Conservative traders may elect to wait and see if a retest forms at the underside of 0.66 before pulling the trigger. This helps confirm seller intent. Though like everything trading, nothing is guaranteed, therefore adopting strict risk management at all times is a must.
USD/JPY:
The US dollar held onto the bulk of its daily loss against the Japanese yen Tuesday, amid global risk aversion. The surprise decision to slash interest rates by the Federal Reserve increased demand for perceived safe-haven flow, including US government bonds and the Japanese yen. Yield on the 10-year US Treasury note clocked all-time lows at 0.91%.
Monday’s analysis stated the following regarding a potential resistance zone on the H4 timeframe:
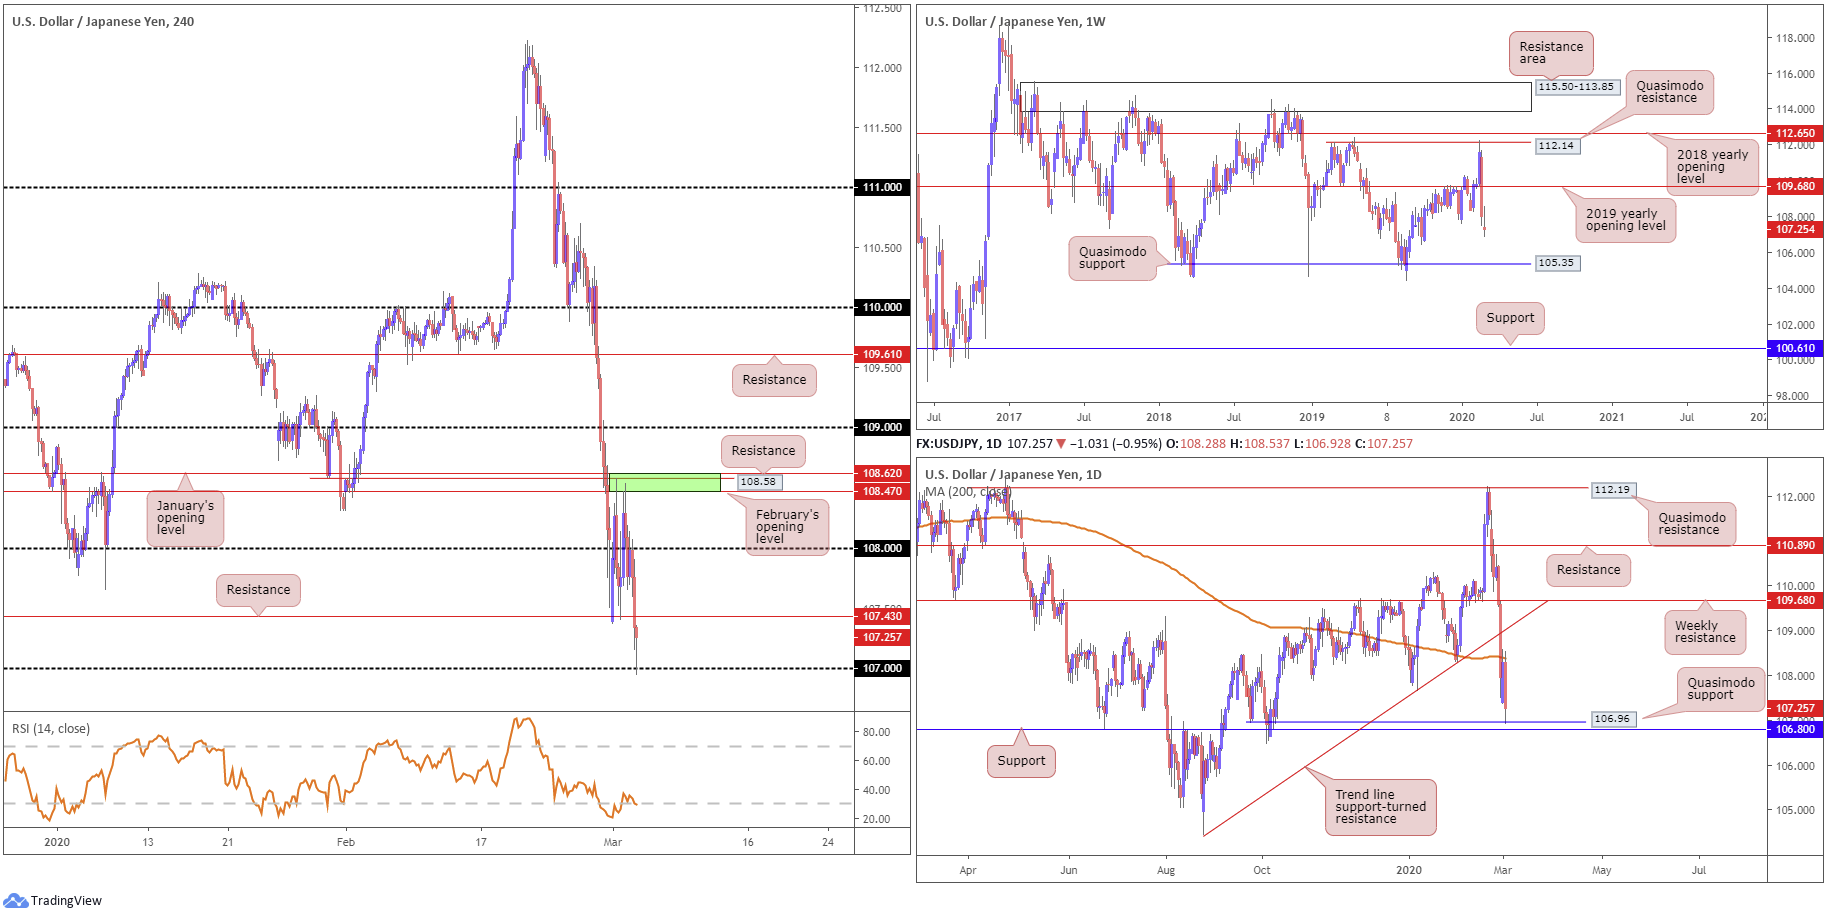
To the upside, a reasonably nice-looking area of resistance exists between 108.62/108.47 (green), comprised of January’s opening level at 108.62, resistance at 108.58 and February’s opening level at 108.47.
As evident from the charts, the said resistance zone on the H4 chart held firm, driving the H4 candles through 108 and support drawn from 107.43 until shaking hands with the 107 handle. 107.43 is likely to offer the market resistance in the event of a continued recovery from 107. With respect to the relative strength index (RSI), we are seeing mild bullish divergence within the confines of oversold levels.
Crossing into higher-timeframe view, daily price failed to sustain gains above the 200-day SMA (orange – 108.38) and tested Quasimodo support at 106.96, closely shadowed by support at 106.80. The story on the weekly timeframe had price action record its largest weekly drop since July 2016 last week. Buying in this market could position price back around the 2019 yearly opening level at 109.68, whereas the 106.48 September (2019) 30th low could be next on tap, with following support located around a Quasimodo formation off 105.35.
Areas of consideration:
The fact we have daily Quasimodo support at 106.96 in view and are rebounding from 107 on the H4 timeframe could, despite room to explore lower levels on the weekly timeframe, prompt a recovery today, with a break back above H4 resistance at 107.43 possible, towards 108.
Conservative traders will likely want to see H4 resistance taken out before considering bullish themes to 108.
USD/CAD:
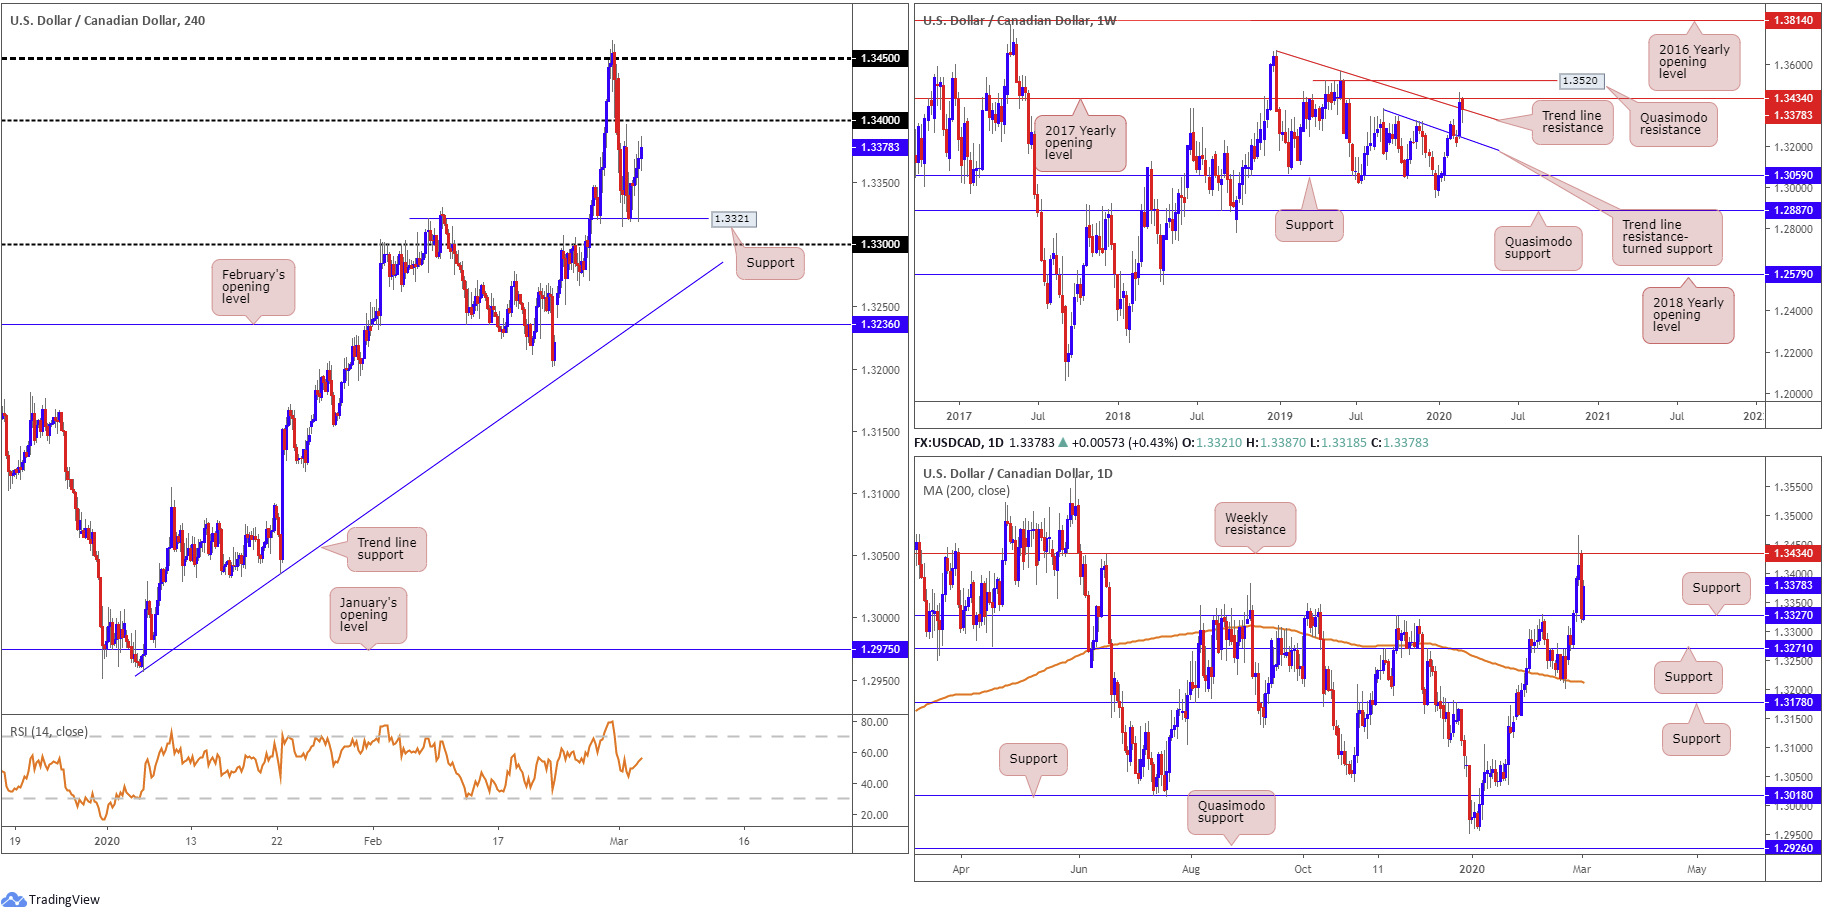
USD/CAD found itself at lows of 1.3319 after the Federal Reserve rattled markets, cutting interest rates in an unscheduled meeting in early US hours Tuesday. Support at 1.3321, a previous Quasimodo resistance level, entered the mix and capped downside. 1.34 lies up ahead, whereas failure off 1.3321 could lead to 1.33 nudging into view.
The current H4 support was bolstered by daily support noted at 1.3327, positioned just ahead of another layer of support drawn from 1.3271. Upside on this scale exhibits scope to press as far north as resistance at 1.3434, which represents the 2017 yearly opening level on the weekly timeframe. Interestingly on the weekly timeframe, we also have price marginally trading south of trend line resistance, pencilled in from the high 1.3664. As for support on the weekly timeframe, a local trend line resistance-turned support, taken from the high 1.3382, may enter view, with a break of here possibly clearing the runway to support at 1.3059.
Areas of consideration:
H4 support at 1.3321 was a noted support in previous analysis, as was the 1.33 handle.
A retest at the underside of 1.34 may be of interest to some in this market, given weekly price fading notable resistances. The threat of further buying from daily support at 1.3327, however, could discourage selling. Conservative sellers, in this case, may opt to wait and see if additional candlestick confirmation is seen before committing.
USD/CHF:
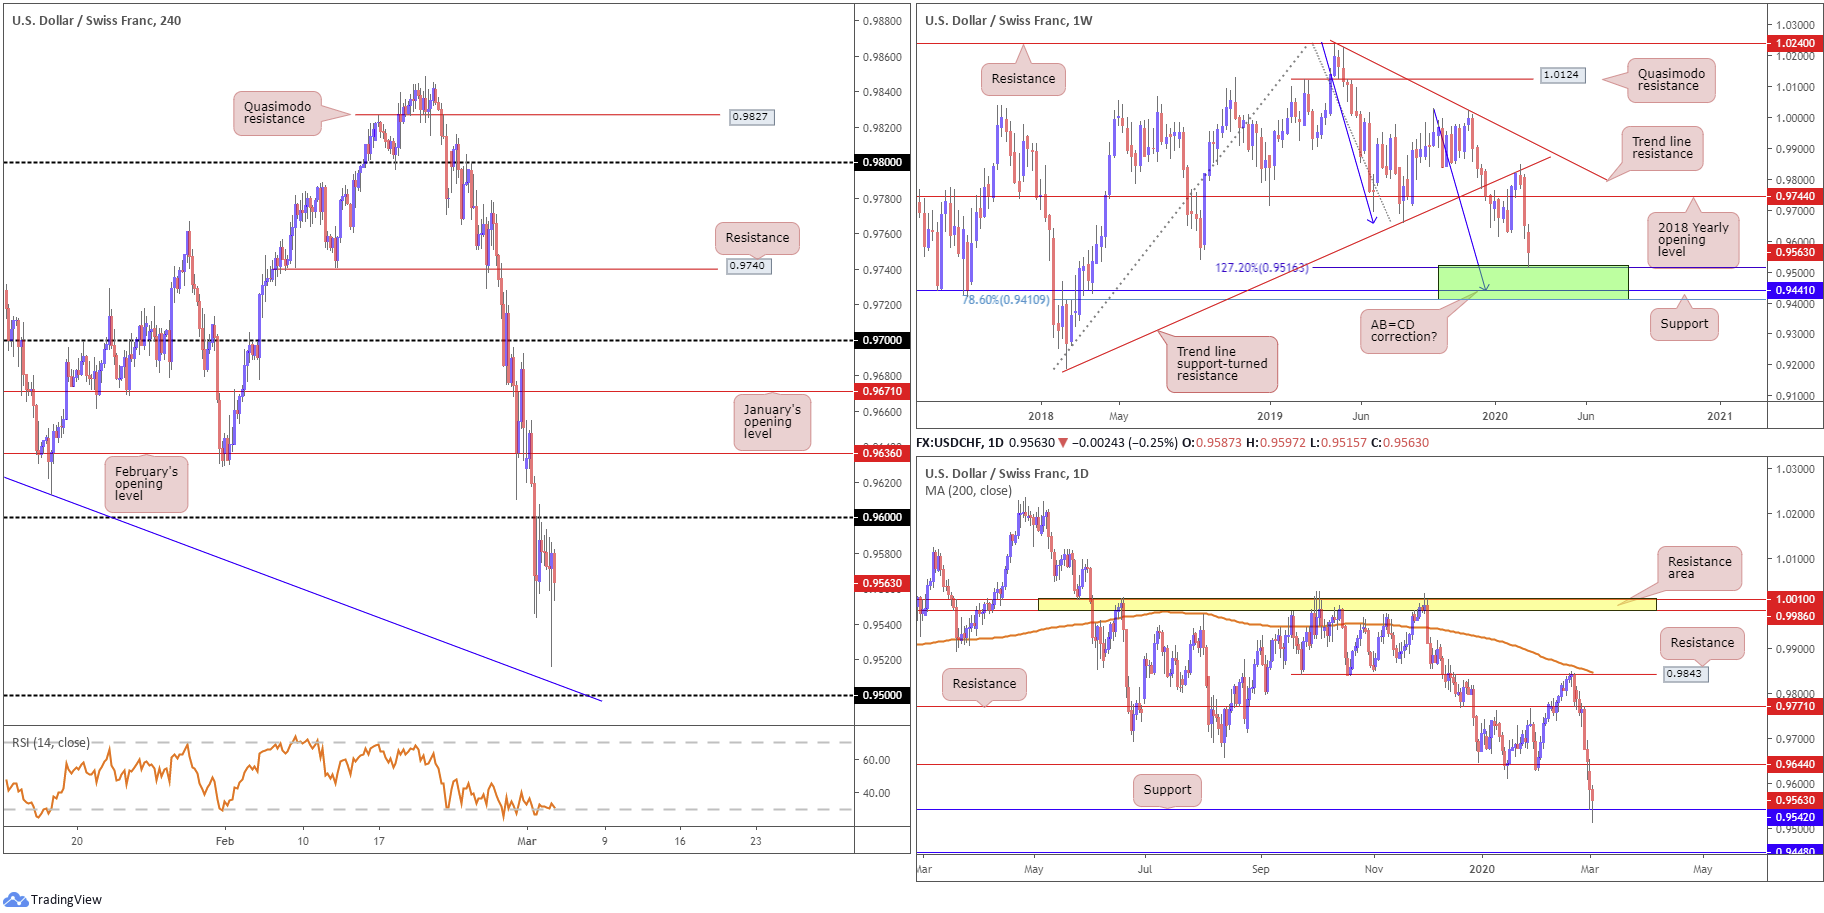
Early US hours Tuesday sparked a knee-jerk reaction to 0.9516, levels not seen since March 2018, after the Federal Reserve’s surprise decision to cut interest rates by 50 bps. Following the initial response, the unit staged a modest recovery a touch north of H4 trend line support (blue line), taken from the low 0.9646, and the round number 0.95, though failed to reconnect with 0.96. The relative strength index (RSI) remains loitering within oversold territory, unable to break 50.0.
Price action on the daily timeframe had the pair nudge through the 0.9542 September 21st low (2018) yesterday, likely running a truckload of sell stops in the process. Support at 0.9448 is in sight should we overthrow current support, while further rejection could land the market at resistance drawn from 0.9644.
0.9410/0.9516, which entered the fight yesterday, offers potential support on the weekly timeframe (green) – comprised of a 78.6% Fibonacci retracement at 0.9410, support at 0.9441 and a 127.2% AB=CD bullish correction (black arrows) at 0.9516.
Areas of consideration:
Testing the weekly support area coming in at 0.9410/0.9516, along with price action potentially running sell stops beneath the 0.9542 September 21st low (2018), could spark a recovery in this market. A break above 0.96 would help validate buyer intent. H4 resistance then resides close by at 0.9636, February’s opening level, followed by daily resistance at 0.9644 and then January’s opening level at 0.9671.
Dow Jones Industrial Average:
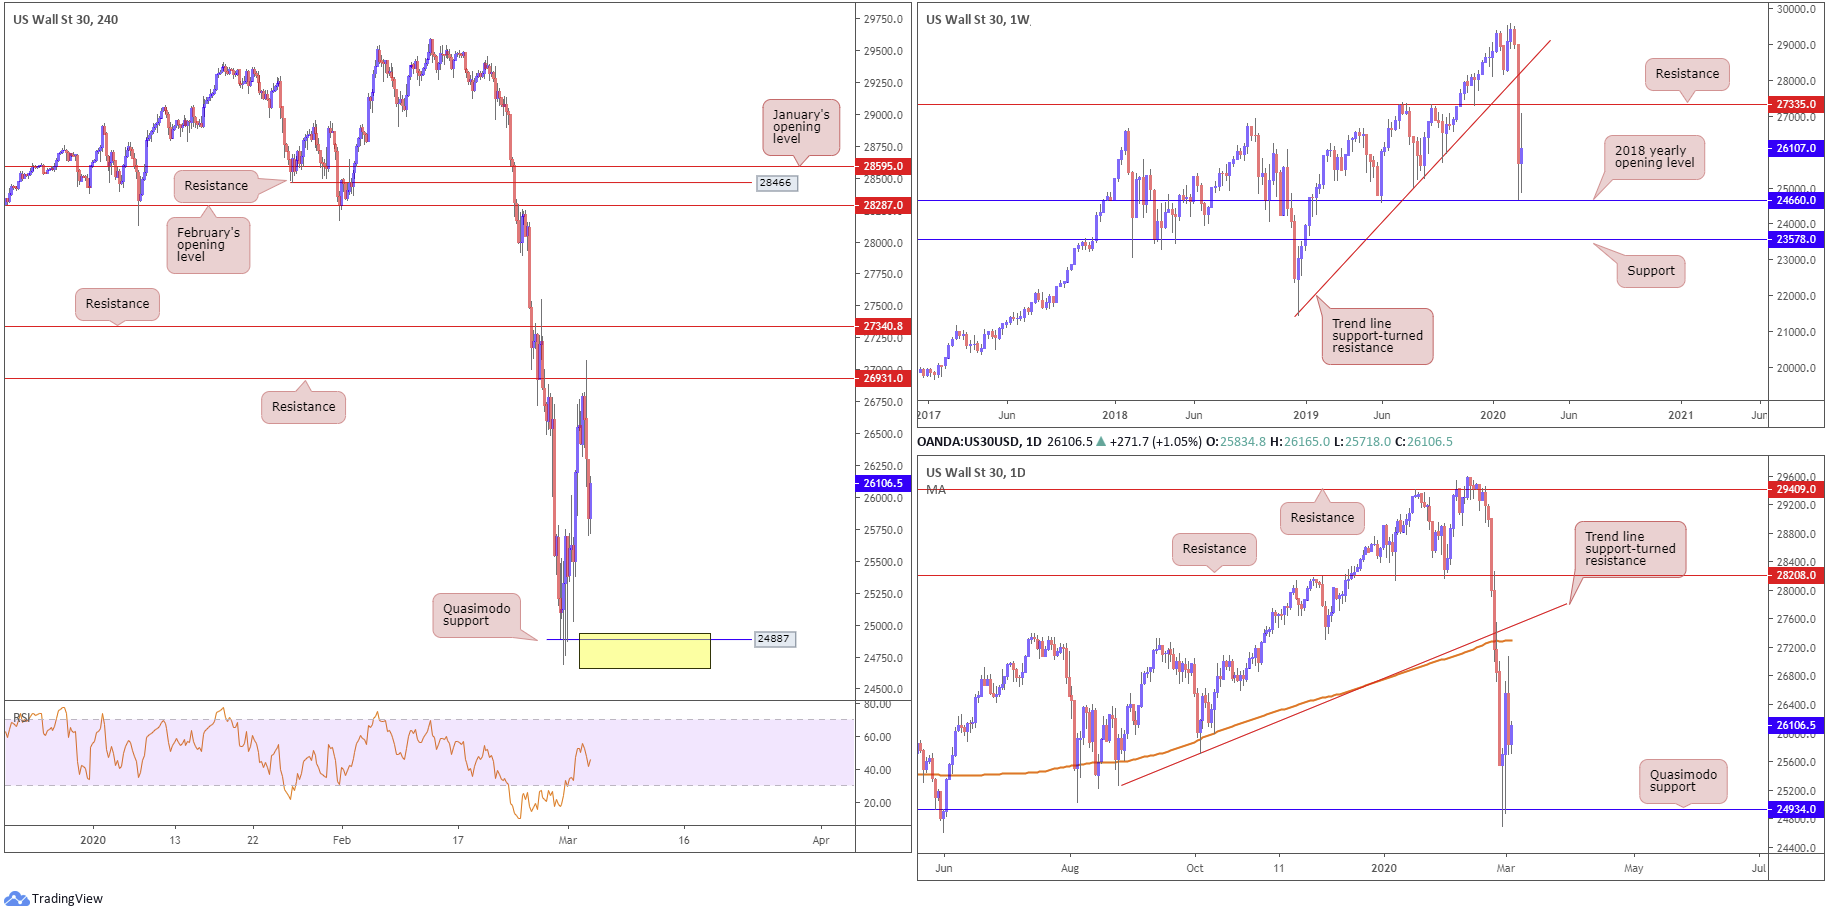
Major US benchmarks softened Tuesday, capping gains following a surprise inter-meeting interest-rate cut from the Federal Reserve. The Dow Jones Industrial Average lost 785.91 points, or 2.94%; the S&P 500 erased 86.86 points, or 2.81% and the tech-heavy Nasdaq 100 ended lower by 283.49 points, or 3.19%.
H4 resistance, a previous Quasimodo support drawn from October 30th, 2019, at 26931 plugged upside yesterday, with price retreating to lows at 25700. Quasimodo support at 24887 lies in wait in the event we continue declining today.
Broader price action has weekly flow contained between resistance at 27335 and the 2018 yearly opening level at 24660, though trading off last week’s low. Quasimodo support on the daily timeframe at 24934 remains a key level on this chart. Strong resistance on this scale is not expected to develop until reaching the 200-day SMA (orange – 27298), closely followed by trend line support-turned resistance, taken from the low 25264.
Areas of consideration:
The current H4 resistance at 26931 offers little in terms of supporting confluence, both locally and from the higher timeframes, despite holding yesterday.
The more appealing resistance on the H4 timeframe resides around 27340. Not only does it boast strong history, it converges closely with weekly resistance at 27335 and daily resistances, the 200-day SMA and the trend line support-turned resistance.
The H4 Quasimodo support at 24887 is also likely eyed by many today as a possible reversal zone, owing to higher-timeframe confluence. The yellow area denotes the 2018 yearly opening level at 24660 and daily Quasimodo support at 24934.
XAU/USD (GOLD):
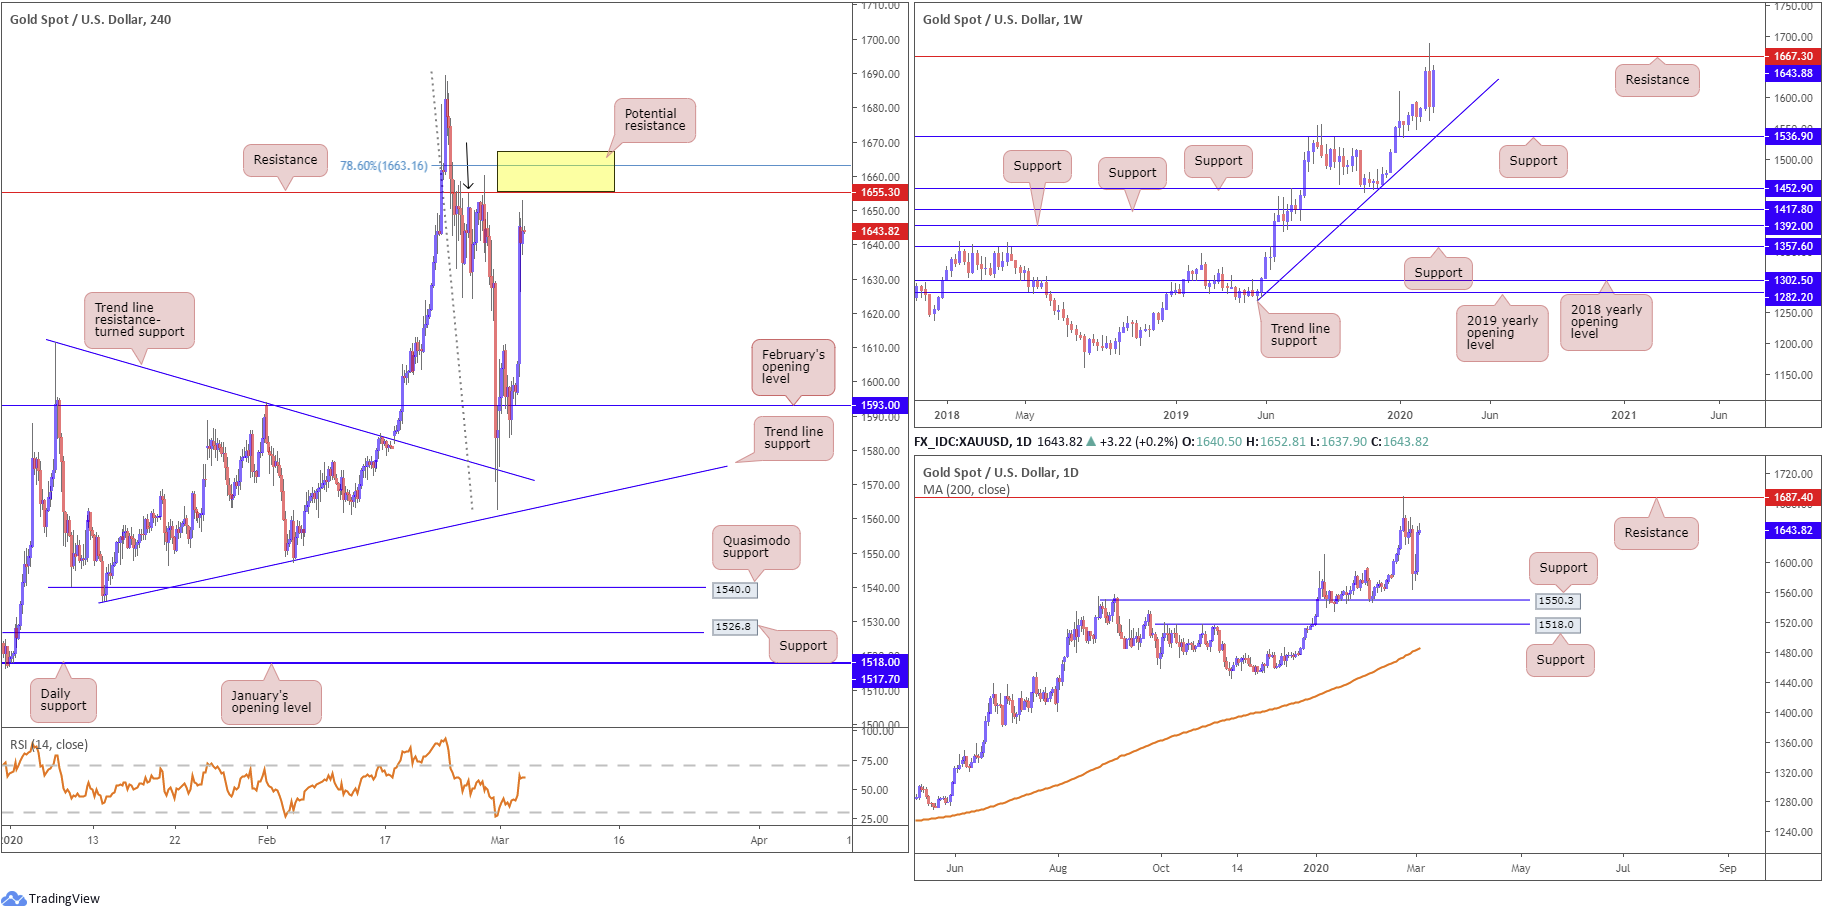
Demand for the safe-haven metal surged Tuesday after the US Federal Reserve announced a surprise rate cut of 50 bps. US government bonds rallied, sending yields lower; the Japanese yen also caught a strong bid as did the Swiss franc. The US dollar index, or DXY, tumbled for a fourth consecutive session, dipping its toes in waters south of 97.00.
Technically, bullion retested February’s opening level at 1593.0, albeit not to-the-point, and advanced, with price action on the H4 timeframe seen closing in on resistance at 1655.3 (also denotes Quasimodo resistance [see left shoulder marked with black arrow]). What’s also interesting is a 78.6% Fibonacci retracement ratio standing at 1663.1. Note also the relative strength index (RSI) is poised to shake hands with overbought levels.
The weekly timeframe shows that despite the week concluding in the shape of a bearish outside candle pattern, capped by resistance at 1667.3, gold reclaimed all of the prior week’s losses. As a result, traders could see the said resistance re-enter the fray this week.
On the daily timeframe, support at 1550.3 was left unchallenged prior to yesterday’s advance, with upside reasonably free until crossing swords with resistance coming in at 1687.4.
Areas of consideration:
Between the 78.6% H4 Fibonacci retracement at 1663.1 and resistance at 1655.3 denotes a potential ceiling today. However, in order to avoid whipsaws, traders may embrace weekly resistance at 1667.3 and expand the potential reversal zone, marked using a yellow box. Although this contains weekly structure, daily resistance falls in at 1687.4, therefore, the possibility of price running through the said reversal zone is certainly there. Consequently, traders may seek additional confirmation before committing.
The accuracy, completeness and timeliness of the information contained on this site cannot be guaranteed. IC Markets does not warranty, guarantee or make any representations, or assume any liability regarding financial results based on the use of the information in the site.
News, views, opinions, recommendations and other information obtained from sources outside of www.icmarkets.com.au, used in this site are believed to be reliable, but we cannot guarantee their accuracy or completeness. All such information is subject to change at any time without notice. IC Markets assumes no responsibility for the content of any linked site.
The fact that such links may exist does not indicate approval or endorsement of any material contained on any linked site. IC Markets is not liable for any harm caused by the transmission, through accessing the services or information on this site, of a computer virus, or other computer code or programming device that might be used to access, delete, damage, disable, disrupt or otherwise impede in any manner, the operation of the site or of any user’s software, hardware, data or property.


