
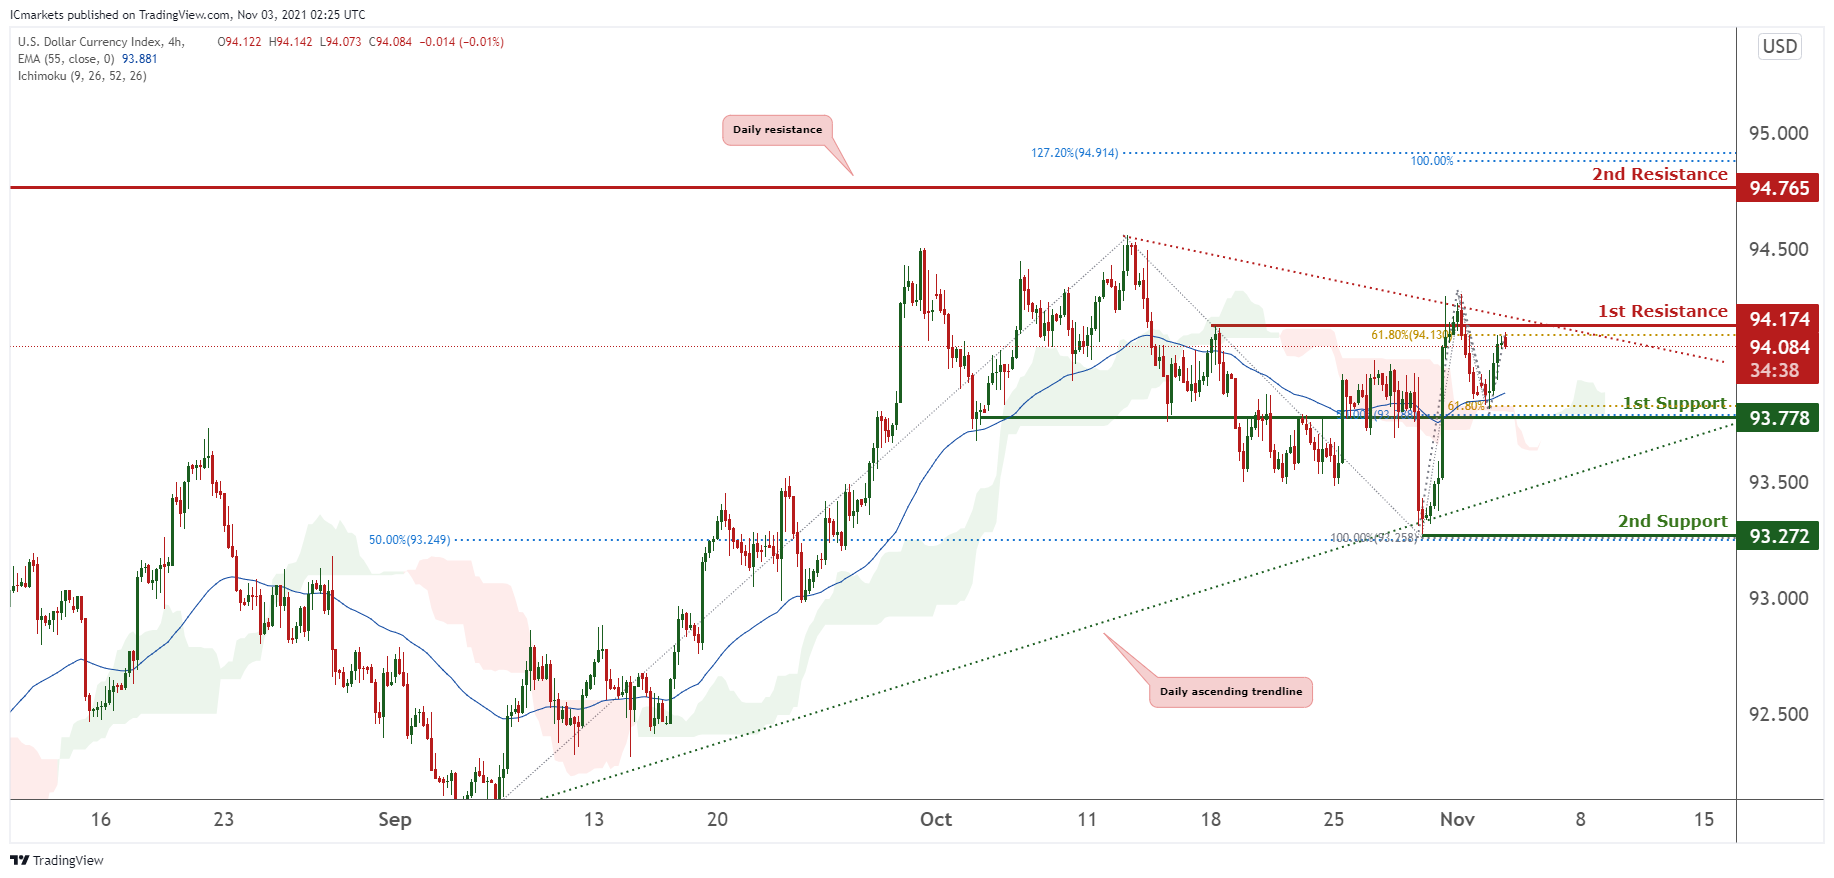
DXY:
On the H4 timeframe, prices are on a bullish momentum. We see potential for a small pullback from our 1st resistance at 94.174 in line with 61.8% Fibonacci retracement towards our 1st support at 93.778 in line with 50% Fibonacci retracement and 61.8% Fibonacci extension. Technical indicators are showing bullish momentum. Alternatively, prices breaking our 1st resistance will find prices climbing higher towards our 2nd resistance at 94.765 which is an area of Fibonacci confluences.
Areas of consideration:
- H4 time frame, 1st resistance at 94.174
- H4 time frame, 1st support at 93.778
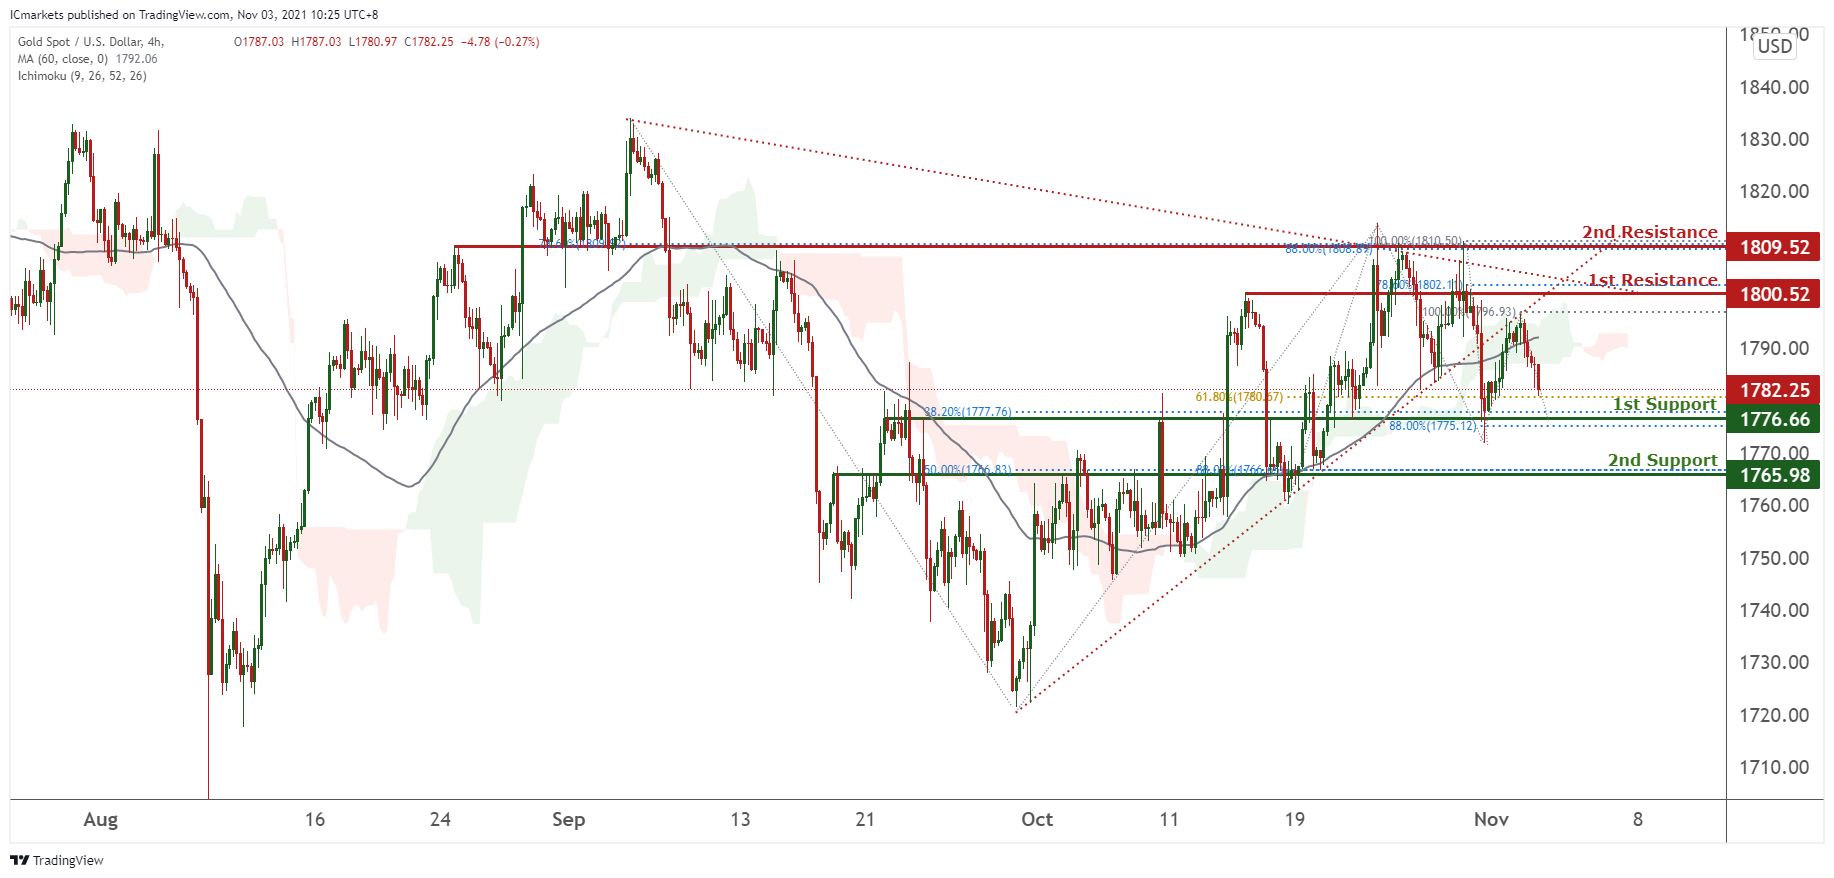
XAU/USD (GOLD):
On the H4 chart, prices have recently broken our triangle and are on a bearish momentum. We see the possibility of prices retesting 1st support at 1776.66 in which is an area of Fibonacci confluences. Technical indicators are showing bearish momentum. Alternatively, prices might climb higher towards our 1st resistance at 1800.52 in line with 78.6% Fibonacci retracement.
Areas of consideration:
- 4h 1st support at 1776.66
- 4h 1st resistance at 1800.52
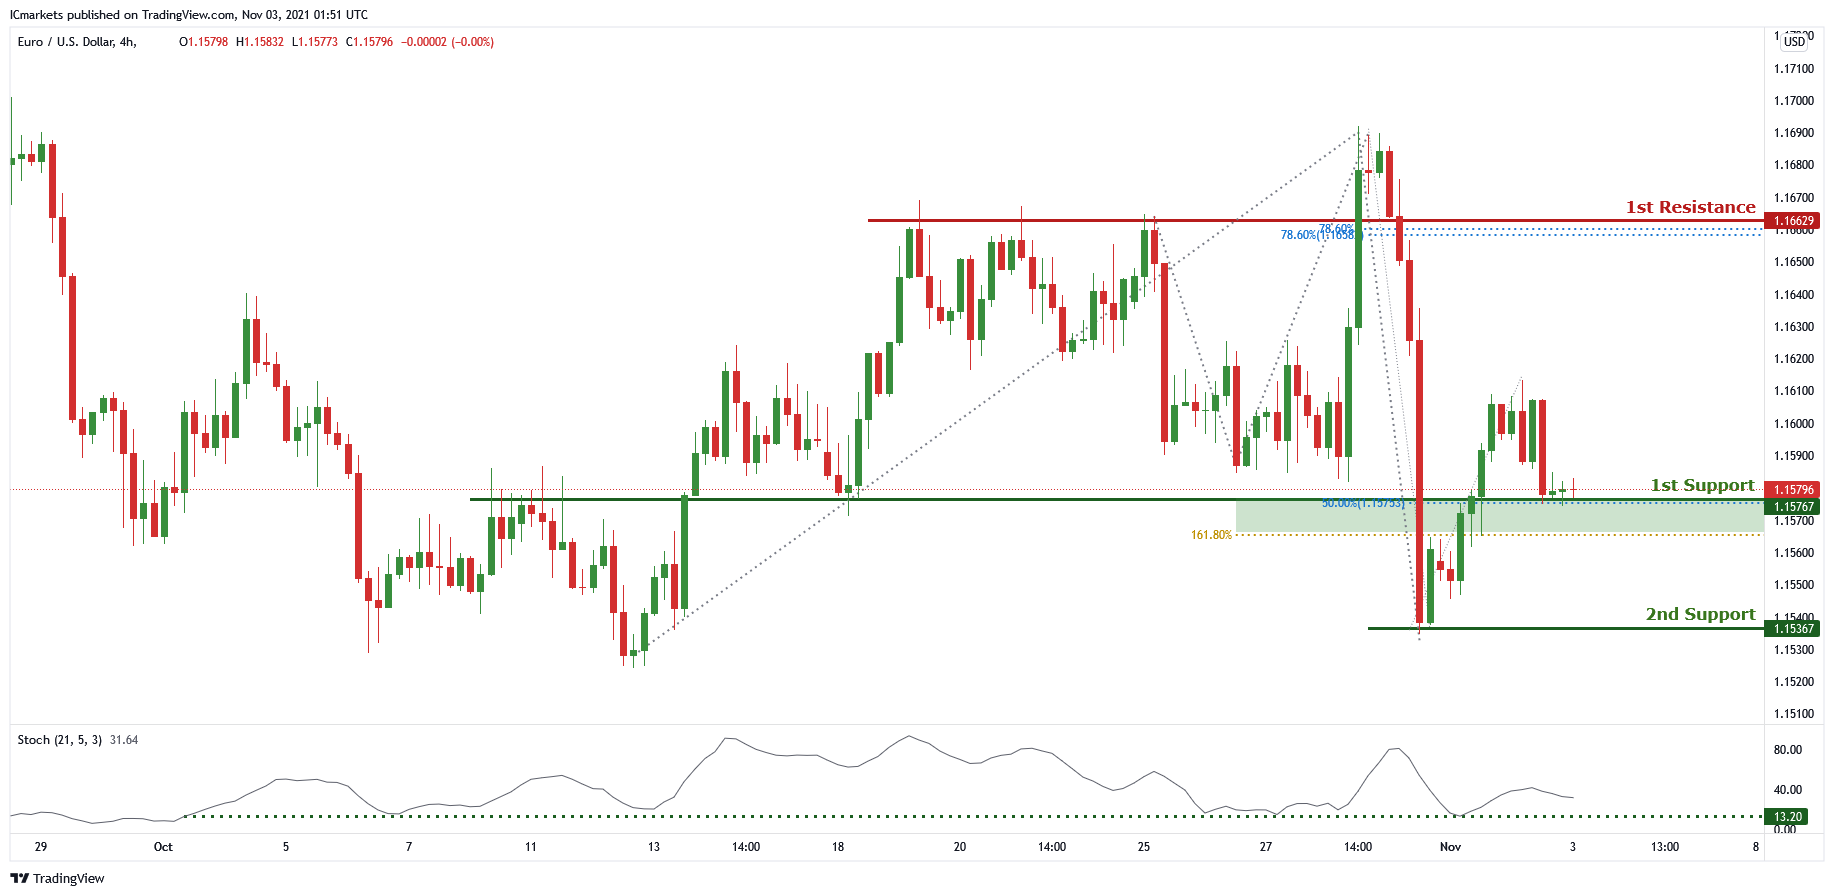
EUR/USD:
On the H4 chart price is near the first support level of 1.15767 which is also 50% Fibonacci retracement and 161.8% Fibonacci projection. Price can then potentially bounce from the first support to the first resistance of 1.16629 which is 78.6% Fibonacci projection and 78.6% Fibonacci retracement. Alternatively if price were to break the first support, it can potentially go to the second support level of 1.15367. Our bullish bias is supported by the stochastic which is near the support level.
Areas of considerations :
– Watch first support 1.15767
– Watch first resistance 1.16629
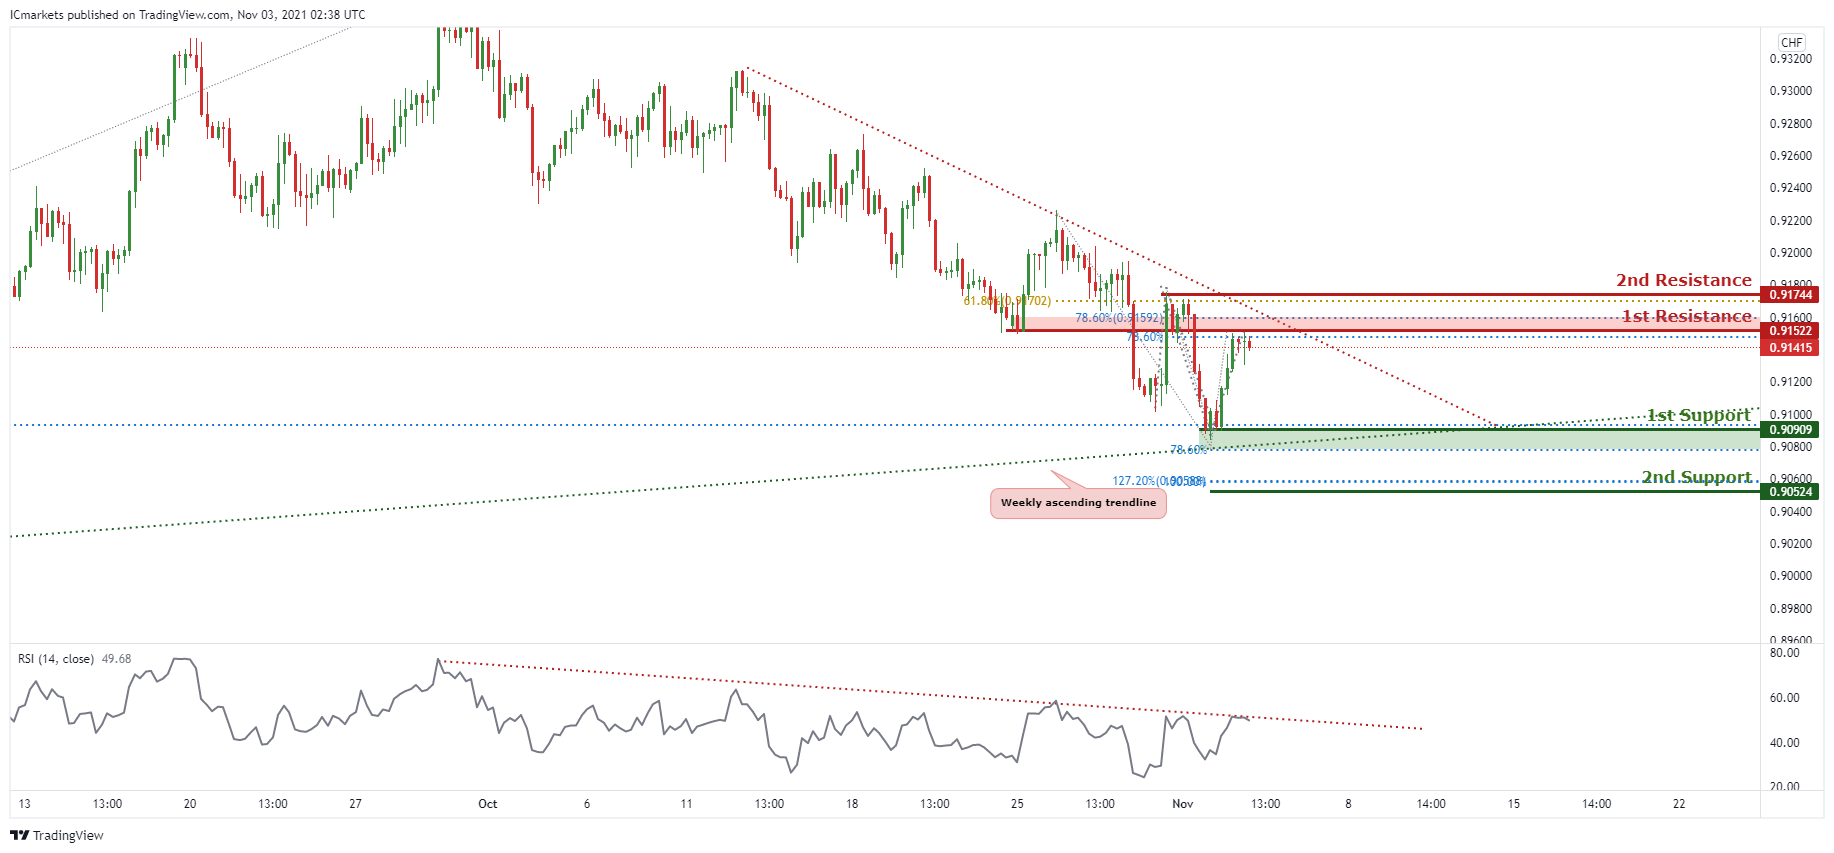
USD/CHF:
In reference to yesterday’s analysis, price indeed bounced up to the 1st Resistance at 0.91522. Price is now abiding to a descending trendline resistance, signifying bearish momentum. We can now expect price to make a drop from the 1st resistance in line with 78.6% Fibonacci retracement and 78.6 % Fibonacci projection towards the 1st Support in line with 78.6% Fibonacci projection. Our bearish bias is further supported by the RSI indicator where it is at the descending trendline resistance.
Areas of consideration:
- Watch 1st Support at 0.90909
- Watch 1st Resistance at 0.91522
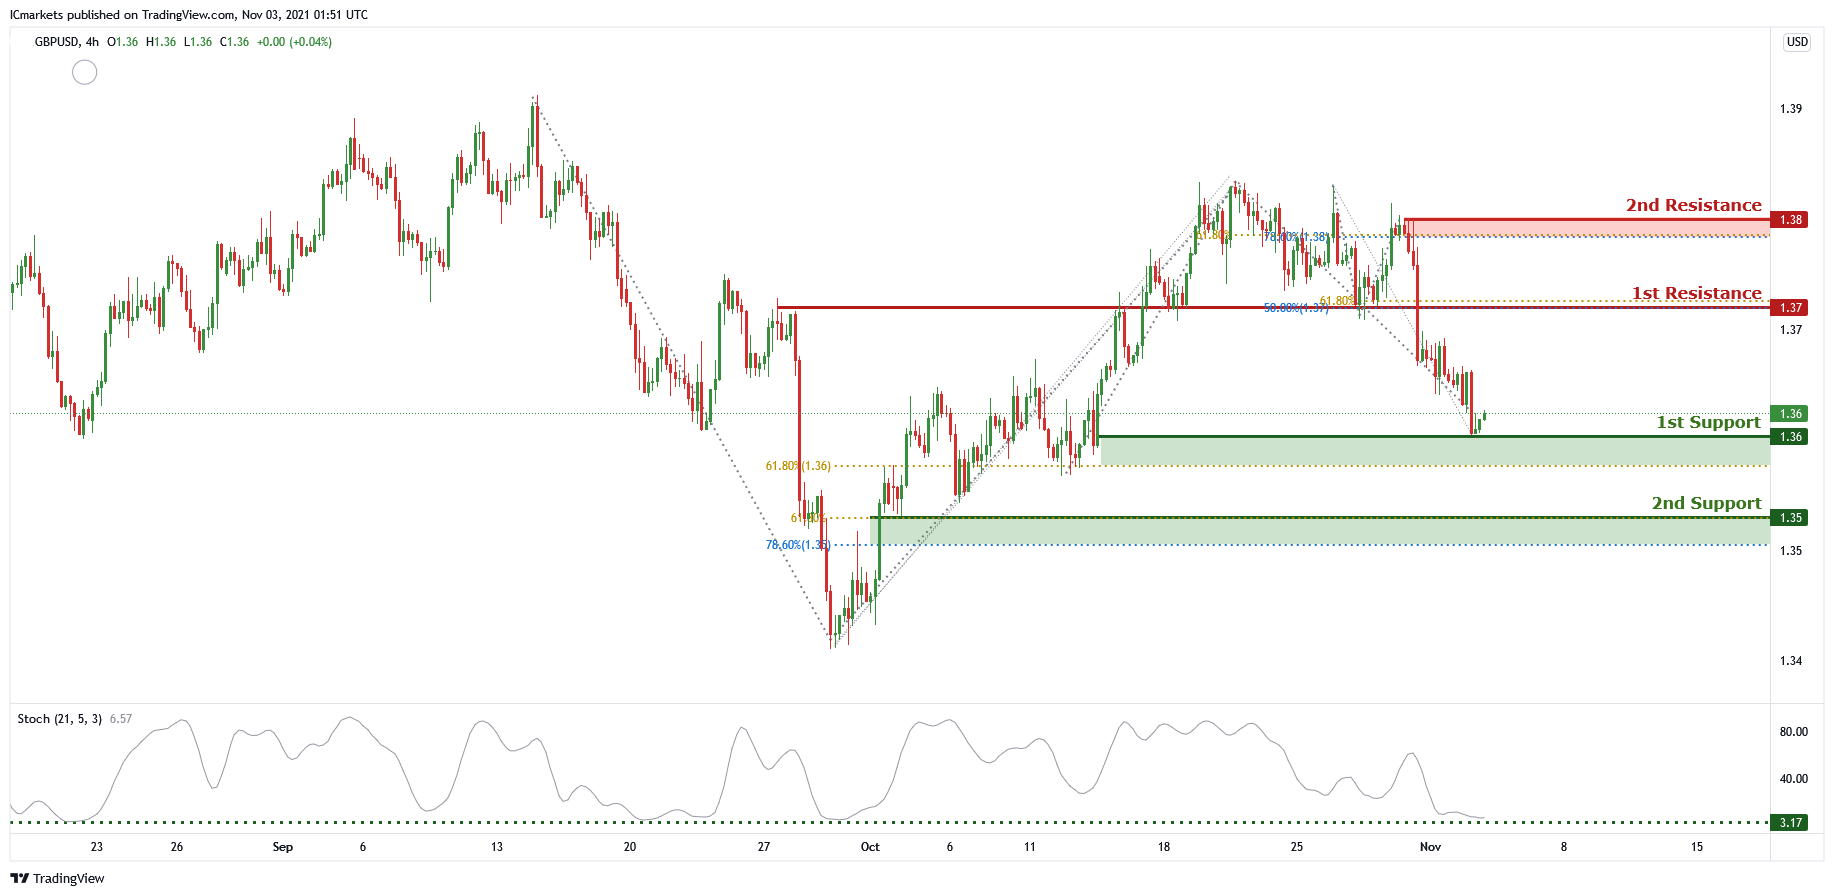
GBP/USD:
On the H4 chart price is at first support level of 1.36035 which is 61.8% Fibonacci retracement. Price can potentially bounce from the first support level to the first resistance level of 1.37207 which is also 50% Fibonacci retracement and 61.8% Fibonacci projection . Alternatively, if price were to break the first support level, it can potentially go to the 2nd support level of 1.35303 which is in line with 78.6% Fibonacci retracement and 61.8% Fibonacci projection. Our bullish bias is supported by stochastic as it is near the support level.
Areas of consideration :
H4 first support 1.36035
H4 first resistance 1.37207
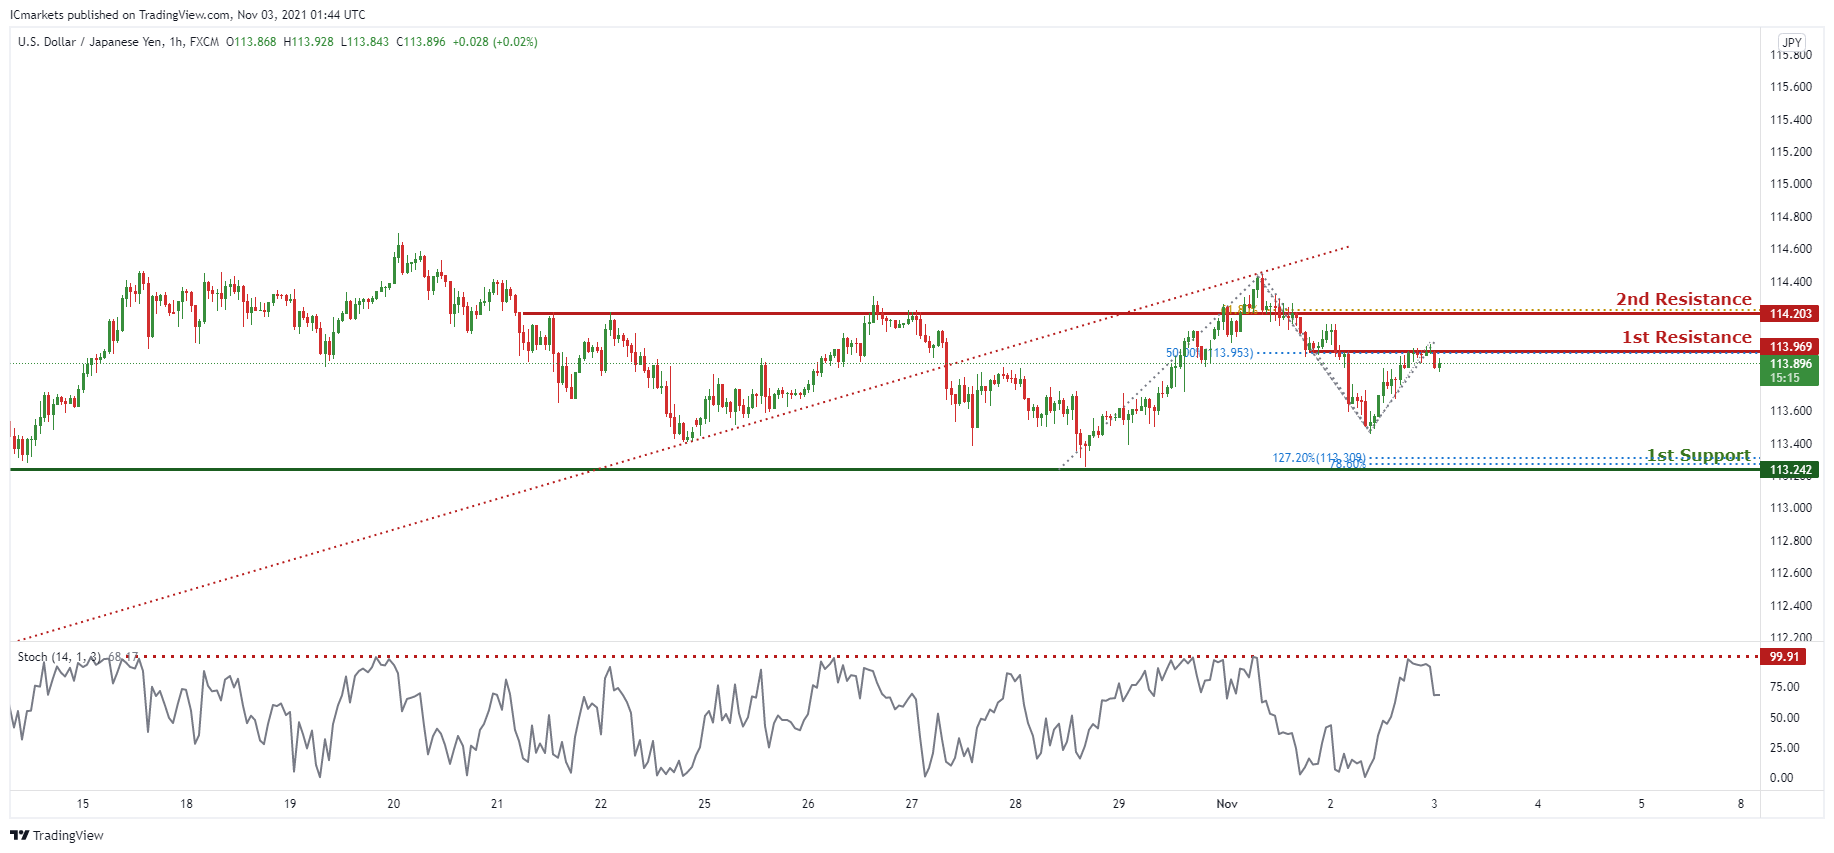
USD/JPY
On the H4 timeframe, price is currently in a bearish continuation where price is making lower highs and lower lows. We can expect price to drop from the 1st Resistance in line with 50% Fibonacci retracement to the 1st Support in line with 127.2% Fibonacci retracement and 78.6% Fibonacci projection . Our bearish bias is further supported by the stochastic indicator where the %K line dropped from the resistance level.
Areas of consideration:
- H4 1st resistance level 113.969
- H4 1st support level 113.242
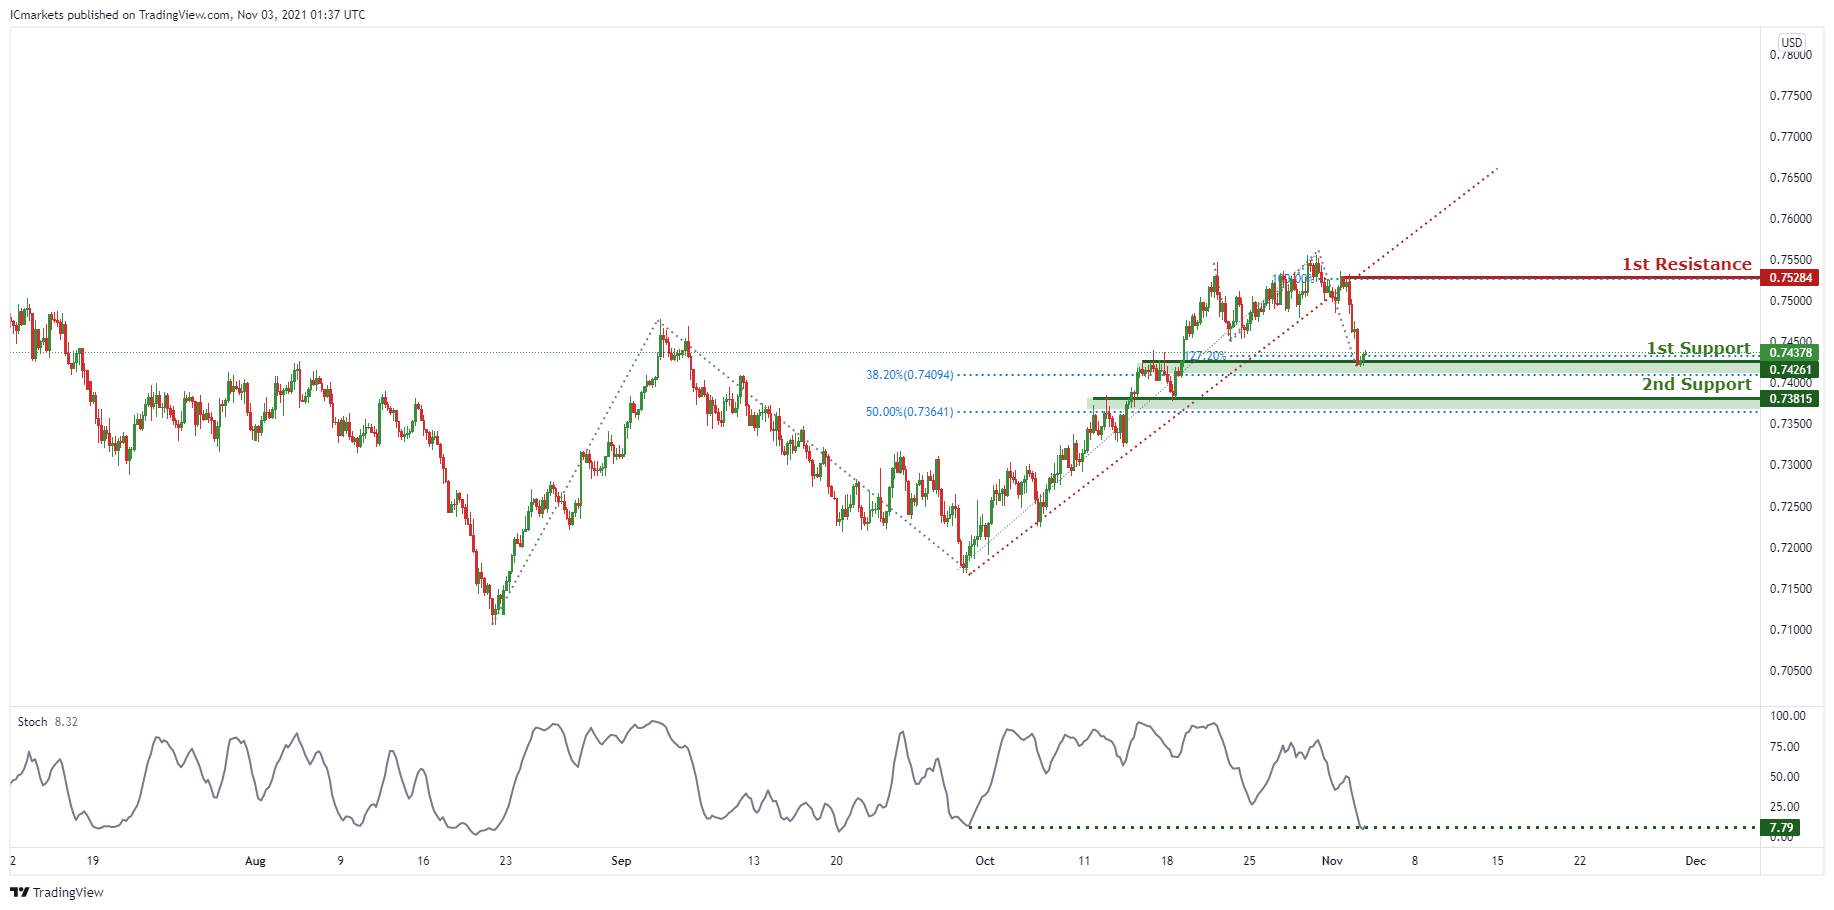
AUD/USD:
On the H4, we can see that price broke past the ascending trendline support, signifying a bearish trend momentum. We can expect price to make a short-term bullish bounce from the 1st Support in line with the 38.2% Fibonacci retracement and 127.2% Fibonacci projection towards the 1st Resistance in line with 100% Fibonacci projection to test the ascending trendline support now resistance.
Areas of consideration:
- H4 1st resistance level 0.75284
- H4 1st support level 0.74261
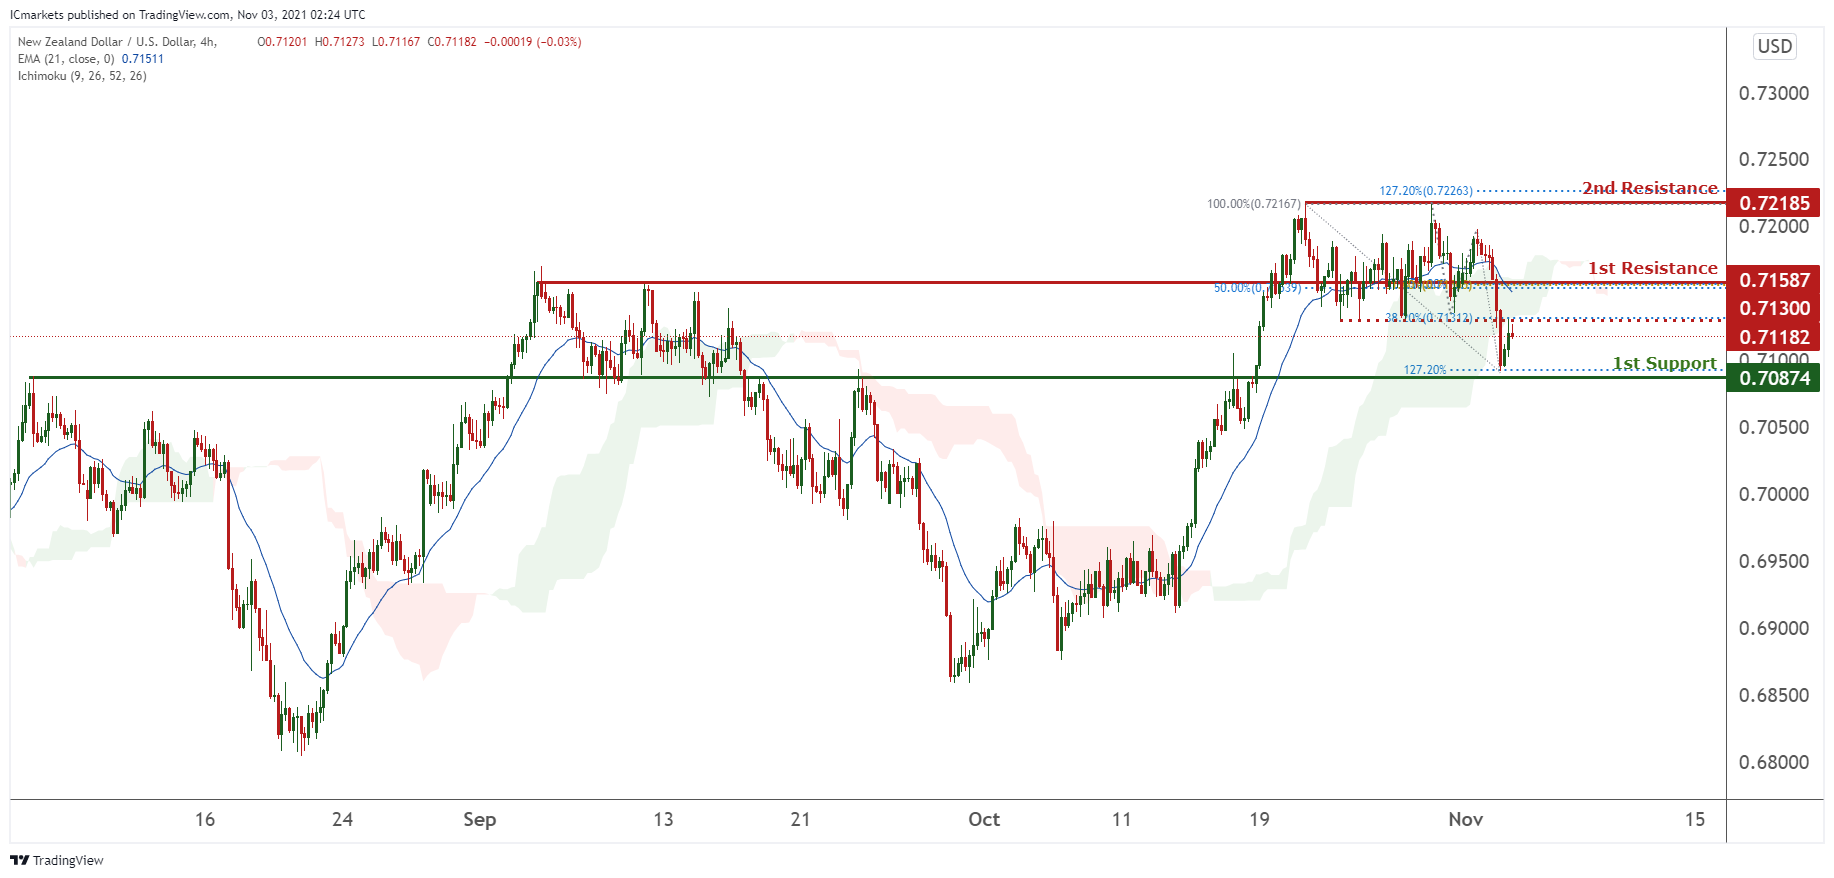
NZD/USD:
On the H4 timeframe, prices have recently experienced a major dip and tested our 1st support at 0.70874 in line with our 127.2% Fibonacci extension and is testing our intermediate resistance at 0.713. We would watch the level for potential reversals. As technical indicators are showing mixed signals, we would prefer to remain neutral for now.
Areas of consideration:
- H4 time frame, 1st resistance at 0.71587
- H4 time frame, 1st support at 0.70874
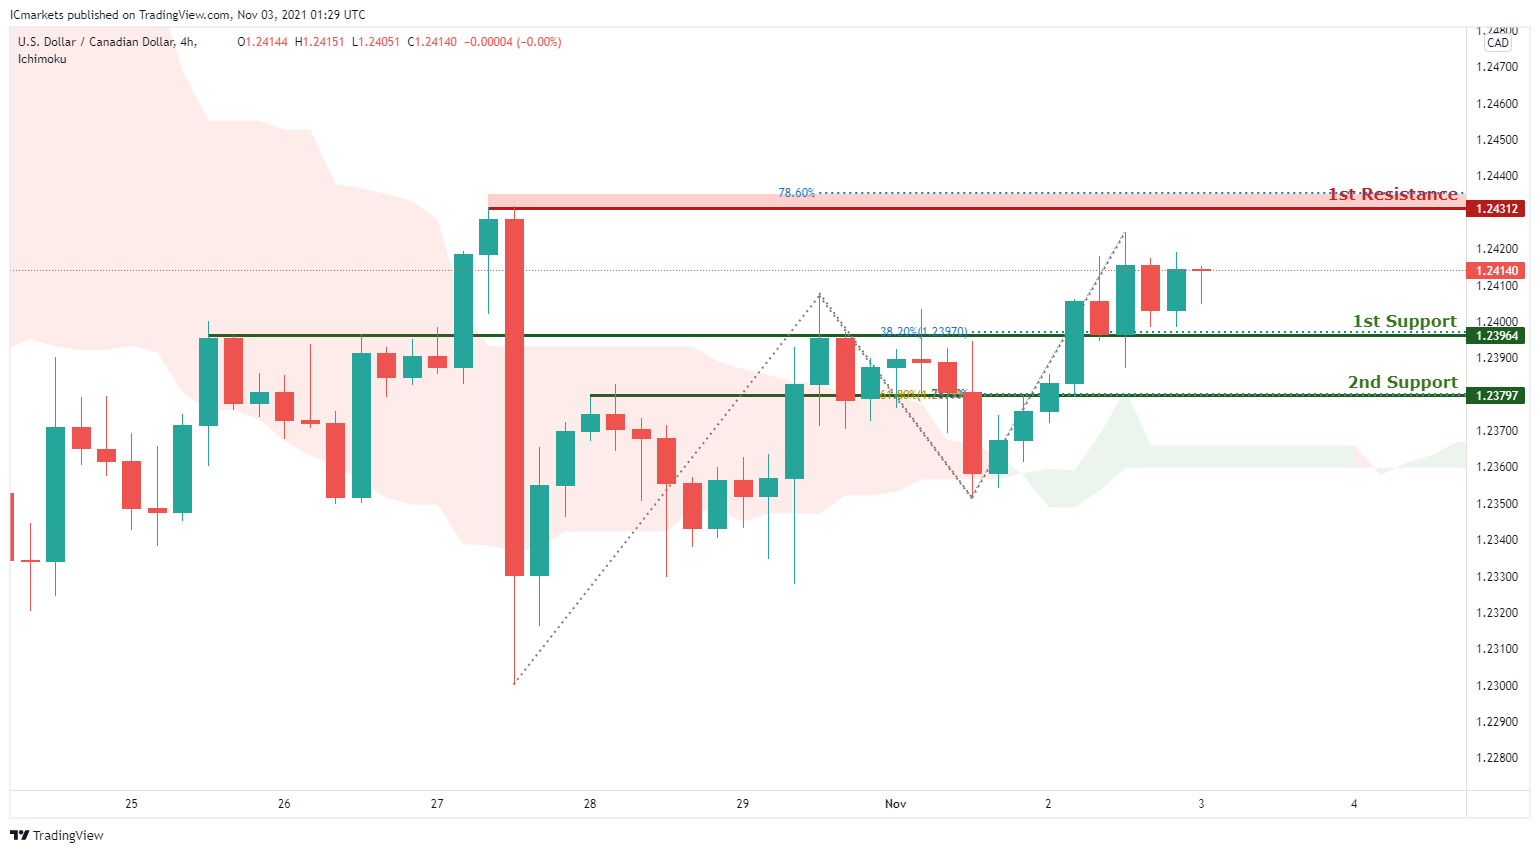
USD/CAD:
On the H4, with price moving above the ichimoku cloud which indicates a bullish momentum, we are expecting to see price rise to 1st resistance at 1.24312 in line with the 78.6% Fibonacci retracement and graphical swing high resistance from 1st support at 1.23964 in line with the 38.2% Fibonacci retracement levels and graphical overlap resistance. Alternatively, we may see price break structure at 1st support and head for 2nd support at 1.23797 in line with the 61.8% Fibonacci retracement, 78.6% Fibonacci extension and graphical overlap resistance.
Areas of consideration:
- H4 time frame, support at 23964
- H4 time frame, resistance at 24312
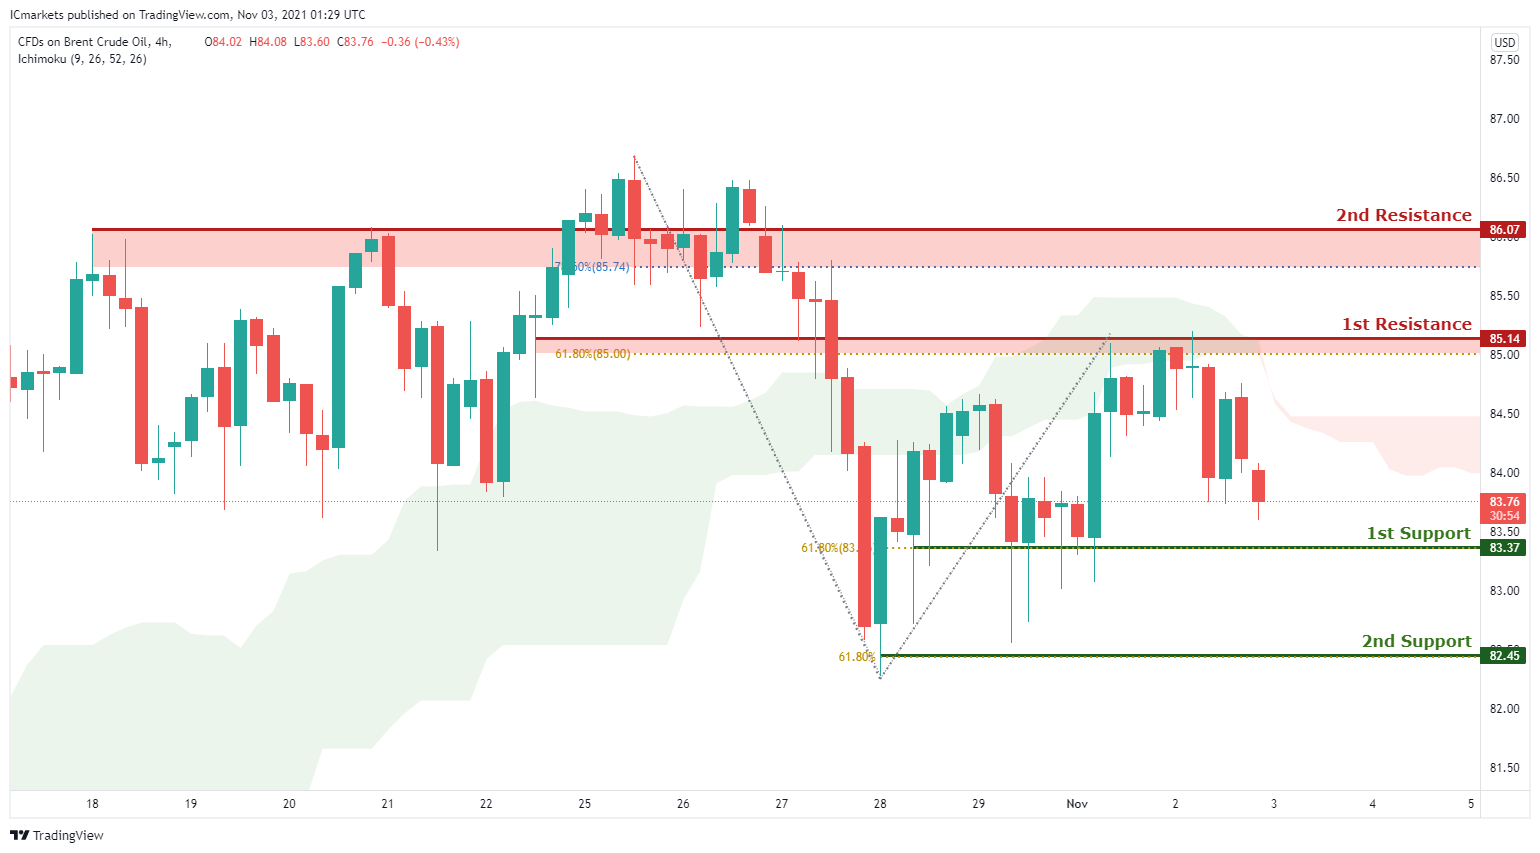
OIL:
On the H4 timeframe,with price moving below the ichimoku cloud, we are expecting a bearish continuation to 1st support at 83.37 in line with our horizontal swing low support and 61.8% Fibonacci retracement level and possibly our 2nd support at 82.45 in line with our 61.8% Fibonacci extension levels and graphical swing low support. Alternatively, price may rise to 1st resistance structure at 85.14 in line with the 61.8% Fibonacci retracement and head for 2nd resistance at 86.07 which is in the area of the 78.6% Fibonacci retracement area.
Areas of consideration:
- H4 time frame, 1st resistance of 14
- H4 time frame, 1st support of 37
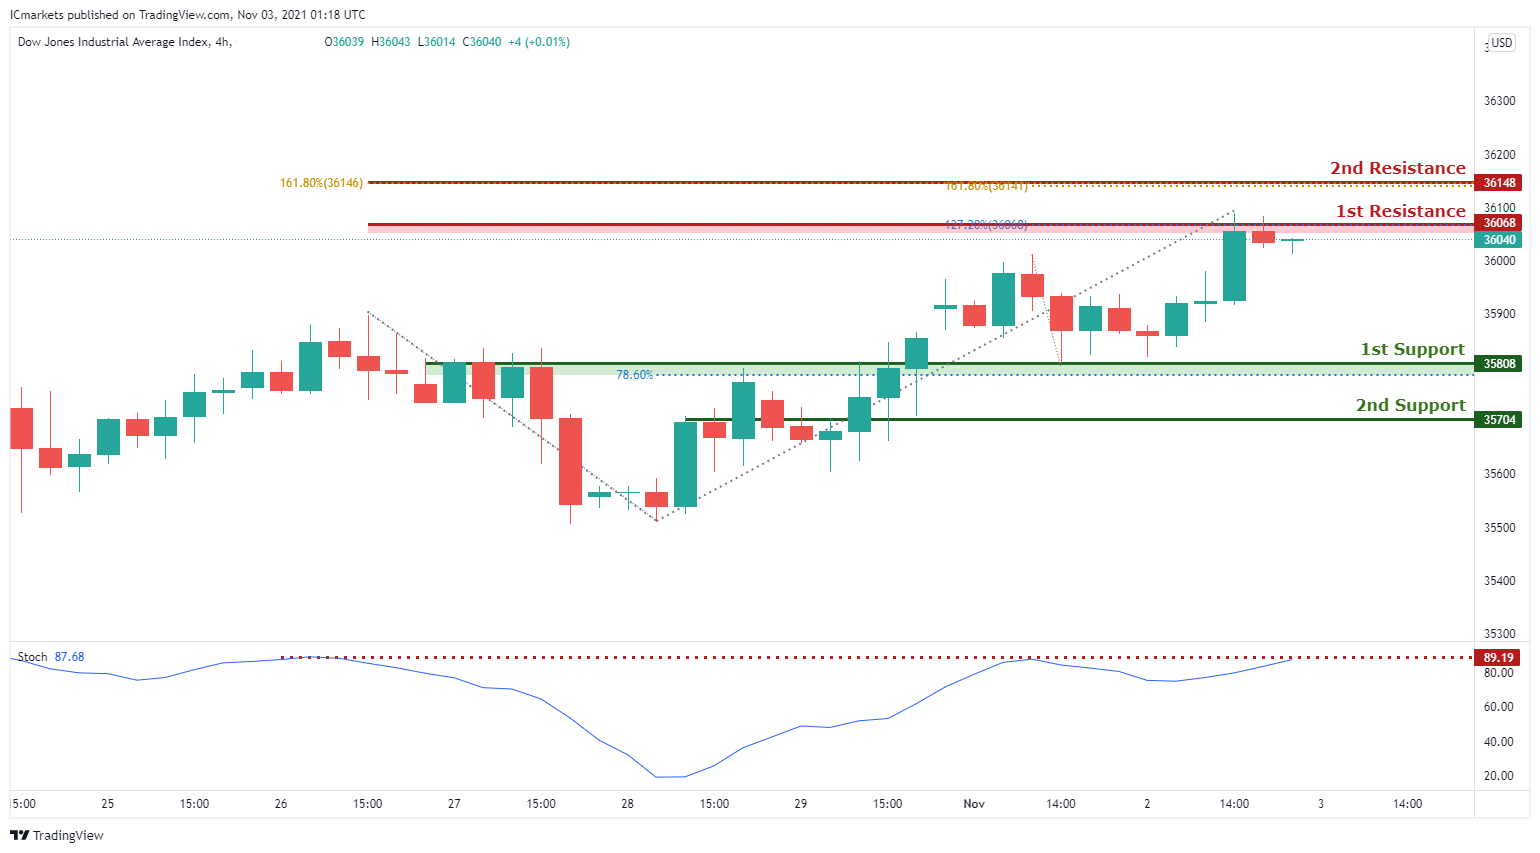
Dow Jones Industrial Average:
On the H4, with price approaching the resistance of the stochastics indicator indicating a reversal, we are biased that price will dip from 1st resistance at 36068 in line with the 127.2% Fibonacci extension level to 1st support at 35808 in line with the 38.2% Fibonacci retracement level. Alternatively, we may see price break 1st resistance and head for 2nd resistance at 36148 in line with two 161.8% Fibonacci extensions.
Areas of consideration:
- 4H resistance at 36068
- 4H support at 35808
The accuracy, completeness and timeliness of the information contained on this site cannot be guaranteed. IC Markets does not warranty, guarantee or make any representations, or assume any liability regarding financial results based on the use of the information in the site.
News, views, opinions, recommendations and other information obtained from sources outside of www.icmarkets.com.au, used in this site are believed to be reliable, but we cannot guarantee their accuracy or completeness. All such information is subject to change at any time without notice. IC Markets assumes no responsibility for the content of any linked site.
The fact that such links may exist does not indicate approval or endorsement of any material contained on any linked site. IC Markets is not liable for any harm caused by the transmission, through accessing the services or information on this site, of a computer virus, or other computer code or programming device that might be used to access, delete, damage, disable, disrupt or otherwise impede in any manner, the operation of the site or of any user’s software, hardware, data or property.


