
Waiting for lower timeframe confirmation is our main tool to confirm strength within higher timeframe zones, and has really been the key to our trading success. It takes a little time to understand the subtle nuances, however, as each trade is never the same, but once you master the rhythm so to speak, you will be saved from countless unnecessary losing trades. The following is a list of what we look for:
- A break/retest of supply or demand dependent on which way you’re trading.
- A trendline break/retest.
- Buying/selling tails/wicks – essentially we look for a cluster of very obvious spikes off of lower timeframe support and resistance levels within the higher timeframe zone.
- Candlestick patterns. We tend to stick with pin bars and engulfing bars as these have proven to be the most effective.
We typically search for lower-timeframe confirmation between the M15 and H1 timeframes, since most of our higher-timeframe areas begin with the H4. Stops are usually placed 3-5 pips beyond confirming structures.
EUR/USD:
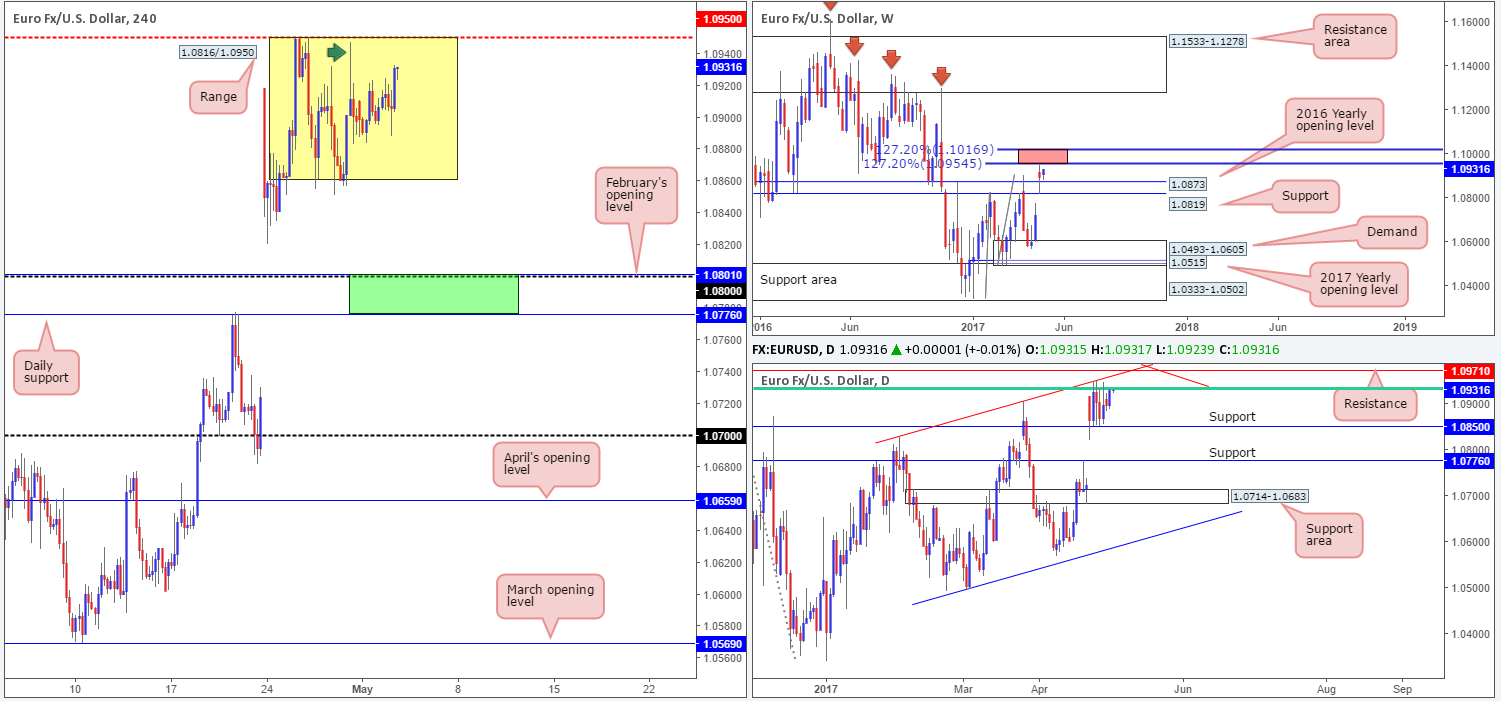
The EUR/USD, as you can see, remains somewhat muted as the major continues to trade within a H4 consolidation fixed between 1.0816/1.0950. Of particular interest here, however, is the long wick seen formed on the 28th April at 1.0947 (green arrow). This candle’s extreme has potentially consumed a large amount of offers within the current range, which could see price approach the upper edge of this box sometime today.
Now, 1.0950 on its own would not be a high-probability location to short from, as momentum has been firmly positioned to the upside since early April. Nevertheless, when coupled with a daily 61.8% Fib resistance at 1.0932 (green line), a nearby daily resistance pegged at 1.0971 and a weekly 127.2% Fib extension at 1.0954 (taken from the lows 1.0340), the technical story shifts in favor of the bears!
Our suggestions: Watch for H4 price to form a reasonably sized bearish candle between 1.0971/1.0950 (preferably a full-bodied candle). Should this come to fruition, then not only is a move back into the H4 consolidation possible, but a trade short on the back of this is as well.
Data points to consider: US ADP non-farm employment change at 1.15pm, ISM non-manufacturing PMI at 3pm and the FOMC’s monetary policy decision at 7pm GMT+1.
Levels to watch/live orders:
- Buys: Flat (stop loss: N/A).
- Sells: 1.0971/1.0950 ([waiting for a reasonably sized H4 bear candle to form before pulling the trigger is advised] stop loss: ideally beyond the candle’s wick).
GBP/USD:
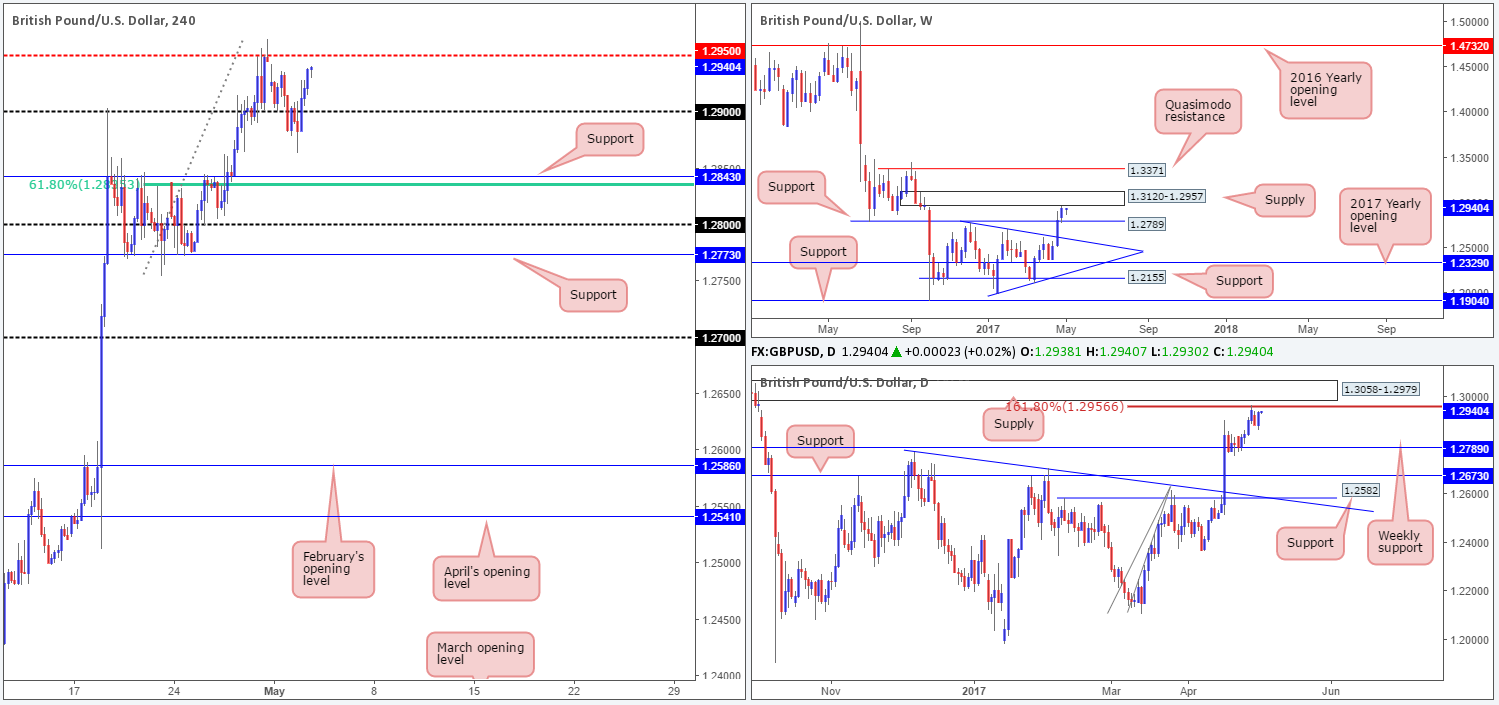
Better-than-expected UK manufacturing PMI figures helped provide support around the 1.2883 neighborhood amid London’s morning trade yesterday. As a result of this, the market reclaimed the 1.29 handle and popped to a high of 1.2939 by the closing bell. Although this recent advance managed to erase all of Monday’s losses as well as print a healthy full-bodied daily bull candle, it’s still a challenging pair to buy at the moment. Not only do we have a nearby 161.8% daily Fib extension at 1.2956 (drawn from the low 1.2108) and daily supply carved from 1.3058-1.2979, there’s also a weekly supply at 1.3120-1.2957 currently in motion.
Our suggestions: So, if structure suggests shorting, where does one consider selling from? Well, the first level that springs to mind is the most obvious: the H4 mid-level resistance at 1.2950 since it managed to cap upside on Friday. Our next port of call would be the large psychological band seen at 1.30.
Both levels, in our estimation, have equal chance of holding price given higher-timeframe structure. To be on the safe side though, we would not recommend placing pending orders here. Instead, watch how the H4 candles behave once price connects with the said levels. Assuming a reasonably sized H4 bearish candle forms (a full-bodied candle would be attractive), we’d consider selling this market.
Data points to consider: UK construction PMI at 9.30am. US ADP non-farm employment change at 1.15pm, ISM non-manufacturing PMI at 3pm and the FOMC’s monetary policy decision at 7pm GMT+1.
Levels to watch/live orders:
- Buys: Flat (stop loss: N/A).
- Sells: 1.2950 region ([waiting for a reasonably sized H4 bear candle to form before pulling the trigger is advised] stop loss: ideally beyond the candle’s wick). 1.30 area ([waiting for a reasonably sized H4 bear candle to form before pulling the trigger is advised] stop loss: ideally beyond the candle’s wick).
AUD/USD:
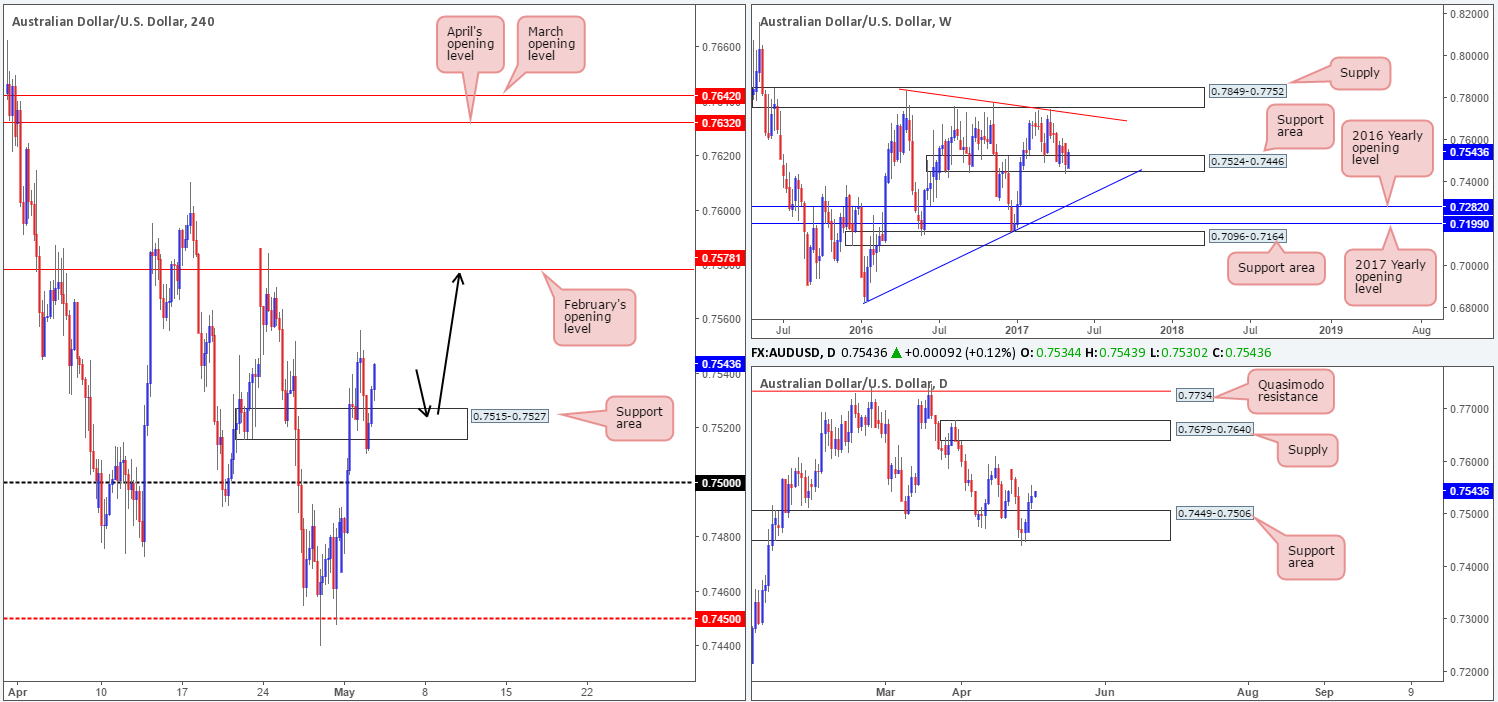
Aussie bulls managed to print their third consecutive daily gain yesterday, reaching highs of 0.7556 on the day. The H4 support area at 0.7515-0.7527 has managed to remain intact, despite suffering a breach going into the US segment. Owing to weekly bulls continuing to defend the support area at 0.7524-0.7446, we still believe that the H4 candles want to test February’s opening level at 0.7578. Be that as it may, to take advantage of this move, the only viable setup we see right now is a retest of the said H4 support area (as per the black arrows).
Our suggestions: In the event that a retest of the H4 zone is seen and a reasonably sized H4 bull candle presents itself (a full-bodied candle would be ideal), a long from this region, with a target objective of 0.7578, could be something to consider.
Data points to consider: US ADP non-farm employment change at 1.15pm, ISM non-manufacturing PMI at 3pm and the FOMC’s monetary policy decision at 7pm GMT+1.
Levels to watch/live orders:
- Buys: 0.7515-0.7527 ([waiting for a reasonably sized H4 bull candle to form before pulling the trigger is advised] stop loss: ideally beyond the candle’s tail).
- Sells: Flat (stop loss: N/A).
USD/JPY:
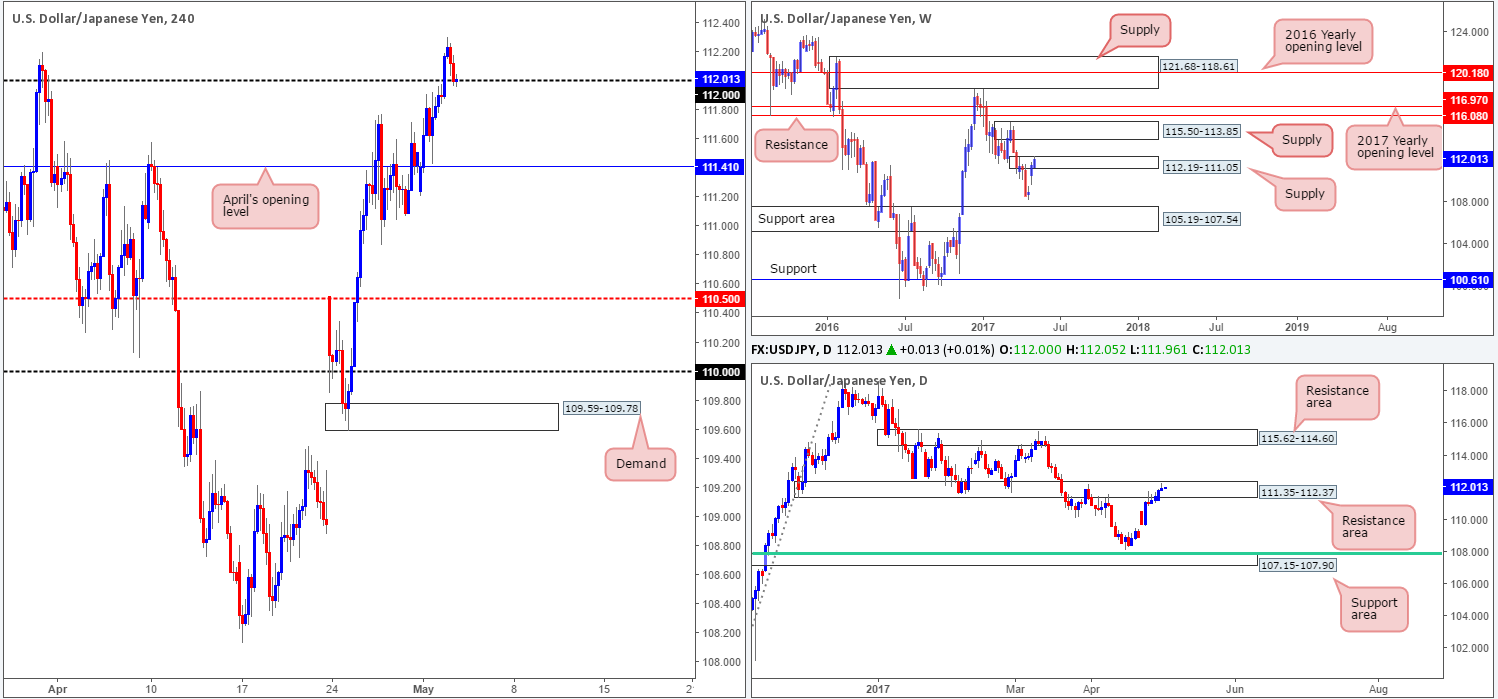
In recent sessions, we can see that the H4 candles cleared the 112 handle during the early hours of London and then went on to retest it as support going into the US afternoon session. While a long from this level could be an option, it might be worth noting the bigger picture. Weekly price is currently seen trading within the upper limits of a supply formed from 112.19-111.05, and daily action has been interacting with a resistance zone coming in at 111.35-112.37 since last Wednesday.
Therefore, instead of looking to buy from 112 today, we are going to be watching for 112 to give way. This could, according to our technicals, open up the path south down to April’s opening level at 111.41 and quite possibly the 111 handle.
Our suggestions: A H4 close beyond 112 followed up with a retest and a reasonably sized H4 bearish (preferably full-bodied) candle would, in our humble opinion, be enough evidence to suggest the bears are in control and shorts are now viable.
Data points to consider: US ADP non-farm employment change at 1.15pm, ISM non-manufacturing PMI at 3pm and the FOMC’s monetary policy decision at 7pm GMT+1.
Levels to watch/live orders:
- Buys: Flat (stop loss: N/A).
- Sells: Watch for H4 price to close below 112 and then look to trade any retest seen thereafter ([waiting for a reasonably sized H4 bearish candle to form following the retest is advised] stop loss: ideally beyond the candle’s wick).
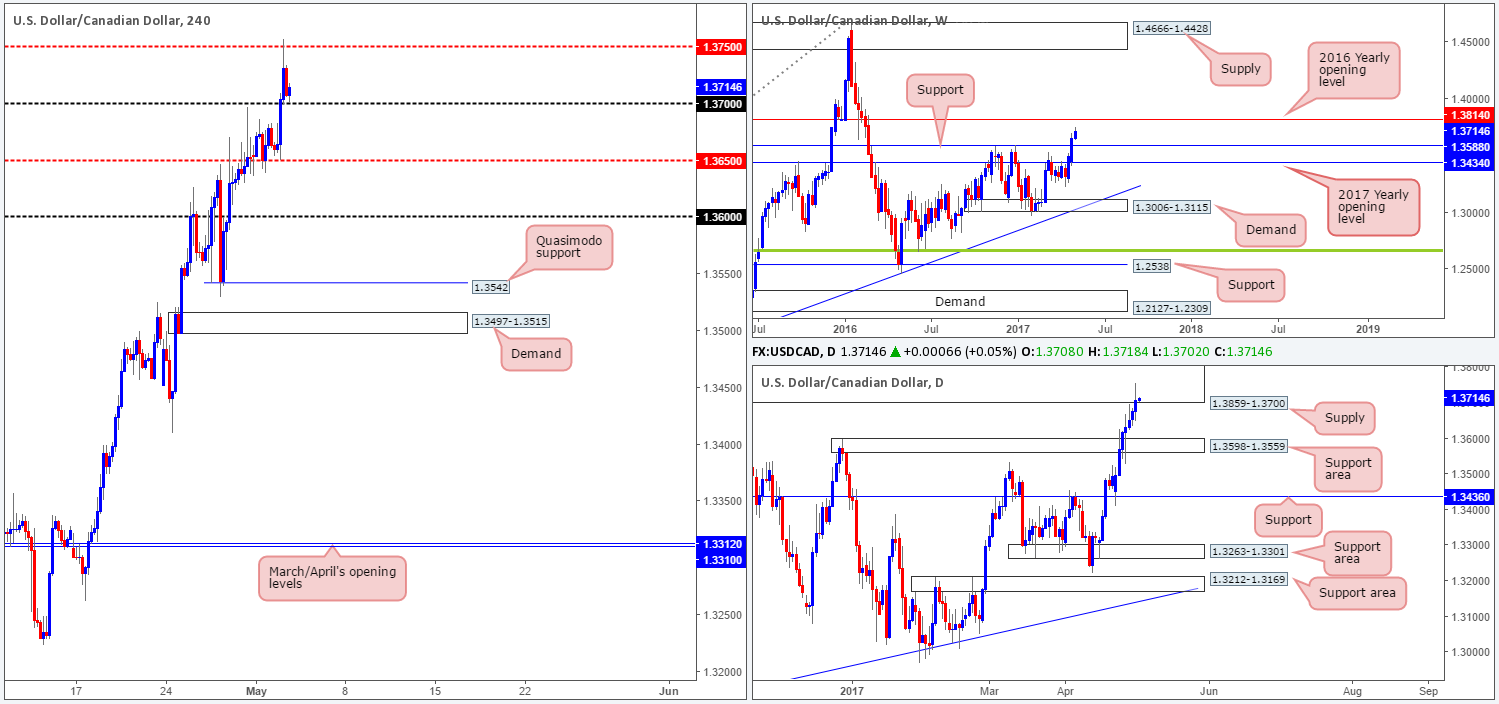
USD/CAD:
With oil prices softening yesterday, the USD/CAD pair rallied higher. H4 price easily cleared the 1.37 handle and went on to challenge the mid-level resistance 1.3750, which, as you can see, held firm. Although daily buyers printed their eighth consecutive bullish candle yesterday, our team remains somewhat biased to the downside. Our reasoning lies within the higher-timeframe structures. Daily price has recently checked in with a supply zone penciled in at 1.3859-1.3700. And weekly flow looks poised to attack the 2016 yearly opening level at 1.3814, which sits nicely within the upper limits of the said daily supply.
Our suggestions: To our way of seeing things, entering long (medium/long term) is not a viable option at present. Shorts on the other hand, are. However, given our conservative nature, we would not be looking to commit until price has connected with the above noted 2016 yearly opening level (essentially around the 1.38 region). The reason being is that it’s firmly positioned within the said daily supply, thus allowing the trader to conservatively place stops above this area.
Data points to consider: US ADP non-farm employment change at 1.15pm, ISM non-manufacturing PMI at 3pm and the FOMC’s monetary policy decision at 7pm GMT+1.
Levels to watch/live orders:
- Buys: Flat (stop loss: N/A).
- Sells: 1.3814/1.38 region is an ideal place for shorts since this area requires no additional confirmation (stop loss: conservative at 1.3861).
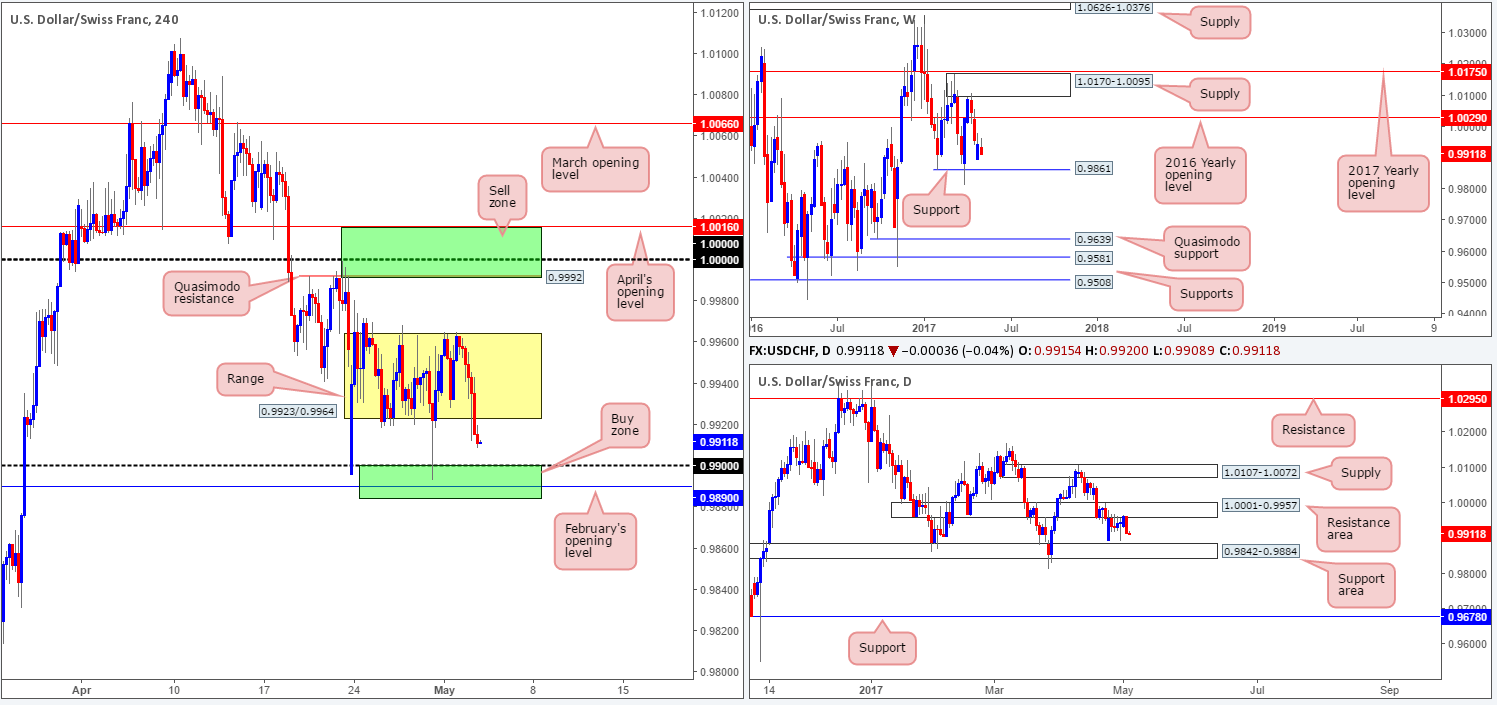
USD/CHF:
As can be seen from the H4 chart this morning, price breached and eventually closed beyond the lower edge of the consolidation fixed between 0.9923/0.9964. Consequent to this, the H4 buy zone seen marked in green at 0.9884/0.99 is now in view. Comprised of the 0.99 handle, February’s opening level at 0.9890 and the top edge of a daily support area at 0.9842-0.9884, this zone could potentially bounce price today as it did last Friday.
Our suggestions: The only grumble we would have if we were to take a long from the said H4 area is the fact that weekly price could potentially push the market lower to shake hands with support at 0.9861. As such, we are advising traders not to trade the above said zone blindly! Wait for additional confirmation either in the form of a H4 candle (preferably a full-bodied candle) or a lower-timeframe buy signal (see the top of this report).
Data points to consider: US ADP non-farm employment change at 1.15pm, ISM non-manufacturing PMI at 3pm and the FOMC’s monetary policy decision at 7pm GMT+1.
Levels to watch/live orders:
- Buys: 0.9884/0.99 ([waiting for a reasonably sized H4 bull candle to form before pulling the trigger is advised] stop loss: ideally beyond the candle’s tail).
- Sells: Flat (stop loss: N/A).
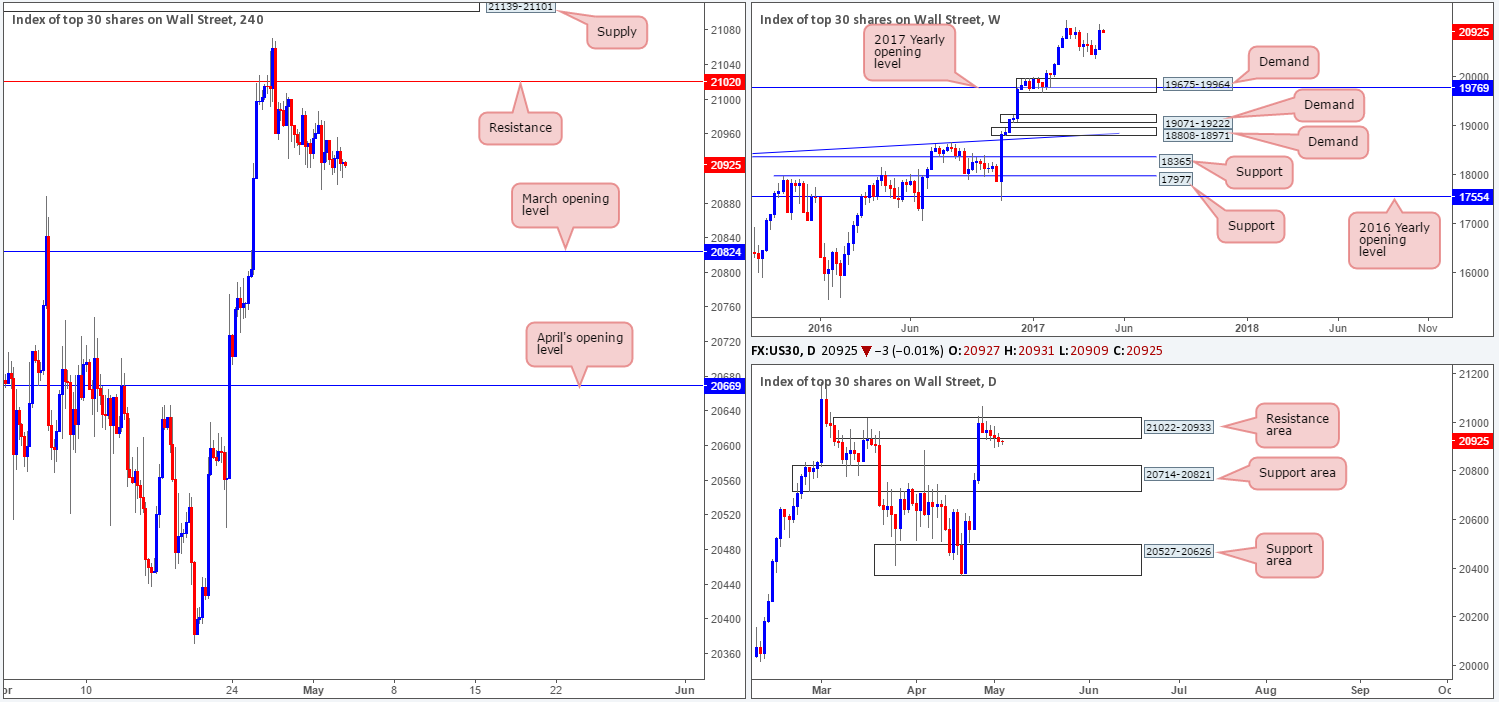
DOW 30:
This market has been as monotonous as watching paint dry since H4 price whipsawed through resistance at 21020. While the market continues to grind lower, albeit as slow as a snail, the next support target on tap from here is not seen in view until March’s opening level at 20824.
As highlighted in previous reports, the noted monthly level is positioned above the daily support area at 20714-20821 (the next downside target on that timeframe).With daily price currently trading from a resistance area at 21022-20933, there’s a good chance that price may reach the above noted daily support area. However, up on the weekly candles, price still looks poised to continue marching higher!
Our suggestions: Ultimately, our team’s bias is long. However, we’re finding it difficult to pin down a setup given the only support present is March’s opening level seen on the H4 chart. Therefore, unless new H4 structure forms at current price or we see a decline down to 20824, we will continue to remain flat.
Data points to consider: US ADP non-farm employment change at 1.15pm, ISM non-manufacturing PMI at 3pm and the FOMC’s monetary policy decision at 7pm GMT+1.
Levels to watch/live orders:
- Buys: 20824 looks an interesting level for longs. However, we would require a H4 bullish candle to present itself here (preferably a full-bodied candle) before committing (stop loss: ideally beyond the candle’s tail).
- Sells: Flat (stop loss: N/A).
GOLD:
Gold prices are effectively unchanged this morning. The metal continues to loiter around the lower edge of the daily support area seen at 1265.2-1252.1, while weekly bears continue to hold price below support at 1263.7. Although weekly flow suggests further selling could be on the cards, it would be a chancy move to sell seeing where daily price is currently positioned!
Moving across to the H4 candles, the unit remains trading between resistance drawn from 1261.0 and April’s opening base line at 1248.0/March’s opening base line at 1245.9.
Our suggestions: Should H4 price retest 1261.0 as resistance today and hold, we may, given the technical picture on the weekly chart, think about selling. Of course, the only grumble here is that daily price remains within a support zone (see above). Therefore, we would not consider shorts from 1261.0 UNLESS a reasonably sized H4 bearish candle forms off this line, preferably a full-bodied candle.

Levels to watch/live orders:
- Buys: Flat (stop loss: N/A).
- Sells: 1261.0 region ([waiting for a reasonably sized H4 bear candle to form before pulling the trigger is advised] stop loss: ideally beyond the candle’s wick).


