
Key risk events today:
Australia GDP q/q; UK Final Services PMI; G7 Meetings; US ADP Non-Farm Employment Change; BoC Rate Statement and Overnight Rate; US ISM Non-Manufacturing PMI.
(Previous analysis as well as outside sources – italics).
EUR/USD:
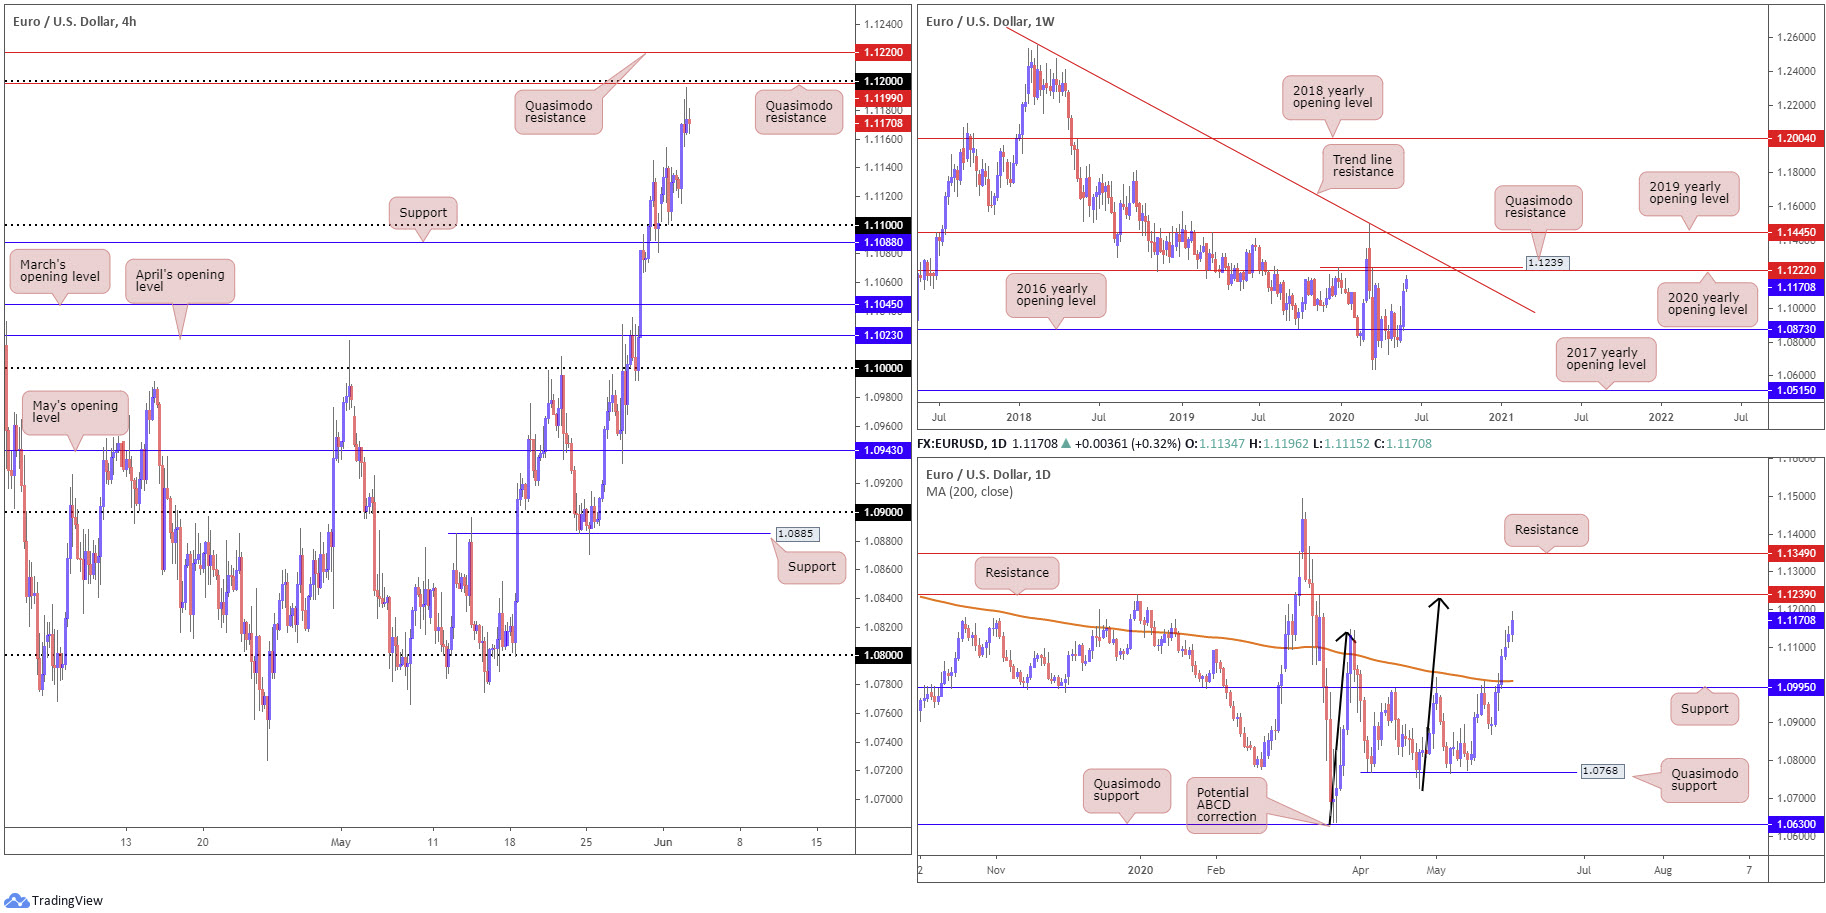
The US dollar index, or more commonly referred to as the ‘DXY’, declined to levels not seen since March 13 on Tuesday after recording its sixth consecutive daily loss.
The euro continued to build on gains Tuesday, though recently peaked in the shape of a H4 shooting star candlestick pattern south of the 1.12 neighbourhood, which boasts a close connection to H4 Quasimodo resistance at 1.1199 and another layer of H4 Quasimodo resistance at 1.1220.
Although the H4 displays signs of topping, higher-timeframe structure suggests further upside could be on the cards.
Weekly price echoes the possibility of rallying until reaching the 2020 yearly opening level at 1.1222 (regarded as strong resistance), closely followed by Quasimodo resistance at 1.1239. It is also worth remembering the long-term trend has faced south since topping in early February 2018. In similar fashion, the daily timeframe shows room to extend north until shaking hands with resistance at 1.1239 (essentially the same base as weekly QM), joined closely with an ABCD correction (black arrows) at 1.1226.
Areas of consideration:
Despite H4 topping, a fakeout through 1.12 is a possibility today, which may be a scenario that interests sellers. Potential reversal points are the H4 Quasimodo resistance at 1.1220, which aligns with weekly resistance at 1.1222 (2020 yearly opening level). A deeper fakeout, nonetheless, could attack weekly Quasimodo resistance at 1.1239.
GBP/USD:
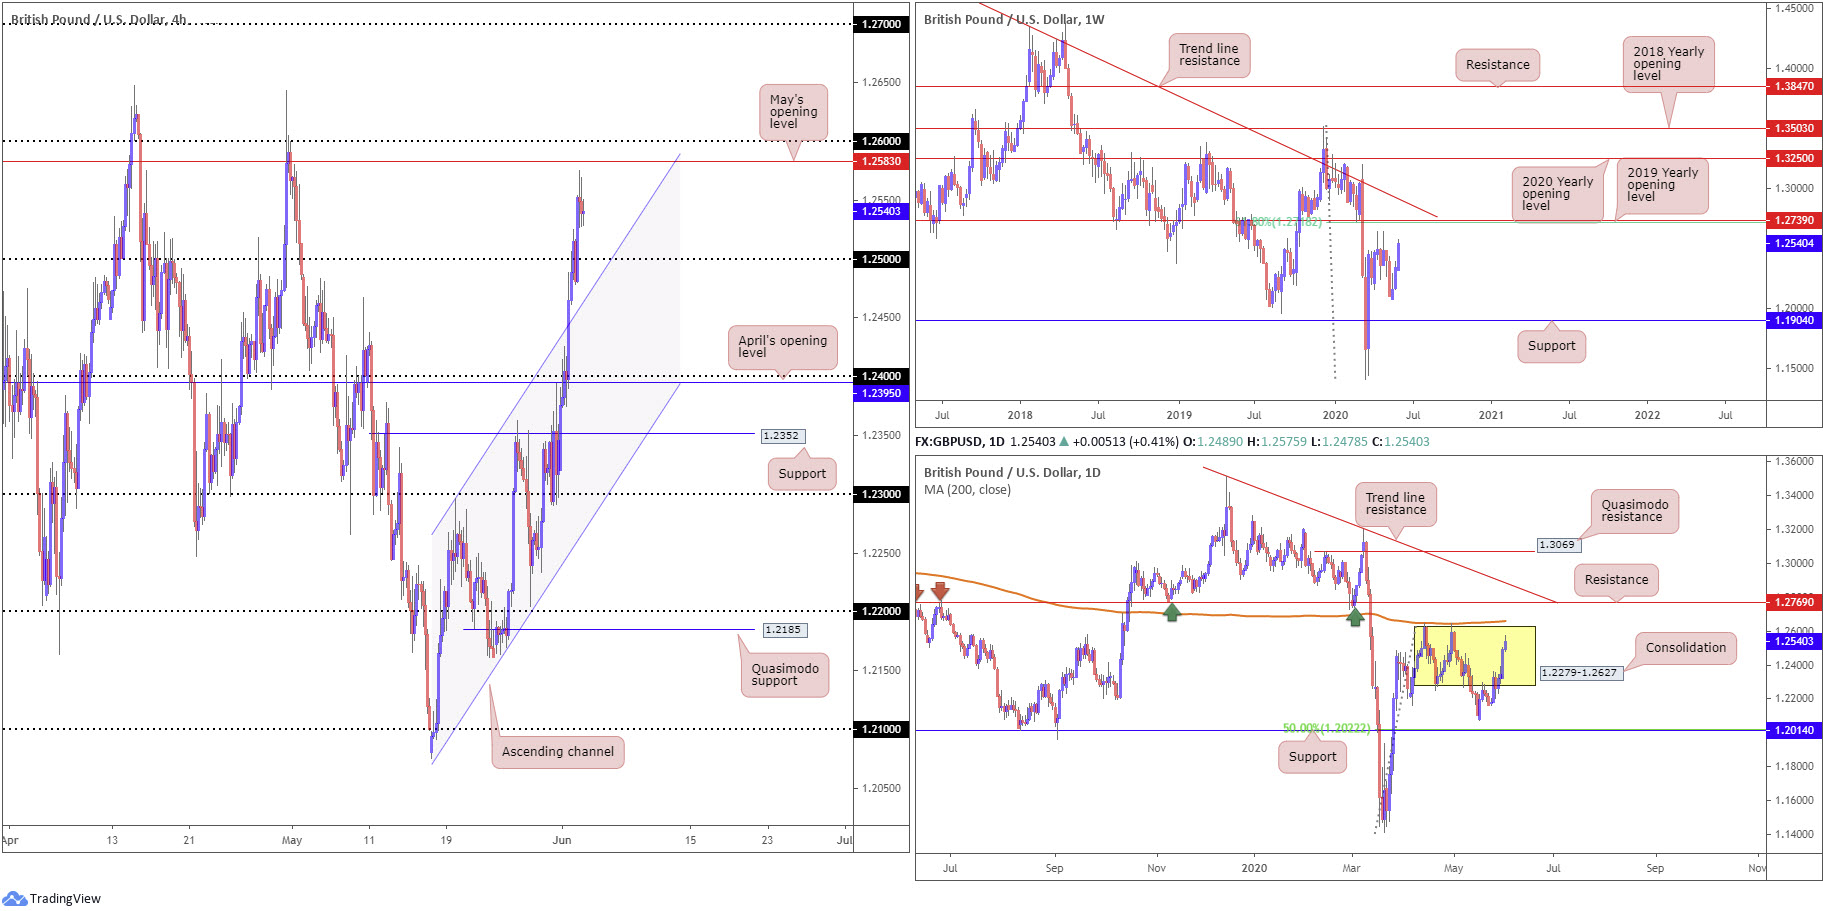
Sterling maintained its bid tone Tuesday as the US dollar index probed fresh lows at 97.43. H4 price cleared 1.25 and advanced to a peak at 1.2575, a touch south of May’s opening level at 1.2583 and the 1.26 handle. Support targets, in the event a pullback materialises, can be found at the 1.25 handle and a channel resistance-turned support, extended from the high 1.2296.
GBP/USD, from the weekly timeframe, appears poised to attempt a run to 1.2739, the 2019 yearly opening level, and a 61.8% Fibonacci retracement ratio at 1.2718, sited a handful of pips under trend line resistance, extended from the high 1.5930.
Analysis on the daily timeframe shows price exploring higher ground within a familiar range between 1.2279-1.2627, threatening the possibility of testing range tops today. Note the 200-day SMA (orange – 1.2659) circles nearby the upper base of the said range, with a break shining the spotlight on resistance drawn from 1.2769.
Areas of consideration:
Between the 1.26 handle on the H4 timeframe and daily range tops at 1.2627 chalks up a potential reversal zone to work with today. Traders, however, are urged to pencil in the possibility of a fakeout above the zone to the 200-day SMA at 1.2659. Therefore, conservative sellers may seek candlestick confirmation out of 1.2627/1.26 before pulling the trigger.
AUD/USD:
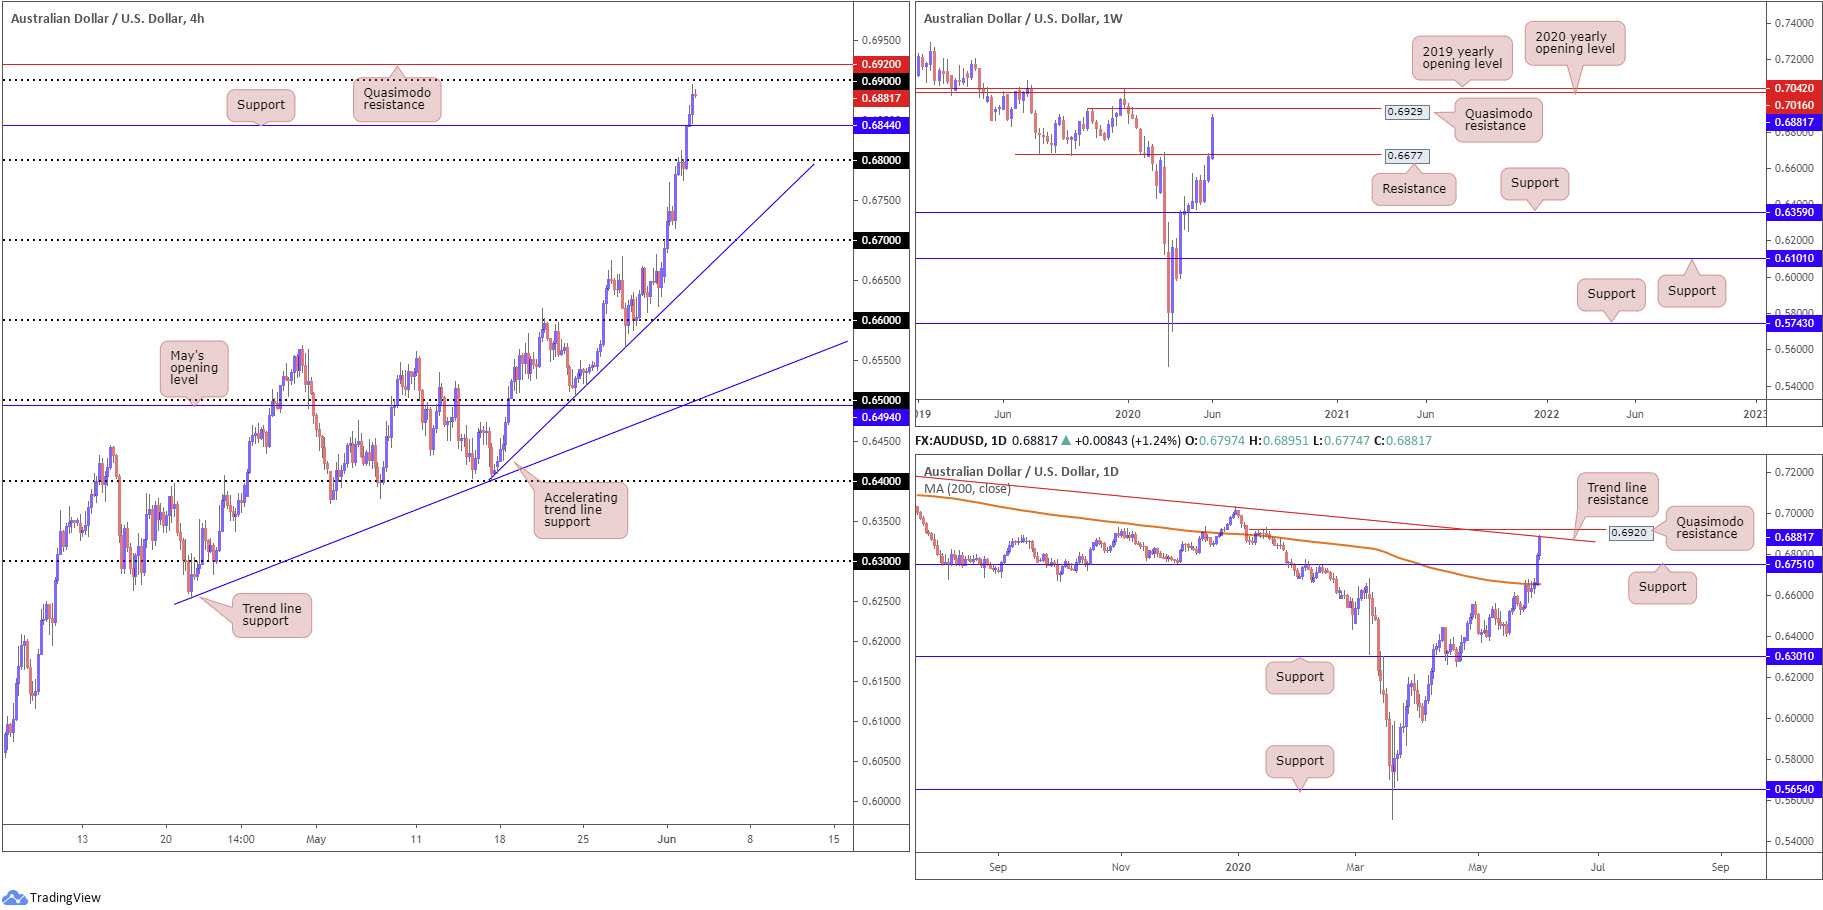
Risk flows continued to bolster AUD/USD Tuesday, lifting the pair north of H4 Quasimodo resistance at 0.6844 (now a serving support), and drawing the candles to highs at 0.6895 in recent trade. 0.69, along with a Quasimodo formation at 0.6920 (extended from mid-Jan), looms as possible resistance on the H4 scale today.
The technical landscape on the weekly timeframe, after engulfing resistance at 0.6677, throws Quasimodo resistance at 0.6929 in the pot as a feasible upside hurdle.
The story on the daily timeframe, however, following price tackling resistance at 0.6751 (now a serving support), has price action challenging trend line resistance, taken from the high 0.7393, with a break highlighting Quasimodo resistance plotted at 0.6920 (representing the same base as emphasised on the H4 chart).
Areas of consideration:
0.69 is particularly interesting resistance today. However, a fakeout scenario through the noted round number is also in the offing to weekly Quasimodo resistance at 0.6929 and H4/daily Quasimodo resistance at 0.6920. A H4 close back beneath 0.69 once price engages the aforementioned Quasimodo formations will likely be enough to tempt countertrend traders into the market, targeting H4 support at 0.6844 as an initial take-profit zone.
USD/JPY:
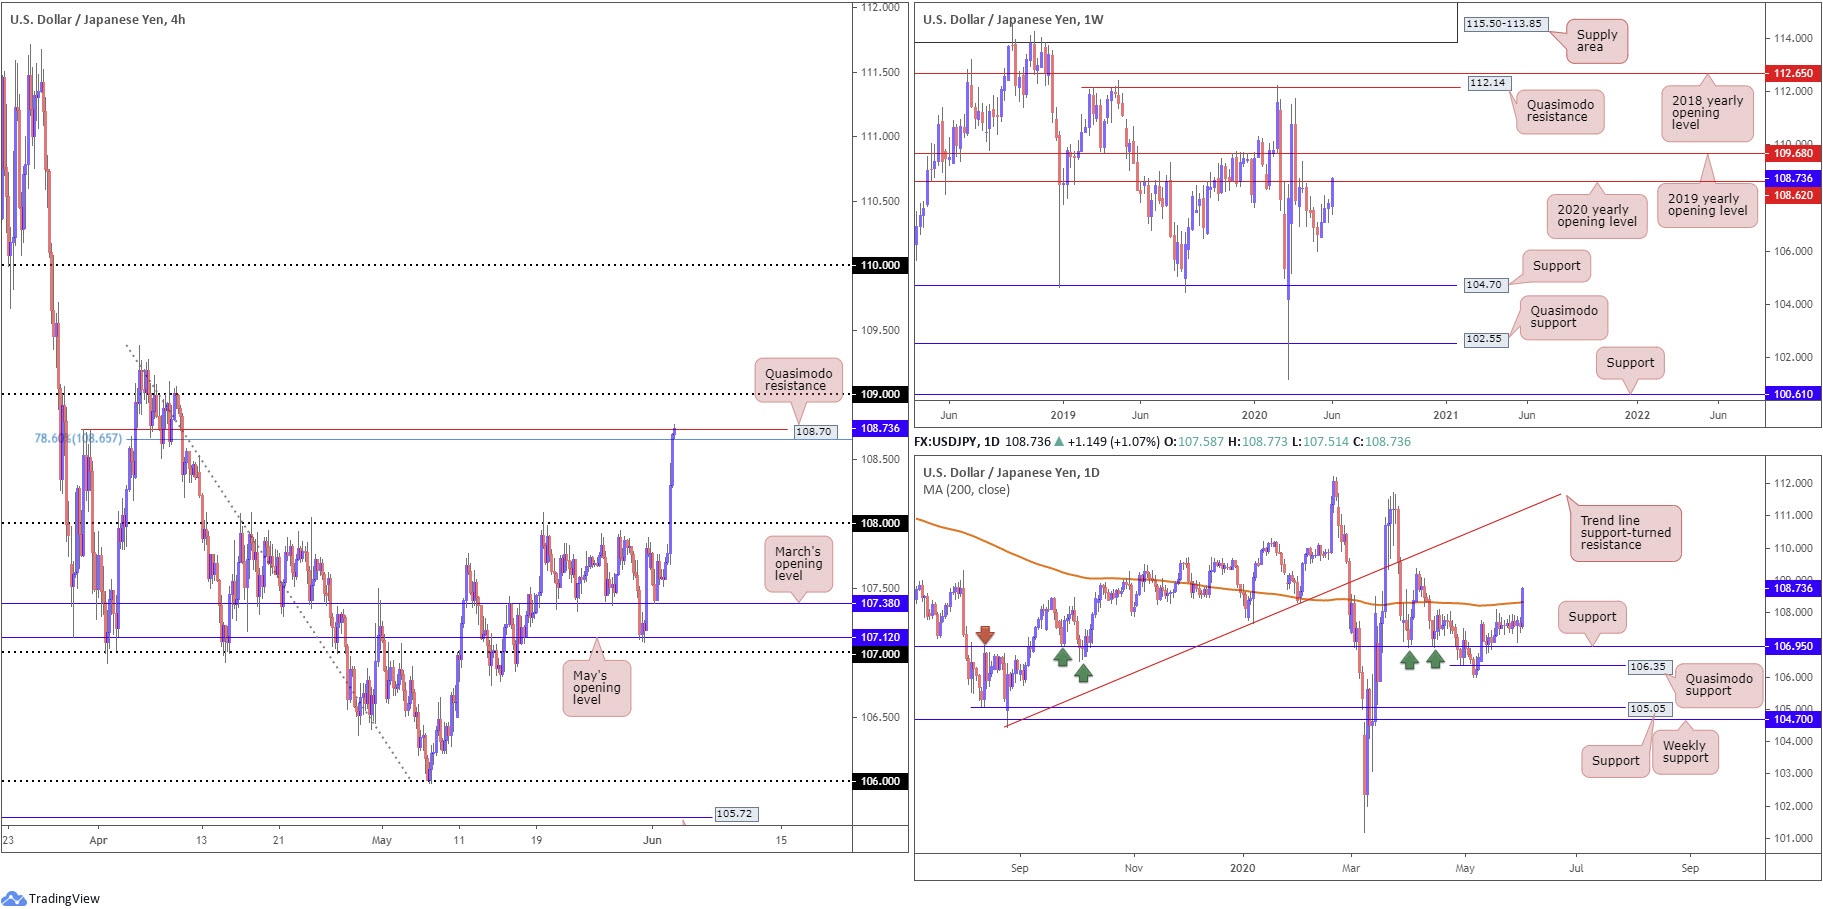
Yen underperformance witnessed USD/JPY stage an impressive one-sided advance Tuesday as global equities finished higher across the board. Risk-on flows drove H4 price through reasonably long-standing resistance at 108, shattering stops and clearing the river north to Quasimodo resistance at 108.70, coupled closely with a 78.6% Fibonacci retracement ratio at 108.65. Beyond this point, 109 echoes viable resistance, having capped upside in late March and early April.
Meanwhile, daily price overthrew its 200-day SMA (orange – 108.33) in dominant fashion yesterday, underlining a possible run to the 109.38 April 6 high. Higher up on the curve, we can see weekly price touching gloves with the 2020 yearly opening level coming in at 108.62, a level that held price lower in April by way of a shooting star candle pattern. Ousting sellers at 108.62, as you can see, shoves the 2019 yearly opening level at 109.68 into sight.
Areas of consideration:
H4 Quasimodo resistance at 108.70 is an interesting reversal point, given its close relationship with weekly resistance at 108.62 (the 2020 yearly opening level). Owing to the strong underlying bid in motion, though, visiting 109 on the H4 scale is certainly not out of the question before sellers attempt to make an appearance.
Should we unseat 109, on the other hand, bullish strategies may be in store to 109.38 (April 6 high), followed by weekly resistance at 109.68 (2019 yearly opening level).
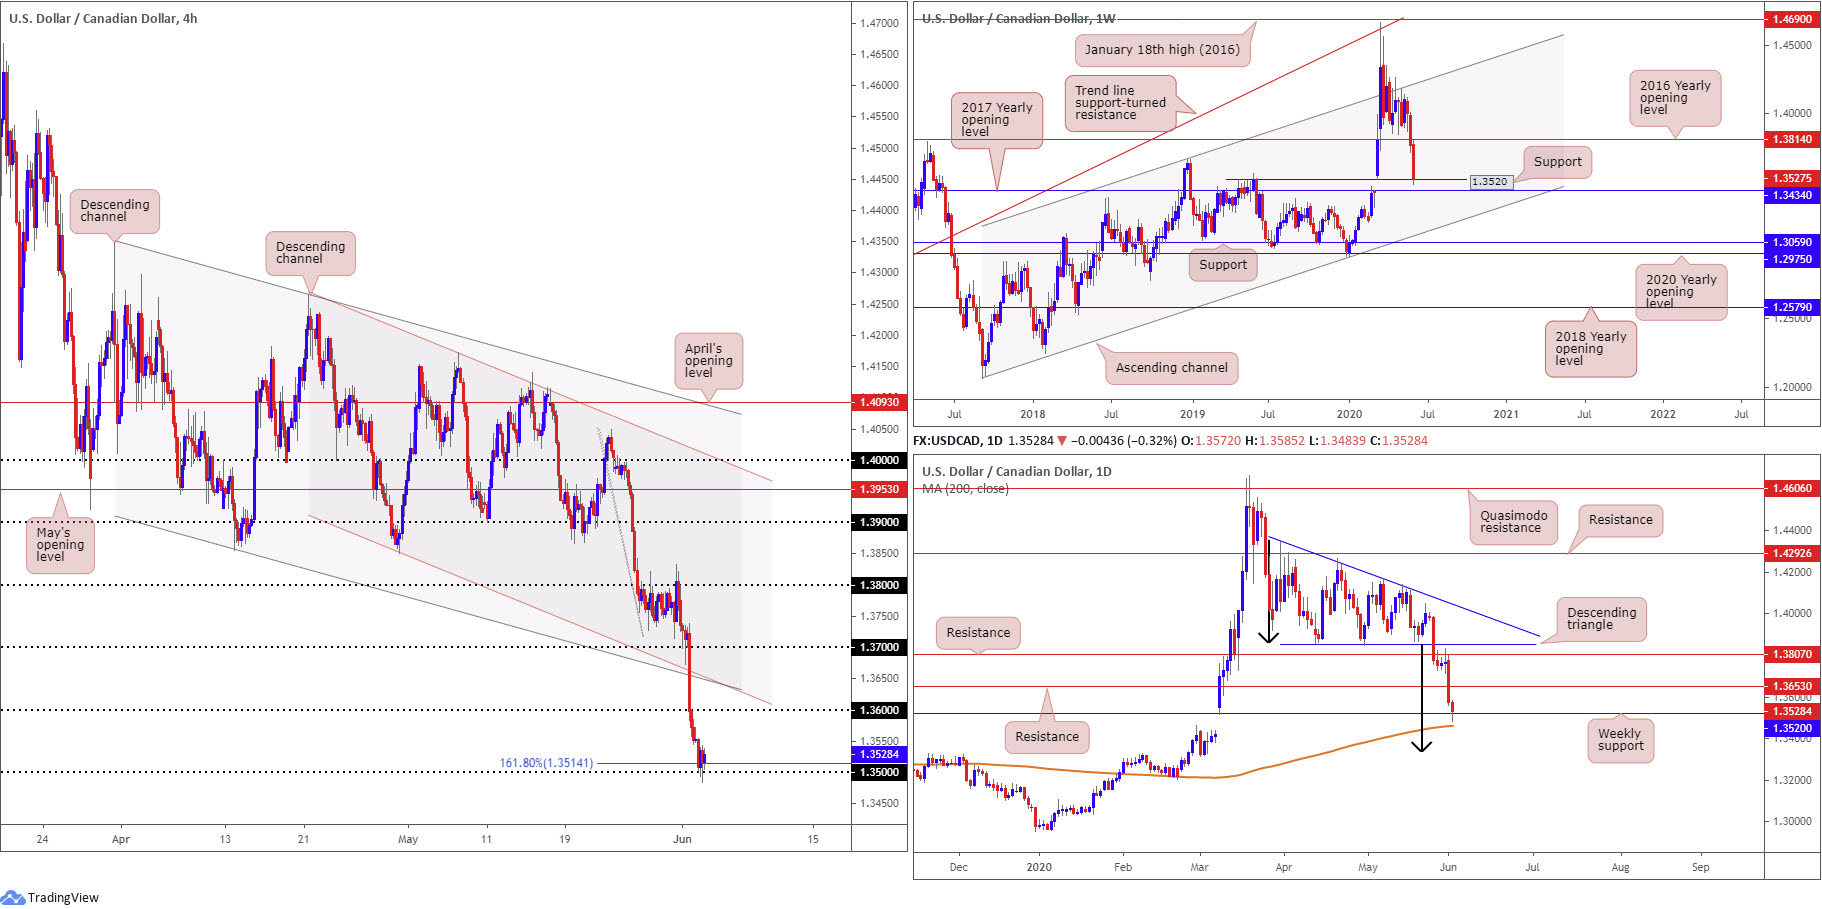
USD/CAD:
The US dollar nudged lower against the Canadian dollar for a second consecutive session Tuesday, amid persistent USD weakness and rising WTI prices.
Kicking things off from the weekly timeframe, technicians will note price welcomed support at 1.3520 (prior Quasimodo resistance level) in recent trading, a base sited just above the 2017 yearly opening level at 1.3434.
Elsewhere, daily movement also reveals price action crossing swords with weekly support mentioned above at 1.3520. Under current weekly support, you’ll see we have the 200-day SMA (1.3461) in sight, as well as the descending triangle’s take-profit base at 1.3332 (black arrows).
Areas of consideration:
For traders who read Tuesday’s technical briefing you may recall the following (italics):
Going forward, technical action emphasises the possibility of a recovery off weekly support at 1.3520, joined closely with H4 Quasimodo support at 1.3540 (level since removed), a 161.8% H4 Fibonacci extension point at 1.3514 and the 1.35 handle.
As evident from the chart, H4 activity is attempting to establish a bottom off 1.35, perhaps enough to spark a recovery back to 1.36 today?
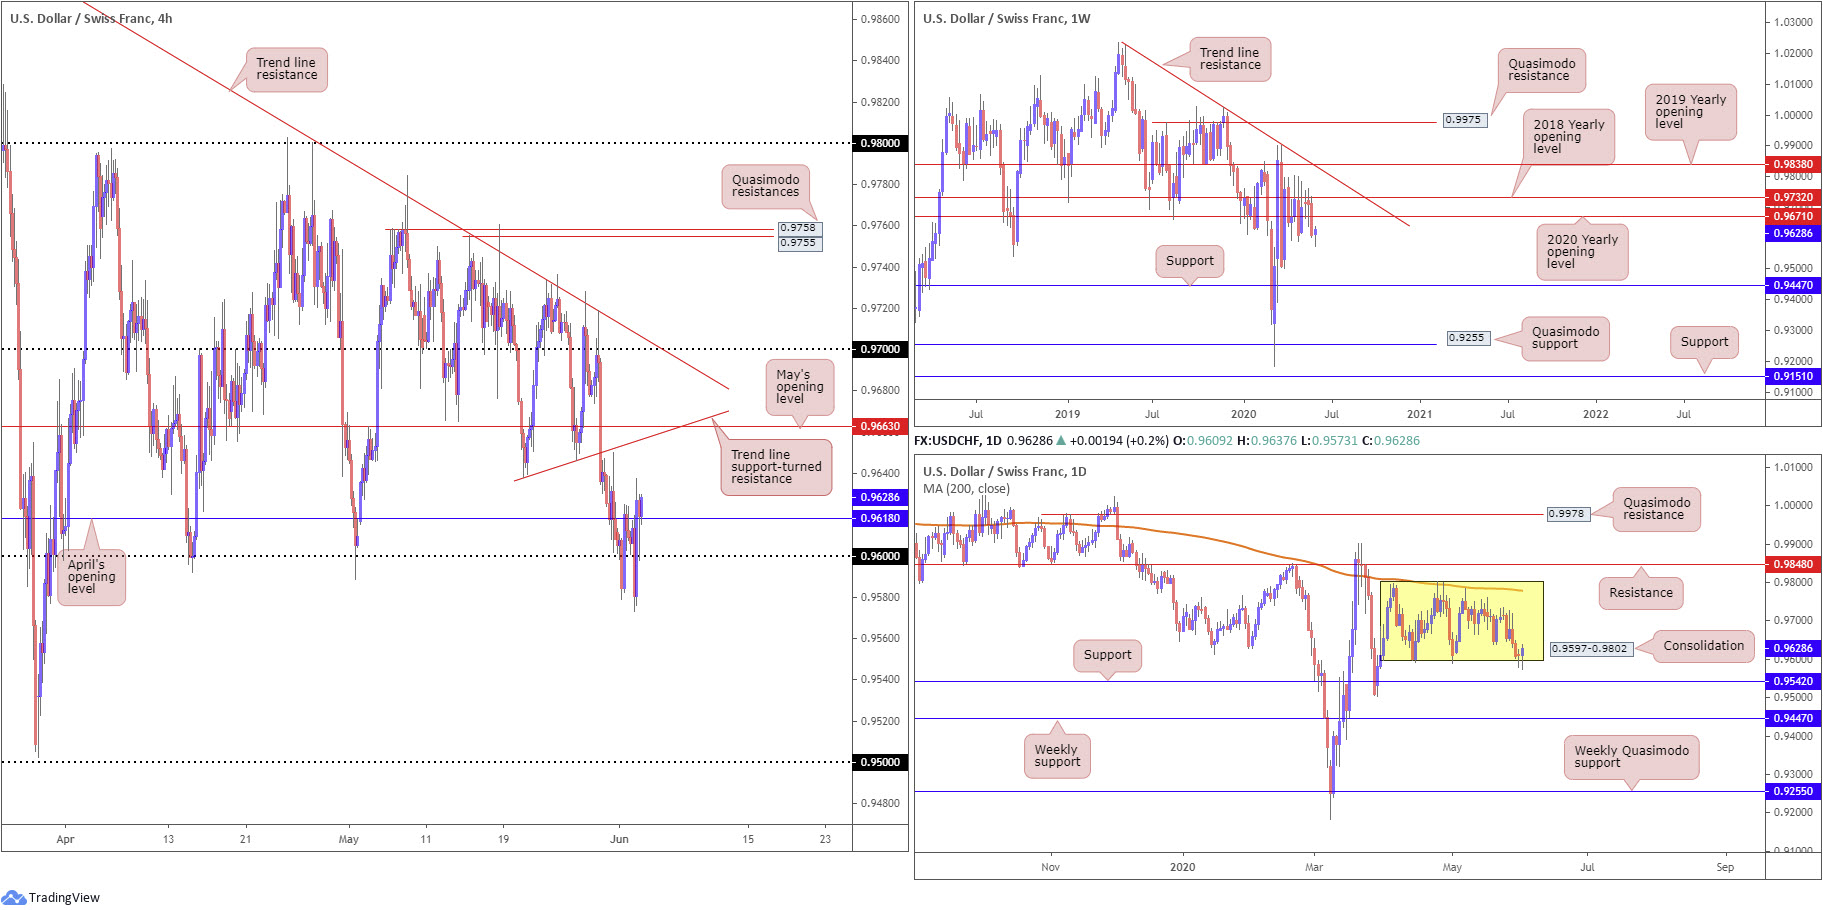
USD/CHF:
Broad USD downside on Tuesday forced another clear-cut bear trap on USD/CHF, running through orders at the 0.96 handle to lows at 0.9573. Upbeat risk sentiment, however, kept the pair above 0.96, sufficient to overrun April’s opening level at 0.9618. There’s potential for further upside north of 0.9618, according to chart studies, towards May’s opening level at 0.9663 and a local trend line support-turned resistance, taken from the low 0.9638.
Last week, on the weekly timeframe, observed a vigorous push to the downside, a move which ran through the 2020 yearly opening level at 0.9671, after failing to close above nearby resistance at 0.9732, the 2018 yearly opening level. Although a retest at 0.9671 could emerge, traders’ crosshairs will likely be fixed on support at 0.9447.
Since early April, price action on the daily timeframe has consolidated between 0.9802/0.9597, with Monday and Tuesday shaking hands with the lower boundary of the range and closing off worst levels. Traders may also want to acknowledge the 200-day SMA (orange – 0.9778) joins the upper border of the aforementioned consolidation. Outside, traders will note resistance rests at 0.9848 and support from 0.9542.
Areas of consideration:
The H4 close back above April’s opening level at 0.9618 on the H4 timeframe, knowing we’re also coming off daily range lows at 0.9597, could appeal to intraday buyers today, targeting May’s opening level at 0.9663 as an initial target.
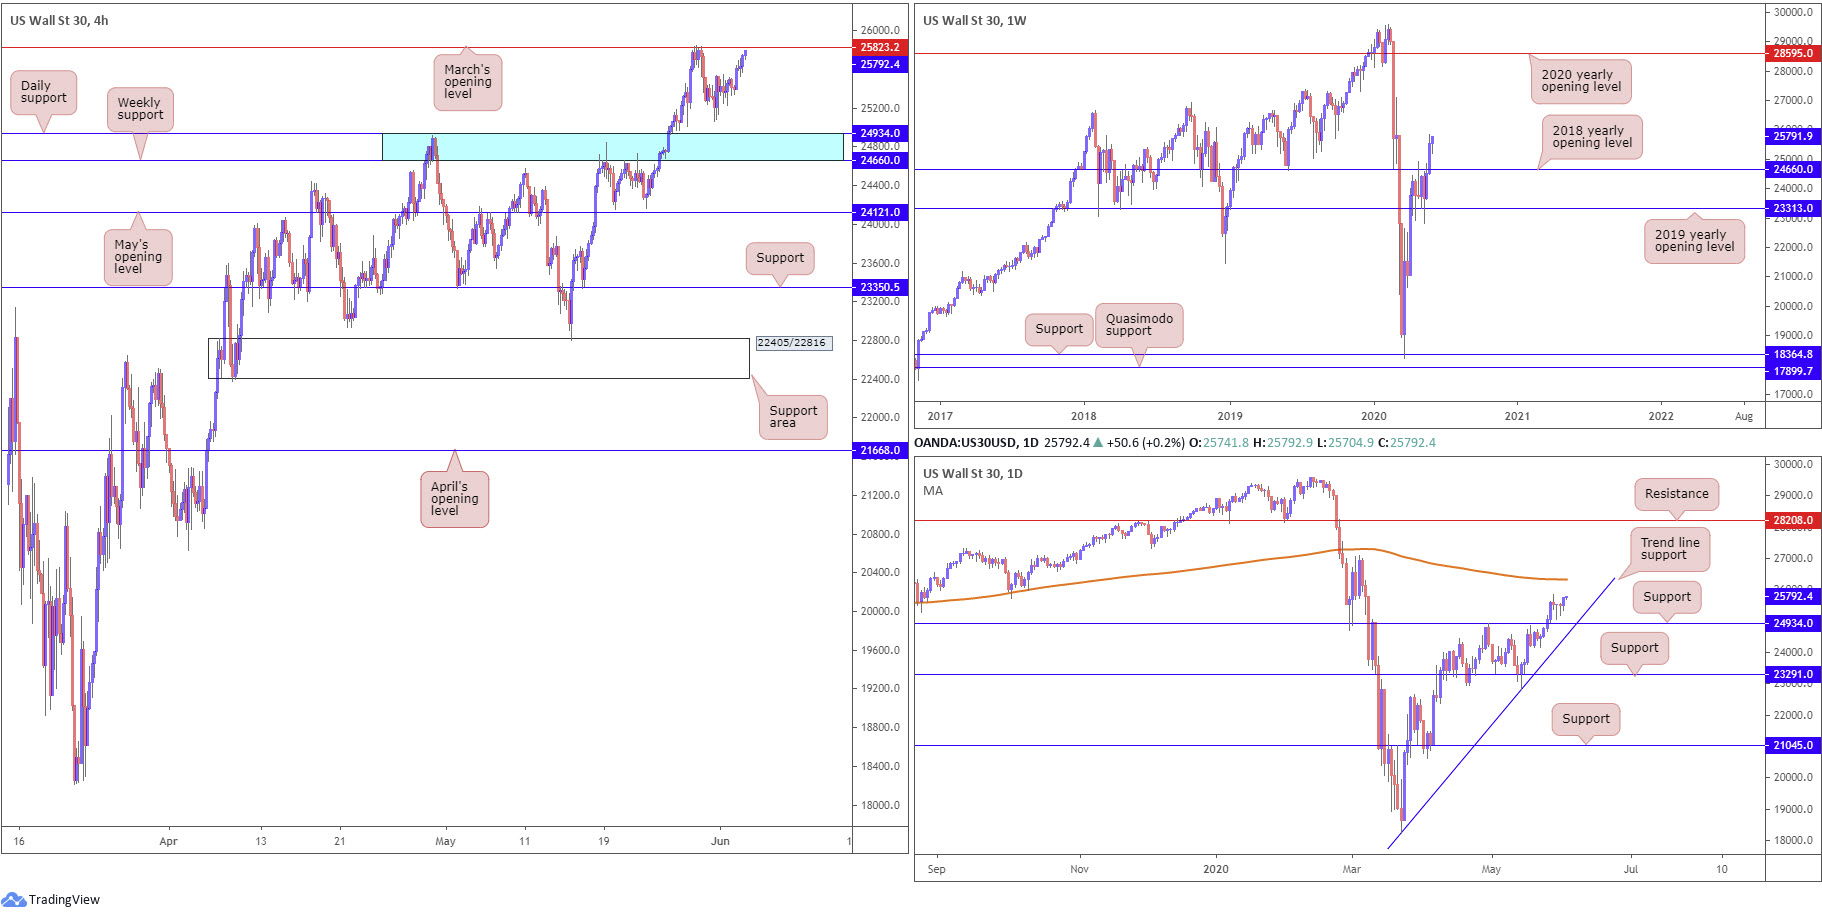
Dow Jones Industrial Average:
Despite continued unrest across the US, global equities finished higher across the board amid positive economic signals as coronavirus lockdowns ease. The Dow Jones Industrial Average climbed 267.63 points, or 1.05%; the S&P 500 added 25.09 points, or 0.82%, and the tech-heavy Nasdaq 100 concluded higher by 58.42 points, or 0.61%.
Leaving 24934/24660 unchallenged, a H4 zone comprised of a daily support level at 24934 and the 2018 yearly opening level on the weekly timeframe at 24660 (blue), the H4 candles are seen closing in on March’s opening level at 25823, with a break exposing a H4 resistance area coming in at 26885/26515.
From the weekly timeframe, the resurgence of bidding positions buyers in a fortunate position north of the 2018 yearly opening level at 24660. Sustained upside could eventually have the 2020 yearly opening level at 28595 emerge.
A closer reading of price action on the daily timeframe has the unit holding north of support at 24934, potentially seeking the 200-day SMA (orange – 26330) as the next upside target.
Areas of consideration:
Having seen both weekly and daily price in position to climb, it’s unlikely we’ll see much selling occur off March’s opening level at 25823 on the H4 timeframe. Buying north of the level, therefore, could be an option, targeting a H4 resistance area at 26885/26515, a zone located just above the 200-day SMA. Conservative breakout buyers may seek a retest at March’s opening level before taking action. This tends to help sidestep fakeouts.
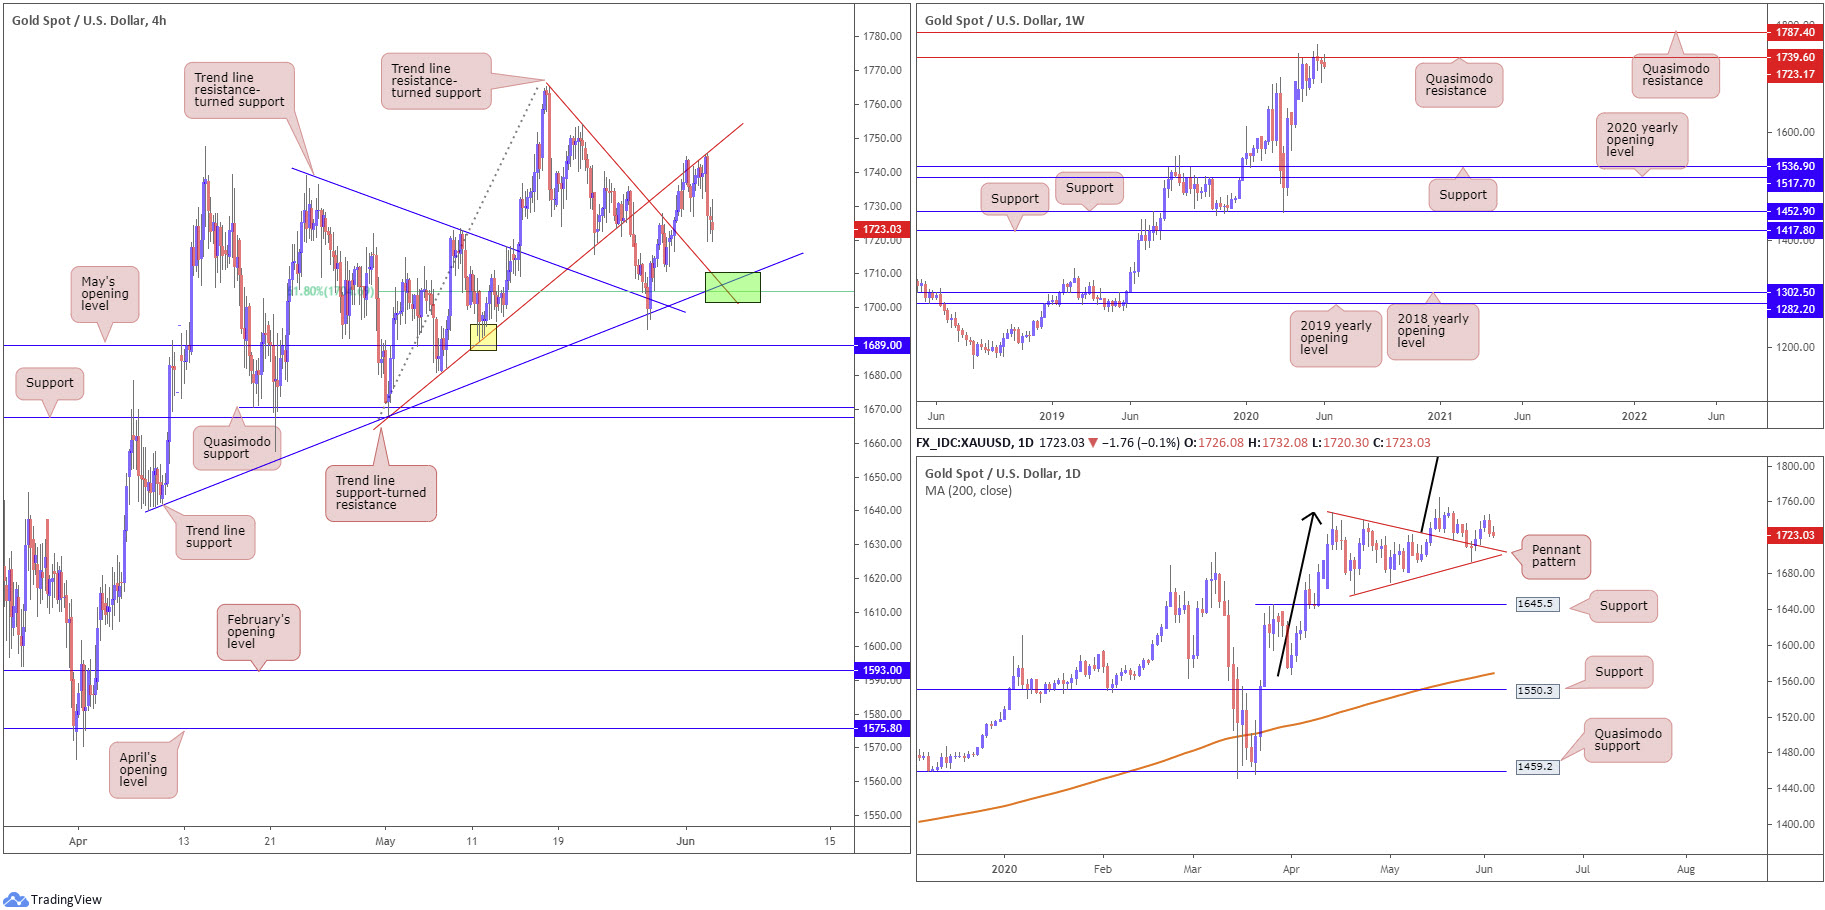
XAU/USD (GOLD):
The price of gold, in dollar terms, shed 0.8% on Tuesday, forming a bearish outside day configuration on the daily timeframe and snapping a three-day winning streak.
Technical action, based on the H4 timeframe, recently crossed swords with trend line support-turned resistance, taken from the low 1668.0. This, as noted in previous analysis, was an interesting trend line as it merges with weekly Quasimodo resistance at 1739.6. Yesterday’s decline positioned the H4 candles back within shouting distance of a trend line resistance-turned support, extended from the high 1765.1, a 61.8% Fibonacci retracement ratio at 1704.6 and a trend line support, from the low 1640.1.
Weekly price has remained capped under Quasimodo resistance at 1739.6 from mid-April. Clearance of 1739.6 underlines another layer of Quasimodo resistance at 1787.4. It may also interest some traders to note the trend on gold has faced a northerly trajectory since 2016.
The bullish pennant configuration on the daily timeframe, established from a high of 1747.7 and a low coming in from 1658.1, remains in play. Despite forming a bearish outside day pattern, buyers still have a hand in this fight. Take-profit targets out of pennant patterns are measured by taking the preceding move and adding the value to the breakout point (black arrows). This offers a sizeable take-profit, coming in at 1909.4.
Areas of consideration:
Although this would likely mean a second retest at the upper limit of the daily bullish pennant pattern, the H4 trend lines congregating around 1704.6ish (green) will likely appeal to buyers today. A long from this area, though in-line with the underlying trend and according to pattern structure on the daily timeframe, buyers must contend with weekly Quasimodo resistance at 1739.6.
The accuracy, completeness and timeliness of the information contained on this site cannot be guaranteed. IC Markets does not warranty, guarantee or make any representations, or assume any liability regarding financial results based on the use of the information in the site.
News, views, opinions, recommendations and other information obtained from sources outside of www.icmarkets.com.au, used in this site are believed to be reliable, but we cannot guarantee their accuracy or completeness. All such information is subject to change at any time without notice. IC Markets assumes no responsibility for the content of any linked site.
The fact that such links may exist does not indicate approval or endorsement of any material contained on any linked site. IC Markets is not liable for any harm caused by the transmission, through accessing the services or information on this site, of a computer virus, or other computer code or programming device that might be used to access, delete, damage, disable, disrupt or otherwise impede in any manner, the operation of the site or of any user’s software, hardware, data or property.


