
A note on lower timeframe confirming price action…
Waiting for lower timeframe confirmation is our main tool to confirm strength within higher timeframe zones, and has really been the key to our trading success. It takes a little time to understand the subtle nuances, however, as each trade is never the same, but once you master the rhythm so to speak, you will be saved from countless unnecessary losing trades. The following is a list of what we look for:
- A break/retest of supply or demand dependent on which way you’re trading.
- A trendline break/retest.
- Buying/selling tails/wicks – essentially we look for a cluster of very obvious spikes off of lower timeframe support and resistance levels within the higher timeframe zone.
- Candlestick patterns. We tend to only stick with pin bars and engulfing bars as these have proven to be the most effective.
We search for lower timeframe confirmation between the M15 the H1 timeframes, since most of our higher-timeframe areas begin with the H4. Stops are usually placed 5-10 pips beyond confirming structures.
EUR/USD:
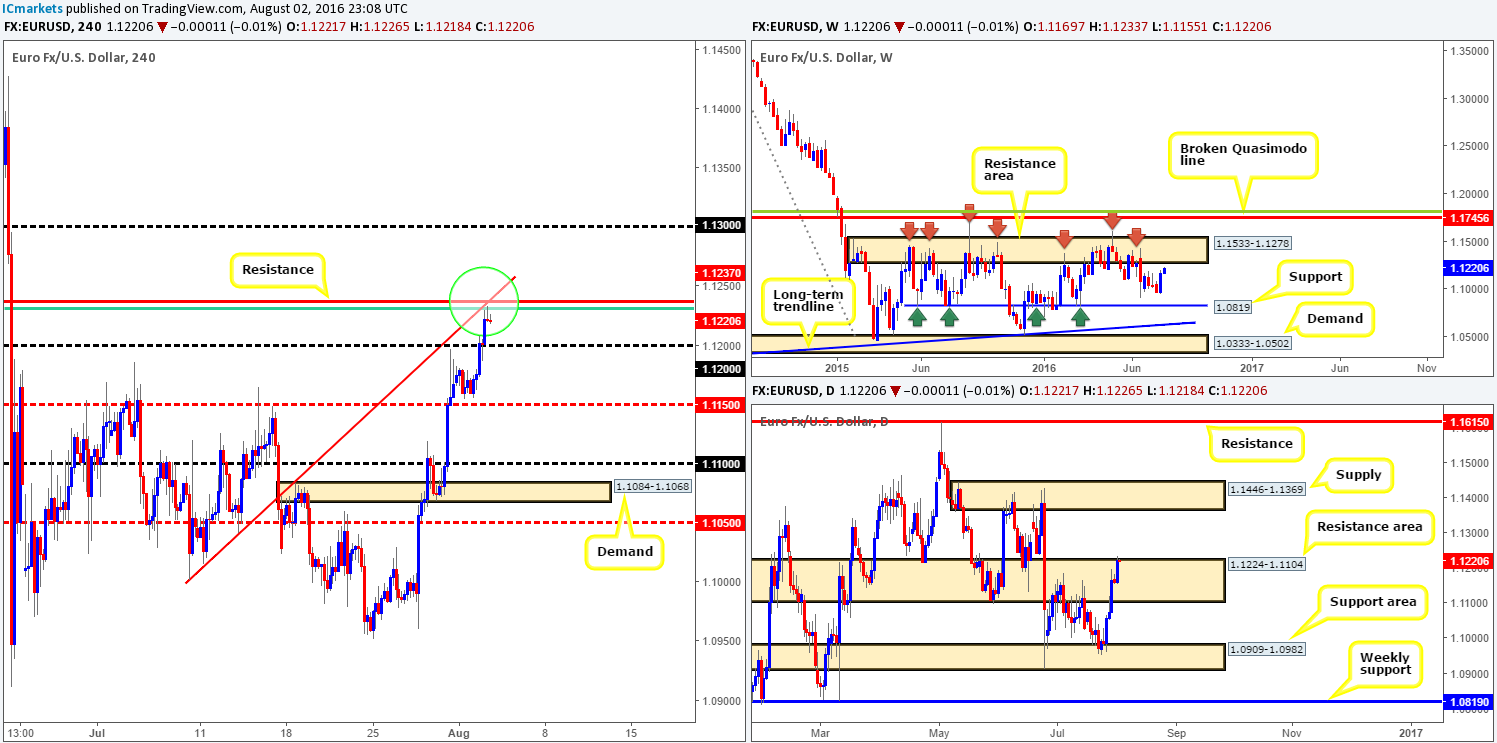
With the US dollar taking a beating across the board yesterday, the shared currency pressed higher. The 1.12 handle, as you can see, was taken out allowing price to connect with the H4 61.8% Fib at 1.1231 going into the American session. This barrier – coupled with a H4 resistance line at 1.1237 and a H4 trendline swap taken from the low 1.1069 (green circle) is currently holding the EUR lower, and may bounce price back down to the 1.12 region today.
Why only a bounce? Well, look across to the daily chart. This H4 level is positioned ABOVE a daily resistance area at 1.1224-1.1104. The small break above this zone may attract breakout buyers into the market thus potentially pushing this pair higher. More importantly, however, up on the weekly chart weekly price appears to be heading in the direction of a long-term weekly resistance zone at 1.1533-1.1278, which also could attract further buying.
Our suggestions: While H4 technicals indicate selling may be something to consider, our team remains wary due to the weekly picture (see above). With that in mind, remaining flat until more conducive price action presents itself is the route we’ve chosen to take…
Levels to watch/live orders:
- Buys: Flat (Stop loss: N/A).
- Sells: Flat (Stop loss: N/A).
GBP/USD:
Bolstered by better than expected UK construction data and an overall weaker dollar, the GBP bulls went on the offensive yesterday. Consequent to this, H4 supply at 1.3290-1.3242 (now acting demand) was engulfed, and as a result has possibly cleared the path north up the 1.34 region.
While the break above the H4 supply was strong, buying right now is difficult. Not only is cable now flirting with the underside of a H4 trendline swap extended from the low 1.3064, but there’s also the 1.34 level to contend with, followed by a daily supply just drawn from 1.3533-1.3426 (glued to the underside of a weekly resistance area at 1.3501-1.3804).
With the above in mind, one can also say selling is just as challenging. A sell from current prices would not place one in a favorable position in regard to risk/reward, as the recently broken H4 supply is likely to assume form of demand! And let’s not forget that you’d be selling ahead of daily supply, thus increasing the chances of being stopped out since price will likely want to connect with this region sometime soon.
Our suggestions: As far as we can see, technical elements are mixed at the moment leaving us with little choice but to remain flat for now.

Levels to watch/live orders:
- Buys: Flat (Stop loss: N/A).
- Sells: Flat (Stop loss: N/A).
AUD/USD:
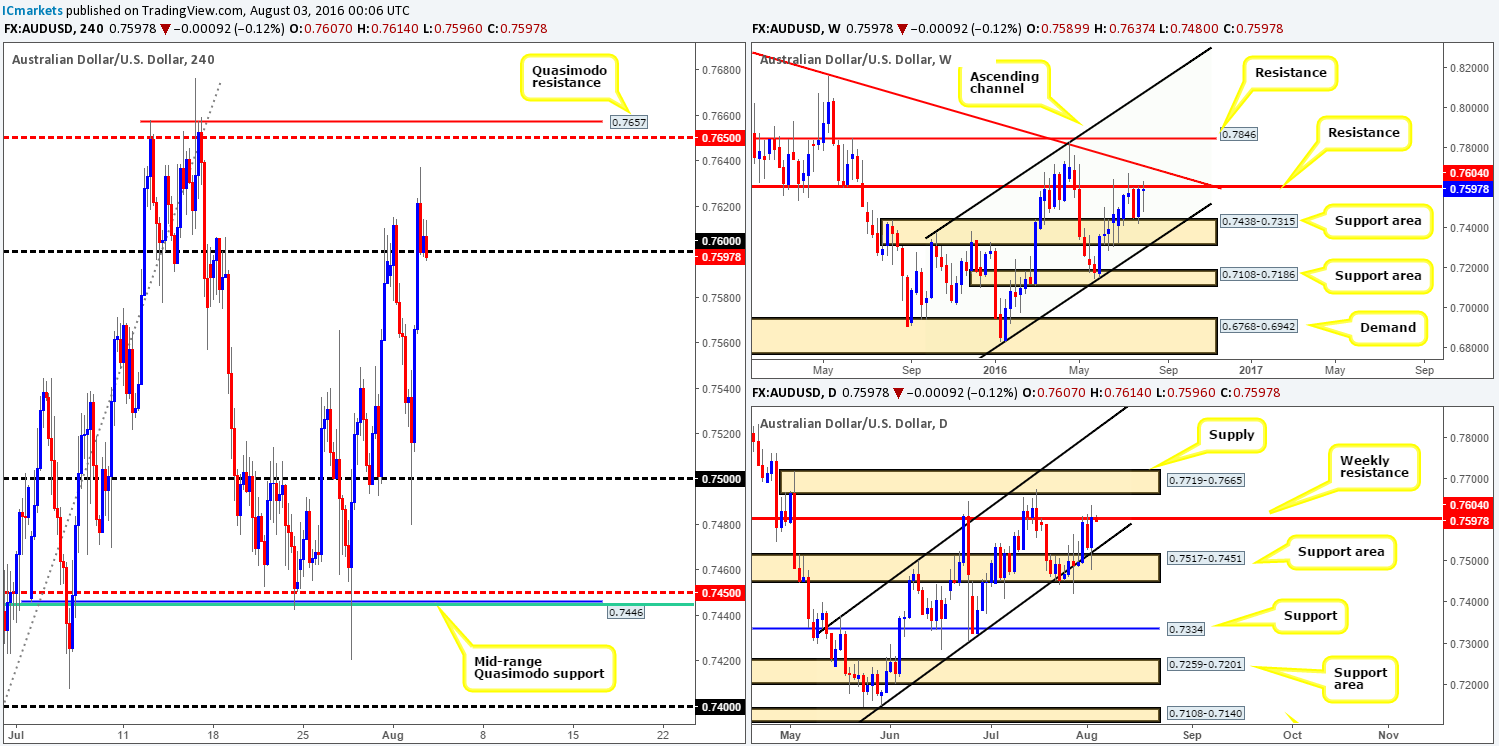
Starting from the daily chart this morning, we can see that the commodity-linked currency aggressively rebounded from the daily support area at 0.7517-0.7451 yesterday (bolstered by a daily channel support line extended from the low 0.7148), lifting the pair back up to the weekly resistance level given at 0.7604.
Technically speaking, a rotation from this region is likely. One only has to look at the history surrounding this weekly line to see its significance. However, as can be seen from the H4 chart, the Aussie is currently finding support at the 0.76 handle, so selling now may not be a good move. A more conservative approach might be to wait for price to close below 0.76. That way, traders can look to trade any retest seen to the underside of this number, targeting the 0.75 region. Of course, it would be down to the individual trader if he/she believes whether lower timeframe confirmation is required or not following a retest. For us personally, we don’t think it’s necessary simply because the 0.76 handle fuses so beautifully with the above said weekly resistance hurdle.
Levels to watch/live orders:
- Buys: Flat (Stop loss: N/A).
- Sells: Watch for price to close below the 0.76 handle and look to trade any retest seen thereafter (lower timeframe confirmation required).
USD/JPY:
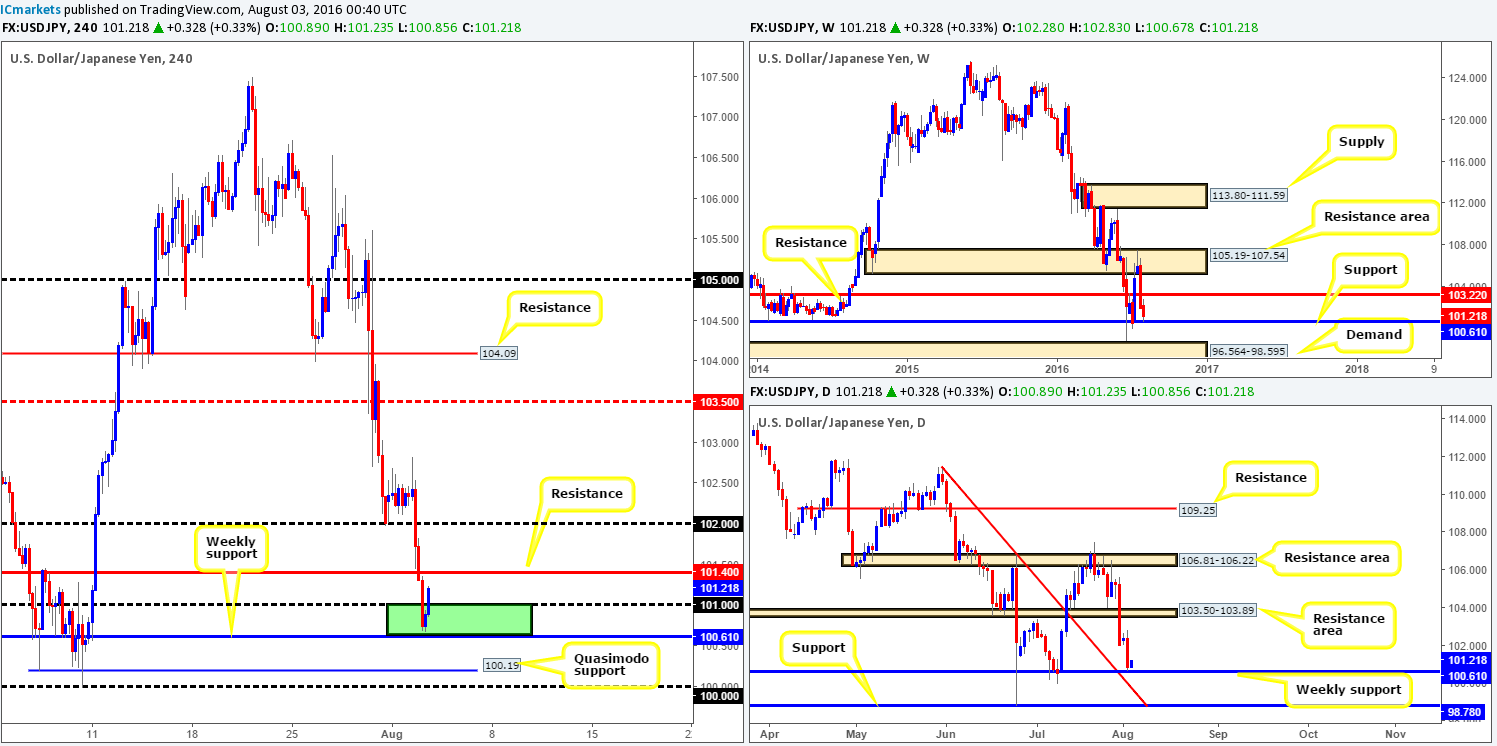
The sell-side of this market continued to weigh down on this pair yesterday, consequently clearing out bids from the 102 handle and the H4 support at 101.40, before finally testing the 100.61/101 region (green area). For those who read yesterday’s report you may recall us mentioning to be prepared for further selling. What we also mentioned was that should price reach 101, all short positions will be liquidated and longs would be the next objective. The reason being is 101 is bolstered by a weekly support just below it at 100.61, forming a nice-looking buy zone
We unfortunately missed this move from the above said buy area. Well done to any of our readers who managed to catch it! The real test for this market now, however, is the recently broken H4 support-turned resistance at 101.40. A close above here will, in our opinion, confirm bullish strength from the H4 buy zone and likely attract further buying up to 102.
Our suggestions: Watch for price to close above 101.40. This – coupled with a retest and a lower timeframe buy signal (see the top of this report) would be sufficient enough for us to buy this this pair, targeting the 102 as an initial take-profit target.
Levels to watch/live orders:
- Buys: Watch for price to close above the H4 resistance line at 101.40 and look to trade any retest seen thereafter (lower timeframe confirmation required).
- Sells: Flat (Stop loss: N/A).
USD/CAD:
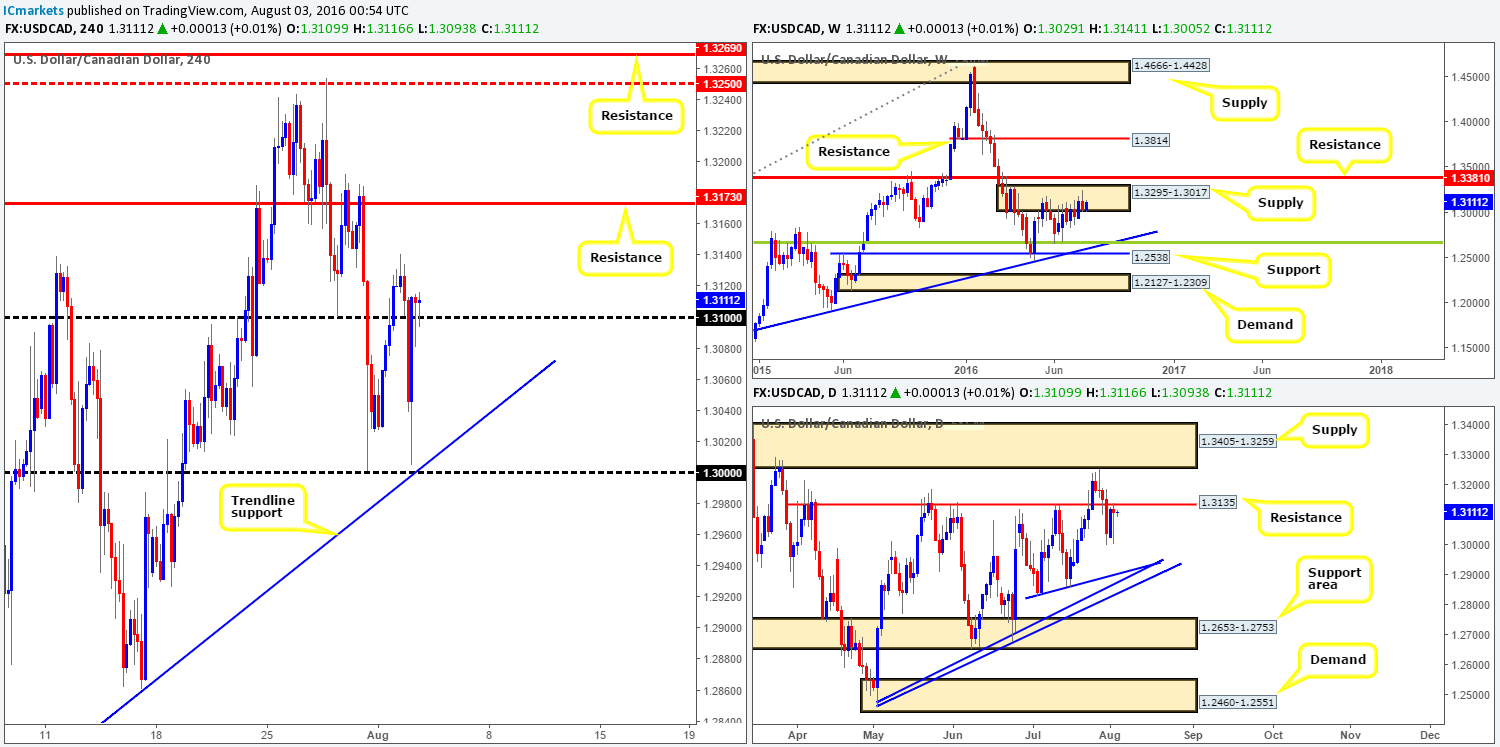
In view of weekly price, the buyers and sellers remain battling for position within the weekly supply zone carved from 1.3295-1.3017. Providing that the sellers can overthrow the buyers here, the next downside target can be seen at a weekly trendline support extended from the high 1.1278, which coincides with a weekly 38.2% Fib support at 1.2661 (taken from the low 0.9406). Jumping down to the daily chart, the loonie continues to kiss the underside of a daily resistance line given at 1.3135. This effectively could help push the pair lower from the above said weekly supply zone.
While higher-timeframe structure suggests lower prices may be on the cards, the H4 chart shows price finding support around the 1.31 handle. However, would you want to buy from here knowing there’s a truckload of higher-timeframe resistances above? We wouldn’t!
Our suggestions: Watch for the unit to close below 1.31. This – coupled with a retest to the underside of this number would, in our estimation, be sufficient enough to condone a short position, targeting the key figure 1.30.
Levels to watch/live orders:
- Buys: Flat (Stop loss: N/A).
- Sells: Watch for price to close below the 1.31 handle and look to trade any retest seen thereafter (lower timeframe confirmation required).
USD/CHF:
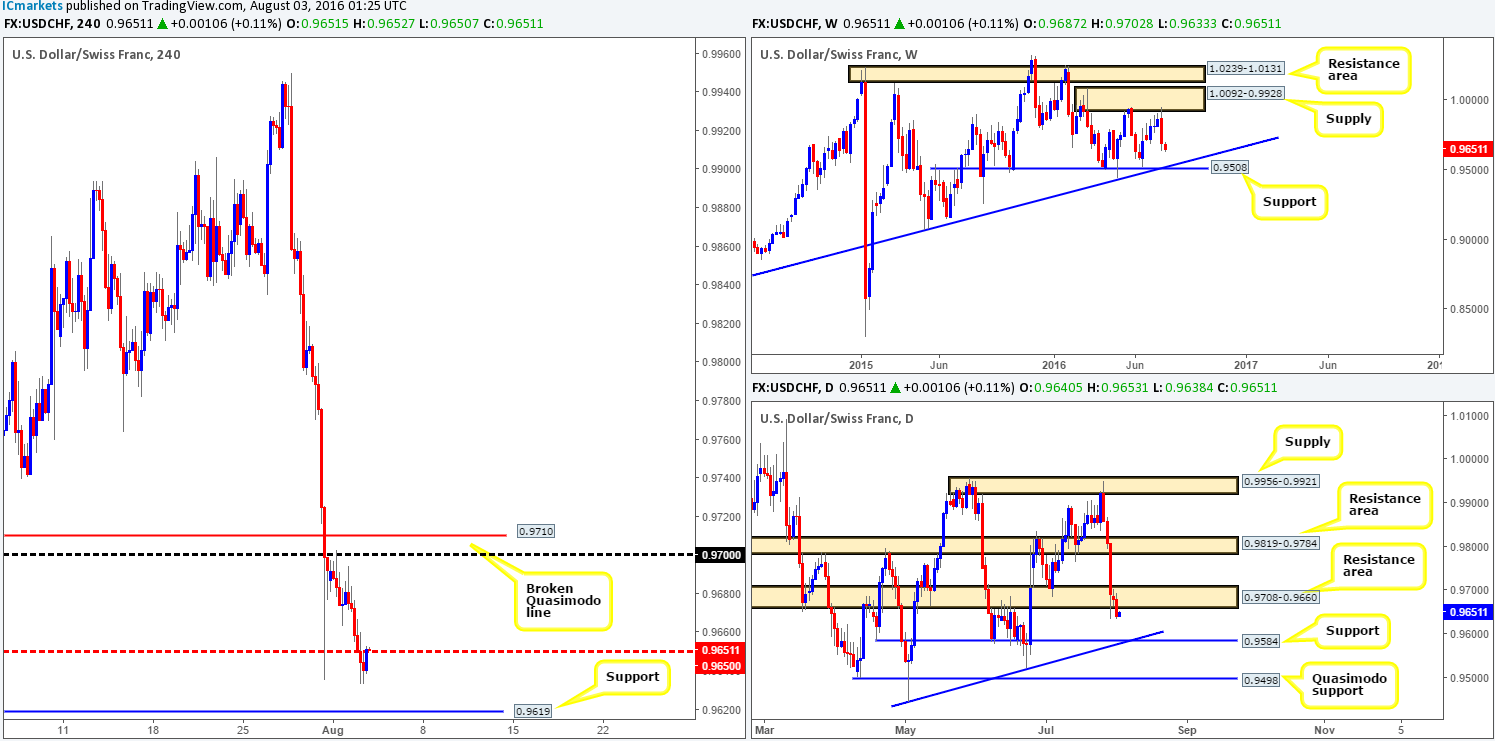
With the EUR/USD recently clocking fresh highs, it was no surprise to see the USD/CHF stretching lower. Yesterday’s downward move marks the fifth consecutive bearish day for this pair! Not only did this take out the H4 mid-way support line at 0.9650, but it also walloped through a daily support area at 0.9708-0.9660 (now acting resistance).
Given that weekly action looks all set to continue driving lower down to weekly support at 0.9508 (intersects with a weekly trendline support extended from the low 0.8703), further downside, in our opinion, is the more logical route.
Our suggestions: look to short the 0.9660/0.9650 (H4 mid-way resistance/underside of daily resistance area) today, targeting H4 support at 0.9619, followed by the 0.96 handle and then with a little bit of luck, the daily support level at 0.9584 (merges with a daily trendline support taken from the low 0.9443). We would recommend waiting for lower timeframe confirmation to form prior to pulling the trigger here, since the Swissy could potentially drive higher into the aforementioned daily resistance area before deciding to turn lower!
Levels to watch/live orders:
- Buys: Flat (Stop loss: N/A).
- Sells: 0.9650/0.9660 region [Tentative – confirmation required] (Stop loss: dependent on where one confirms this area).
DOW 30:
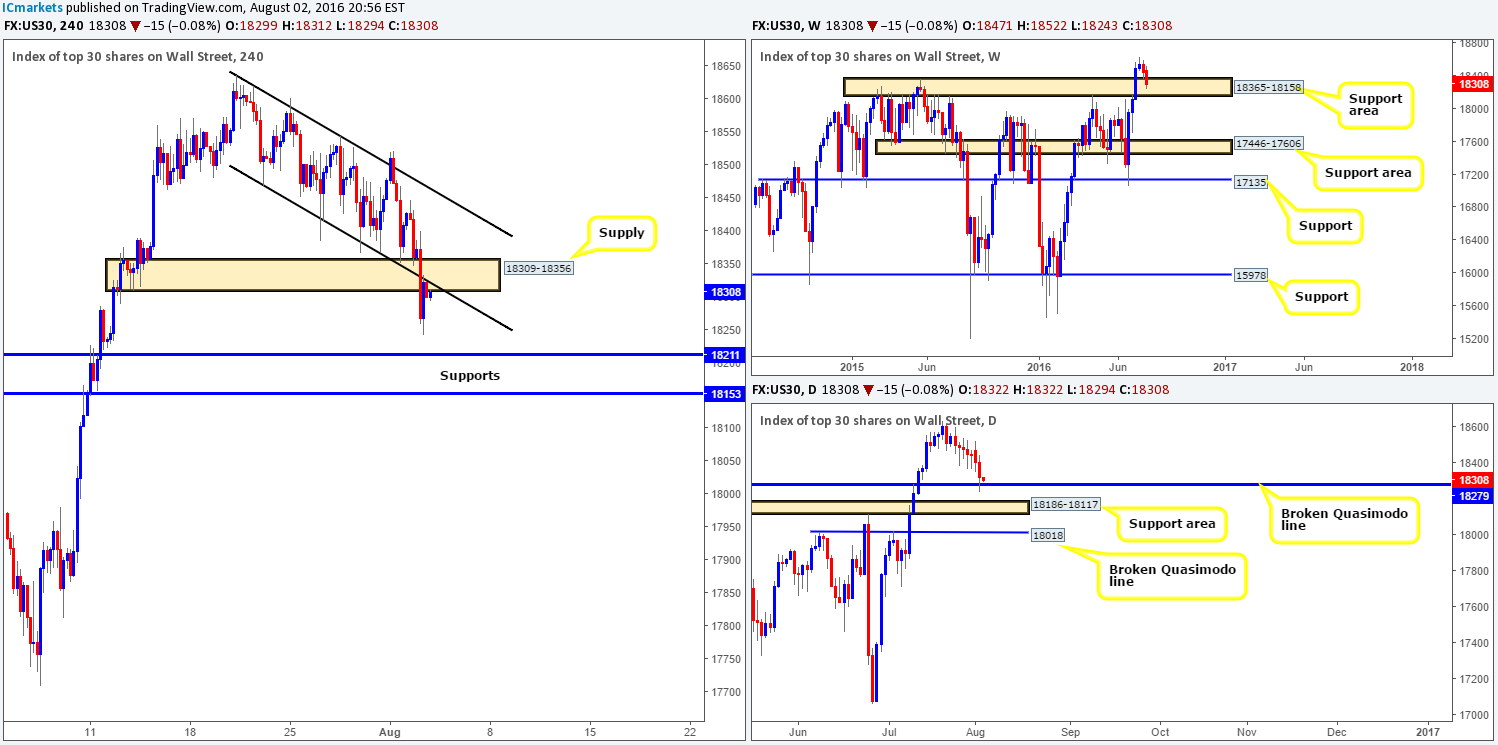
US stocks continued to fall during yesterday’s sessions, taking out both the H4 demand base at 18309-18356 (now acting supply) and a H4 channel support extended from the low 18468 (also now acting resistance). What this did, as you can see from the daily chart, was allow price to tag in bids at a daily broken Quasimodo line at 18279, which is lodged within a weekly support area coming in at 18365-18158.
Ultimately, what our team is watching for now is a close back into the current H4 channel. Breaking into this area would, as far as we can see, confirm buying strength from both the aforementioned daily broken Quasimodo line and the weekly support area. Therefore, should this come to fruition and price goes on to retest the lower H4 channel support, we would, dependent on the time of day, consider looking to jump in long here, targeting the upper edge of the H4 channel taken from the high 18636.
Levels to watch/live orders:
- Buys: Watch for price to close back into the H4 channel and look to trade any retest seen thereafter (lower timeframe confirmation required).
- Sells: Flat (Stop loss: N/A).
GOLD:
Looking at the weekly chart this morning, price is now seen shaking hands with a weekly Quasimodo resistance level coming in at 1361.7. This line, as is shown on the chart, capped upside three weeks ago and dragged the commodity down to lows of 1310.7. Will history repeat itself here?
Despite weekly action re-establishing itself around a weekly Quasimodo level, daily price recently took out a daily resistance level penciled in at 1354.6, thus potentially opening the path north for further upside to a daily Quasimodo resistance barrier coming in at 1375.1.
In that the H4 chart also shows room to climb up to the aforementioned daily Quasimodo resistance, we feel that the yellow metal will attack this line before serious sellers step in. However, the other key thing to note here is that a pullback to retest the recently broken H4 supply-turned demand at 1357.5-1353.1 may take place beforehand.
Our suggestions: From our perspective, waiting for price to connect with the above said daily Quasimodo resistance line before looking to take shorts from the aforementioned weekly Quasimodo resistance might be the better path to take. As we mentioned above, three weeks ago price sold off from this weekly level, BUT not before faking above to the daily Quasimodo barrier! Dependent on the time of day, our team might consider taking a market short from this daily barrier, with stops placed above the apex high of the daily Quasimodo formation 1391.9.

Levels to watch/live orders:
- Buys: Flat (Stop loss: N/A).
- Sells: 1375.1 [Dependent on the time of day, a market short may be possible from here] (Stop loss: Place above the apex high 1391.9).


