
DXY:
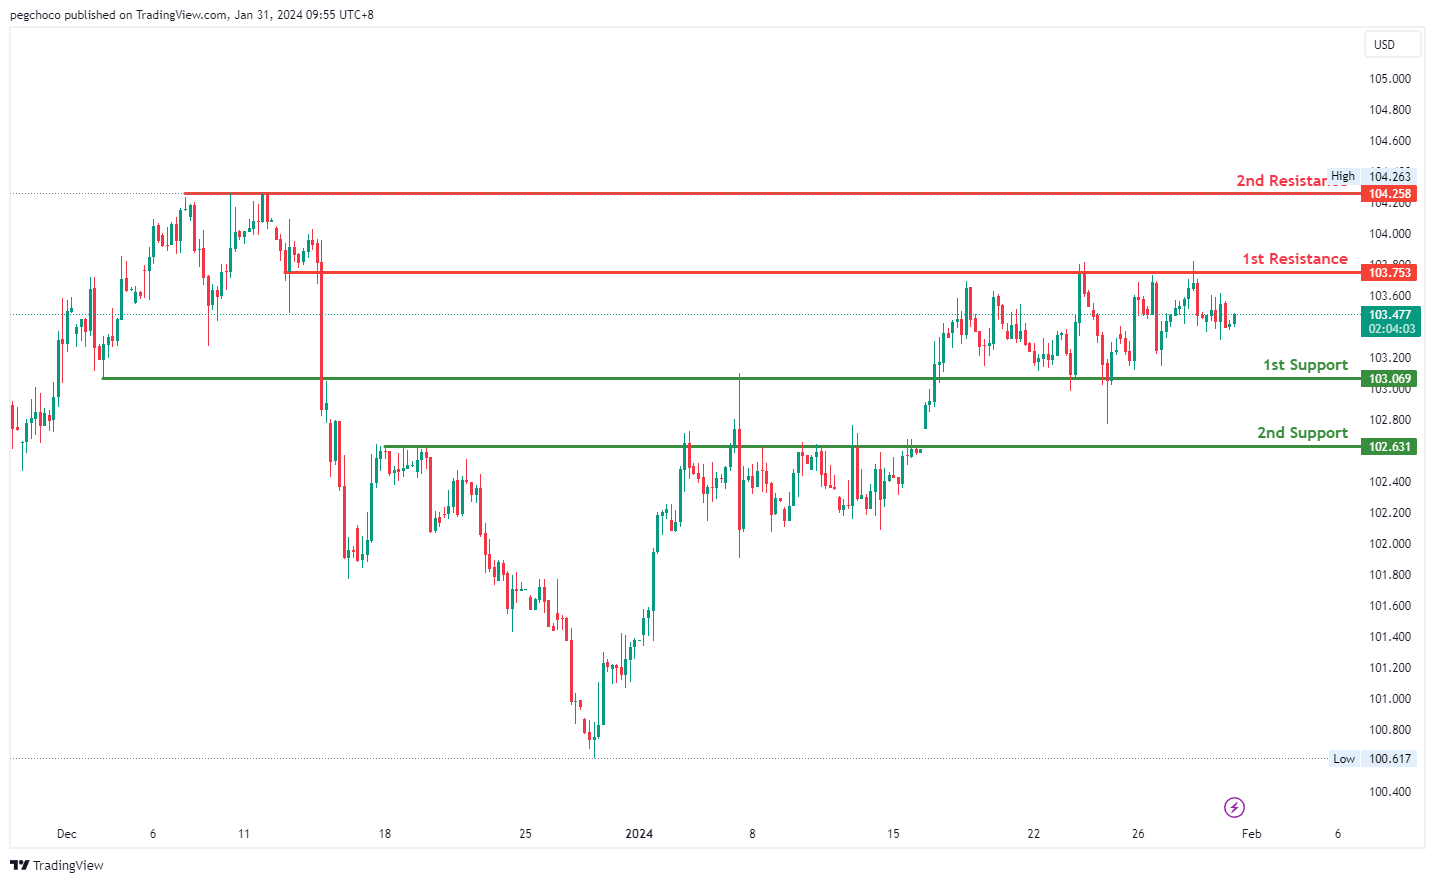
The analysis of the DXY (US Dollar Index) chart suggests a neutral overall momentum, indicating a lack of a clear trend direction at the moment. Given this neutral stance, there is a potential scenario where the price could fluctuate within a range defined by the 1st support and 1st resistance levels.
The 1st support level at 103.06 is categorized as an overlap support. Such levels often have historical significance and can attract buying interest when the price approaches them. It represents a potential support zone in the event of a price decline.
Additionally, the 2nd support level at 102.63 is identified as a pullback support. This level may also act as a support zone and is associated with the 38.20% Fibonacci Retracement, further emphasizing its potential significance.
On the resistance side, the 1st resistance level at 103.75 is described as an overlap resistance. This level represents a historical point where the price has encountered resistance in the past. Traders should watch this level closely as it may serve as a barrier to further upward movement.
The 2nd resistance level at 104.25 is marked as a multi-swing high resistance. This indicates that it is another historical level where the price has faced resistance. It can be considered a significant area of potential resistance in the event of an upward price movement.
EUR/USD:
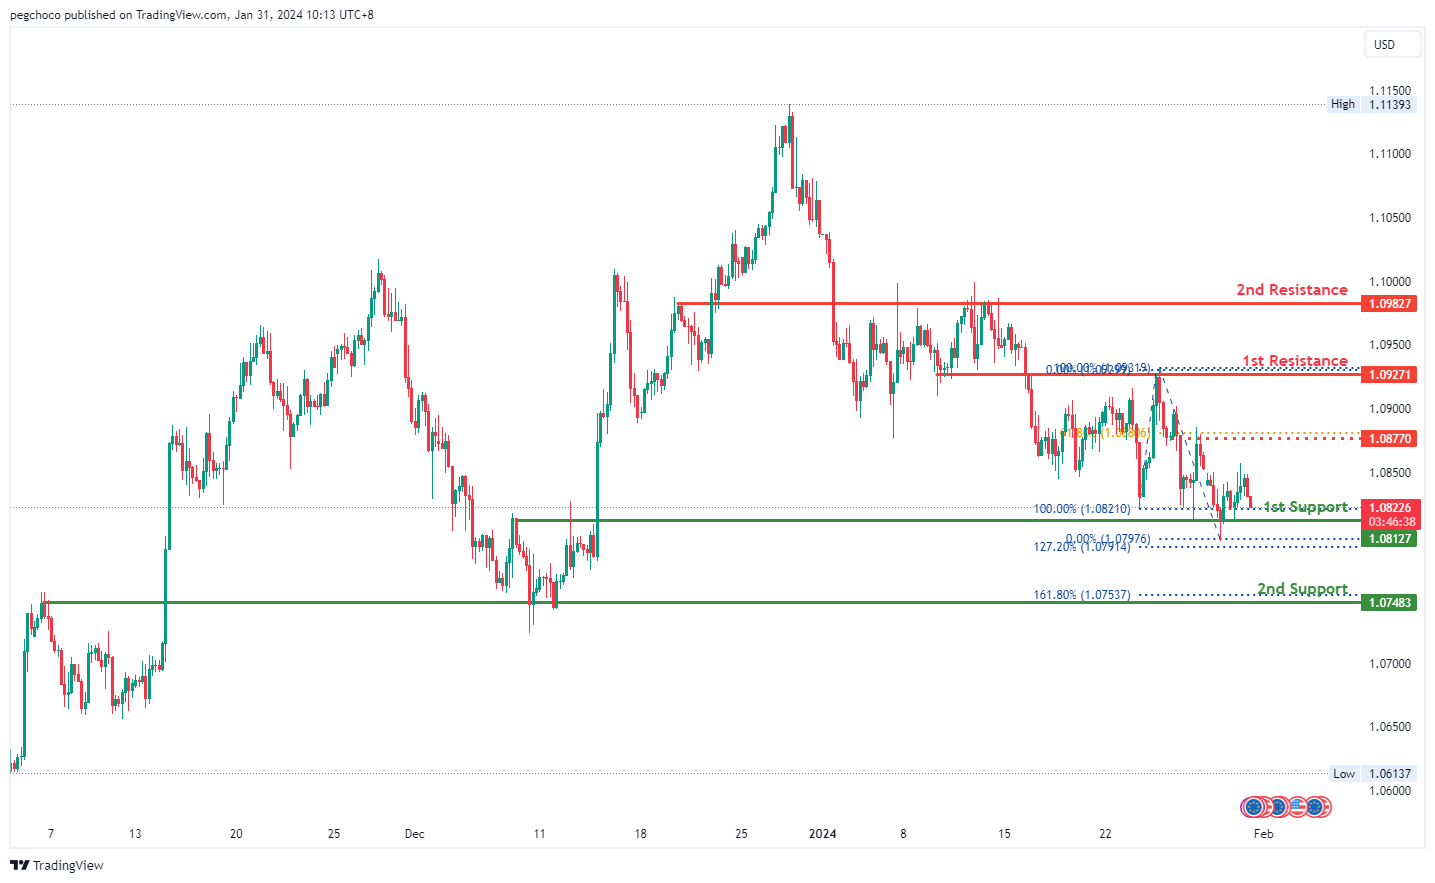
The EUR/USD chart currently exhibits a bearish overall momentum, indicating a downward trend. According to your analysis, the price could potentially continue its bearish movement towards the 1st support level.
The 1st support level at 1.0812 is identified as an overlap support. Such levels often have historical significance and may act as strong support zones where buying interest could emerge. It represents a potential area where the price might find support in case of a further decline.
Additionally, the 2nd support level at 1.0748 is categorized as an overlap support. This level is reinforced by the presence of the 161.80% Fibonacci Extension, further emphasizing its importance as a potential support zone.
On the resistance side, the 1st resistance level at 1.0927 is described as an overlap resistance. This level represents a historical point where the price has encountered resistance in the past. Traders should monitor this level closely as it may act as a barrier to further upward movement.
The 2nd resistance level at 1.0982 is also categorized as an overlap resistance. Similar to the 1st resistance, it indicates a historical level of resistance and can be considered significant in the event of an upward price movement.
EUR/JPY:
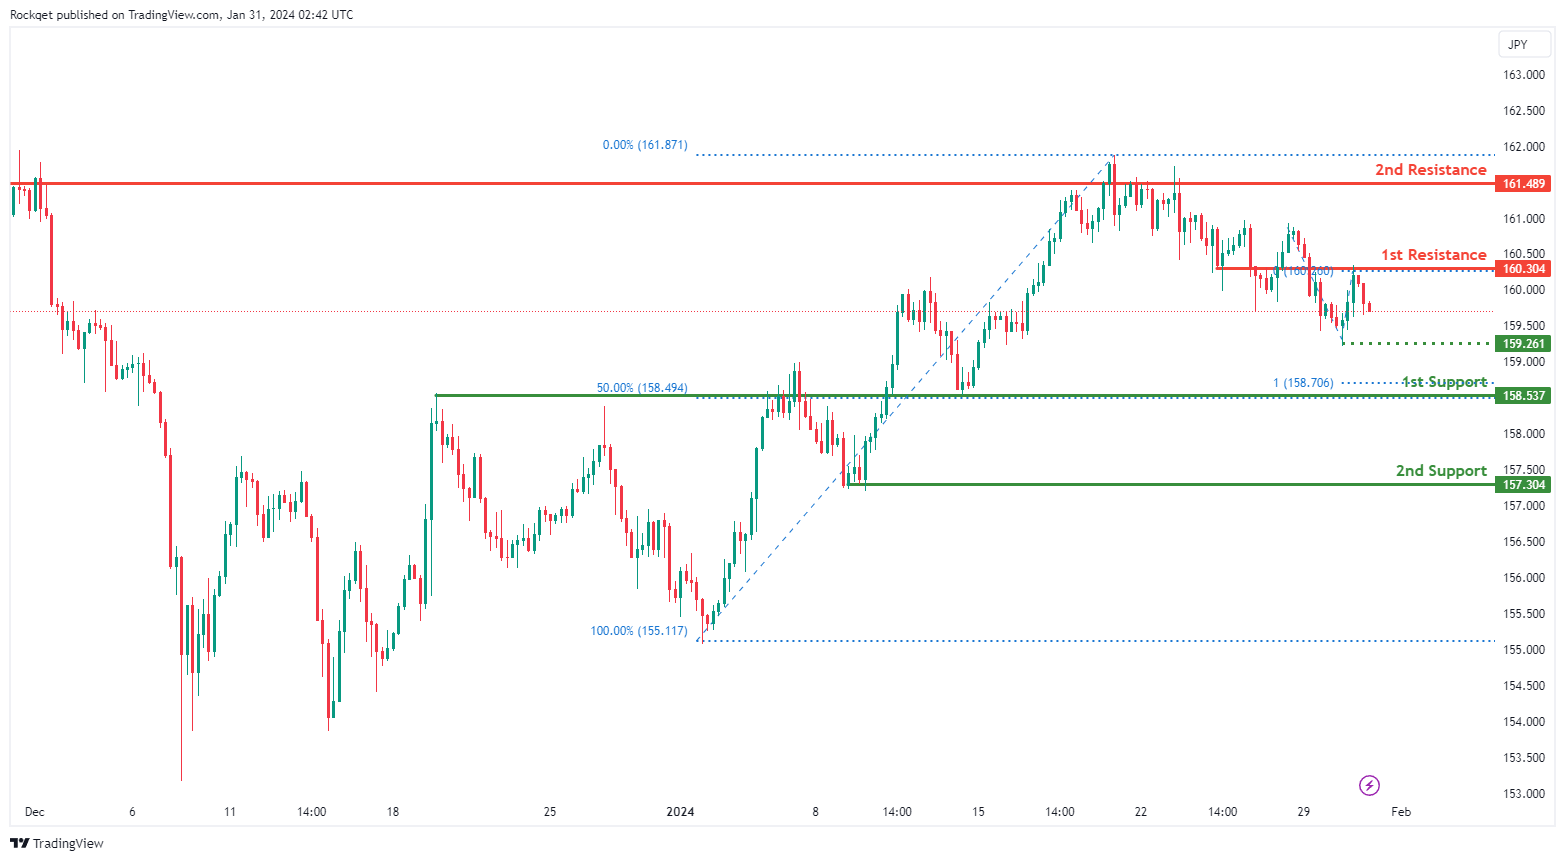
The EUR/JPY chart currently displays a bearish overall momentum, indicating a prevailing downward trend. There is a potential scenario where the price could experience a bearish reaction off the 1st resistance and subsequently drop towards the 1st support.
The 1st support at 158.537 is considered favorable for several reasons. Firstly, it is identified as an overlap support, suggesting a historical level where buying interest has previously emerged. Additionally, this support level aligns with the 50% Fibonacci Retracement and the 100% Fibonacci Projection, adding confluence to its significance.
The 2nd support at 157.304 is recognized as a swing low support, providing additional strength to the potential support zone.
Intermediate support at 159.26 is highlighted as a swing low support, further reinforcing the potential support zone.
On the resistance side, the 1st resistance at 160.304 is noteworthy for being an overlap resistance, indicating a historical level where selling interest may emerge.
Similarly, the 2nd resistance at 161.489 is identified as a multi-swing high resistance, adding significance to this potential resistance level.
EUR/GBP:
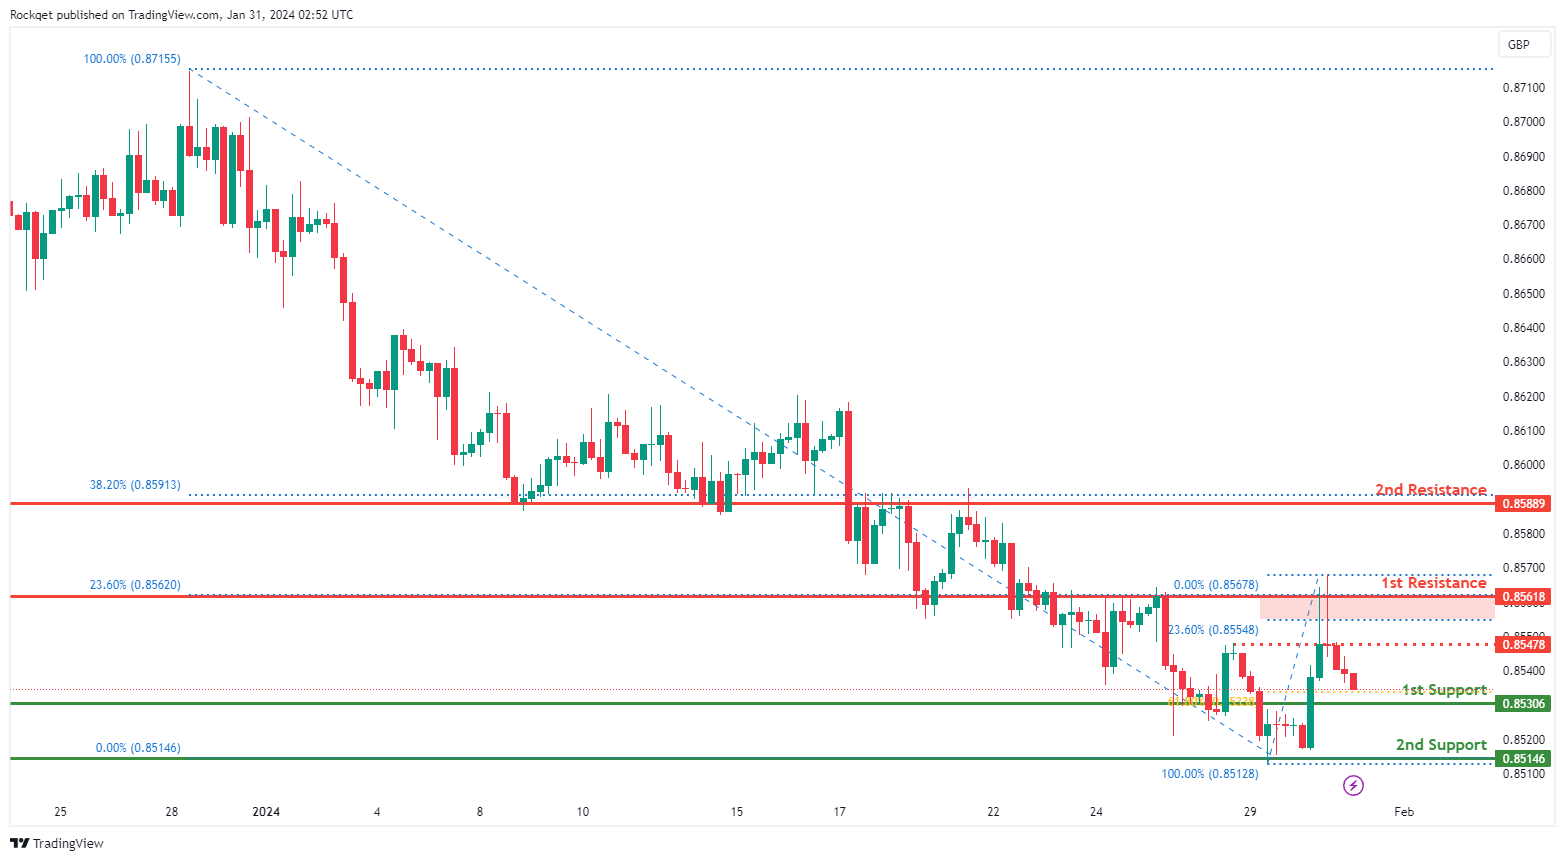
The EUR/GBP chart currently exhibits a bearish overall momentum, suggesting a prevailing downward trend. There is a potential scenario where the price could continue its bearish movement towards the 1st support.
The 1st support at 0.8531 is considered favorable for several reasons. Firstly, it is identified as an overlap support, indicating a historical level where buying interest has previously emerged. Additionally, this support level aligns with the 61.80% Fibonacci Retracement, adding confluence to its significance.
The 2nd support at 0.8515 is recognized as a swing low support, providing additional strength to the potential support zone.
On the resistance side, the 1st resistance at 0.8562 is noteworthy for being an overlap resistance and coincides with the 23.60% Fibonacci Retracement.
Similarly, the 2nd resistance at 0.8589 is identified as an overlap resistance, aligning with the 38.20% Fibonacci Retracement. An intermediate resistance at 0.8548 is highlighted as a pullback resistance, adding further context to the resistance levels.
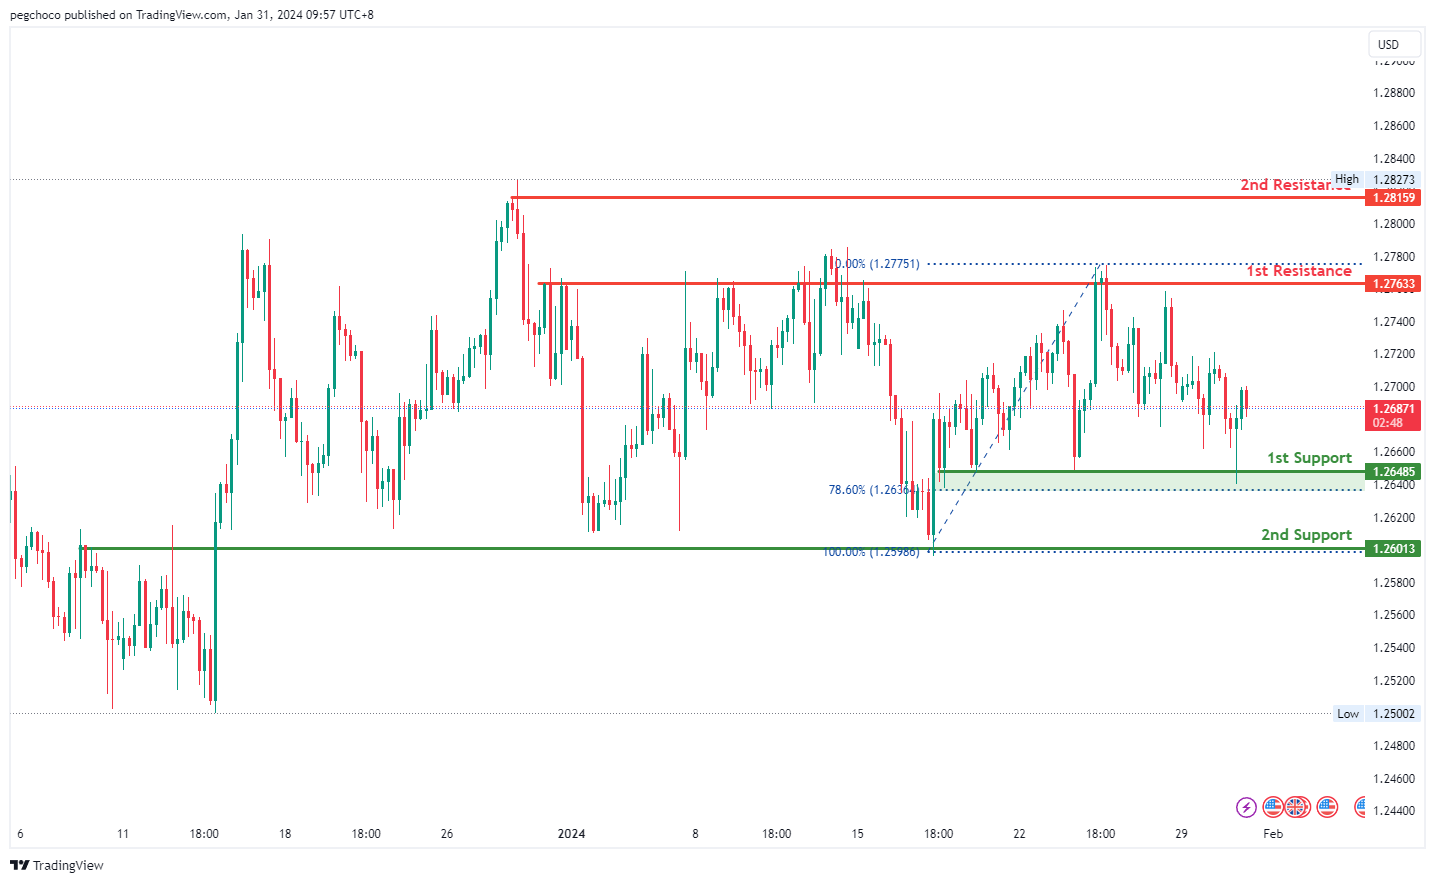
GBP/USD:
The GBP/USD chart currently exhibits a bearish overall momentum, indicating a downward trend. According to your analysis, the price could potentially continue its bearish movement towards the 1st support level.
The 1st support level at 1.2648 is identified as a multi-swing low support. This level is significant as it aligns with the 78.60% Fibonacci Retracement, suggesting historical relevance and the potential for it to act as a strong support zone where buying interest may emerge.
Additionally, the 2nd support level at 1.2601 is categorized as an overlap support. Such levels often have historical significance and can reinforce the importance of the 1st support zone.
On the resistance side, the 1st resistance level at 1.2763 is described as a multi-swing high resistance. This level represents a historical point where the price has encountered resistance in the past. Traders should monitor this level closely as it may act as a barrier to further upward movement.
The 2nd resistance level at 1.2815 is categorized as a swing high resistance, indicating another historical level of resistance. It can be considered significant in the event of an upward price movement.
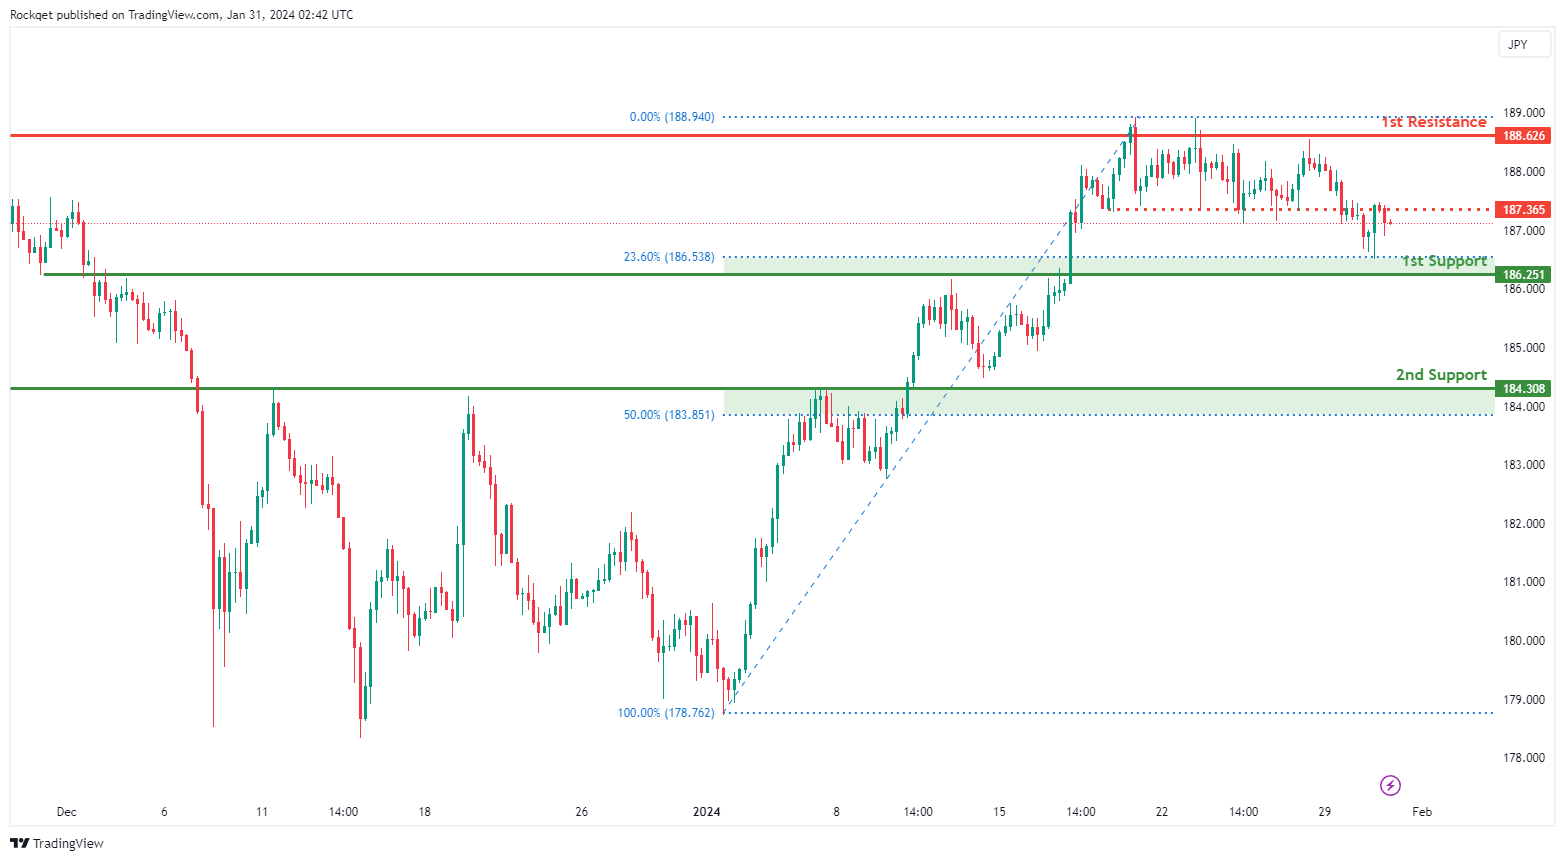
GBP/JPY:
The GBP/JPY chart currently displays a bearish overall momentum, indicating a prevailing downward trend. There is a potential scenario where the price could continue its bearish movement towards the 1st support.
The 1st support at 186.251 is considered favorable for several reasons. Firstly, it is identified as an overlap support, indicating a historical level where buying interest has previously emerged. Additionally, this support level aligns with the 23.60% Fibonacci Retracement, adding confluence to its significance.
The 2nd support at 184.308 is recognized as an overlap support and coincides with the 50% Fibonacci Retracement, providing additional strength to the potential support zone.
On the resistance side, the 1st resistance at 188.626 is noteworthy for being a multi-swing high resistance. An intermediate resistance at 187.365 is highlighted as an overlap resistance, adding further context to the resistance levels.
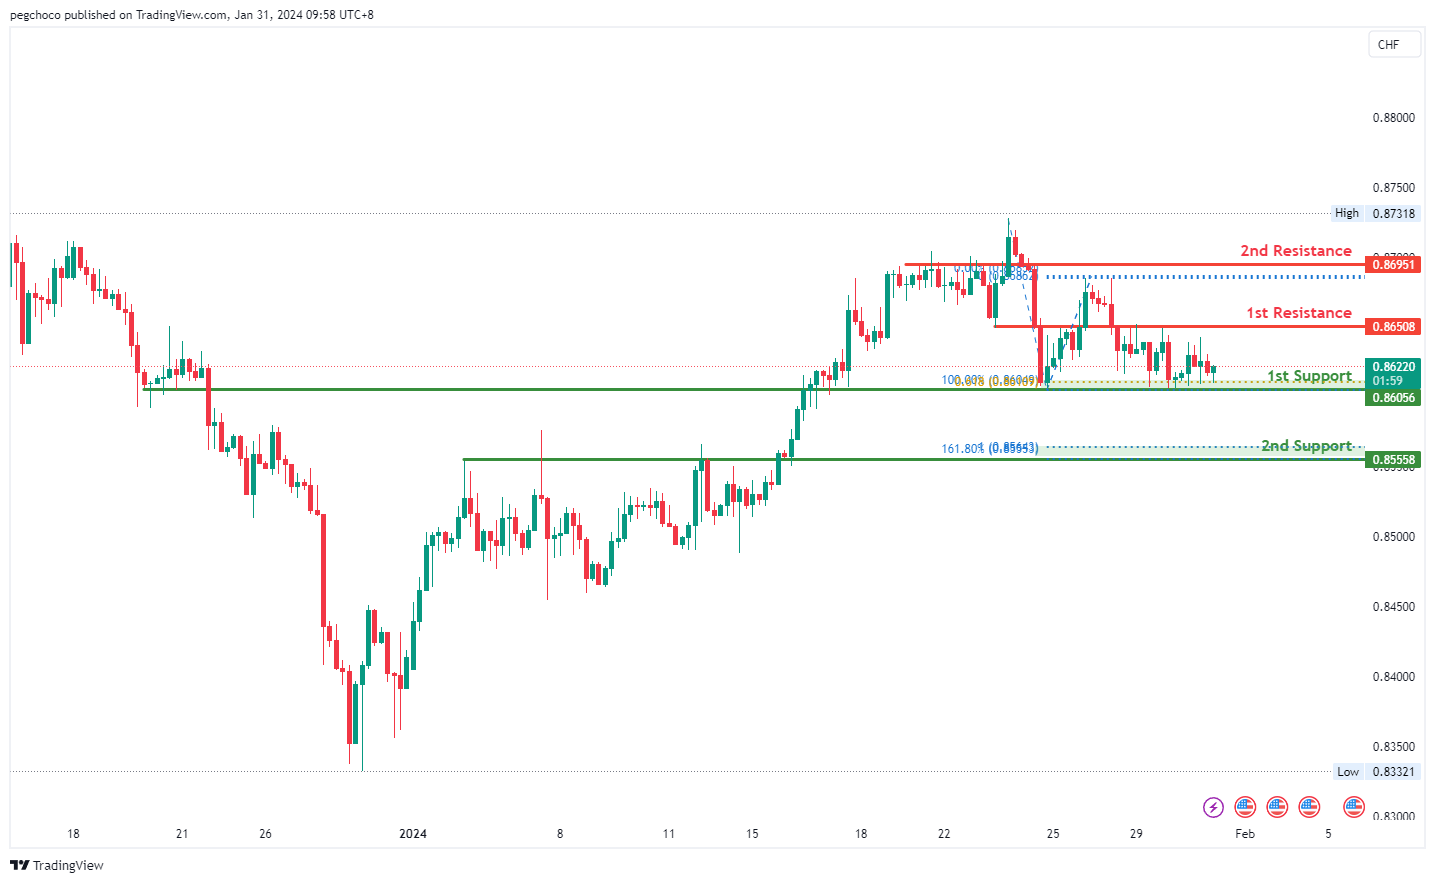
USD/CHF:
The USD/CHF chart currently exhibits a bullish overall momentum, indicating an upward trend. According to your analysis, the price could potentially experience a bullish bounce off the 1st support level and head towards the 1st resistance.
The 1st support level at 0.8605 is identified as an overlap support and is reinforced by the presence of the 61.80% Fibonacci Projection. This suggests that it has historical significance and could potentially act as a strong support level where buying interest may emerge.
The 2nd support level at 0.8555 is described as a pullback support and is associated with the 161.80% Fibonacci Extension, further emphasizing its importance as a potential support zone.
On the resistance side, the 1st resistance level at 0.8650 is categorized as an overlap resistance, indicating that it represents a historical point where the price has encountered resistance in the past.
The 2nd resistance level at 0.8695 is identified as a multi-swing high resistance, suggesting that it is another historical level where the price has faced resistance.
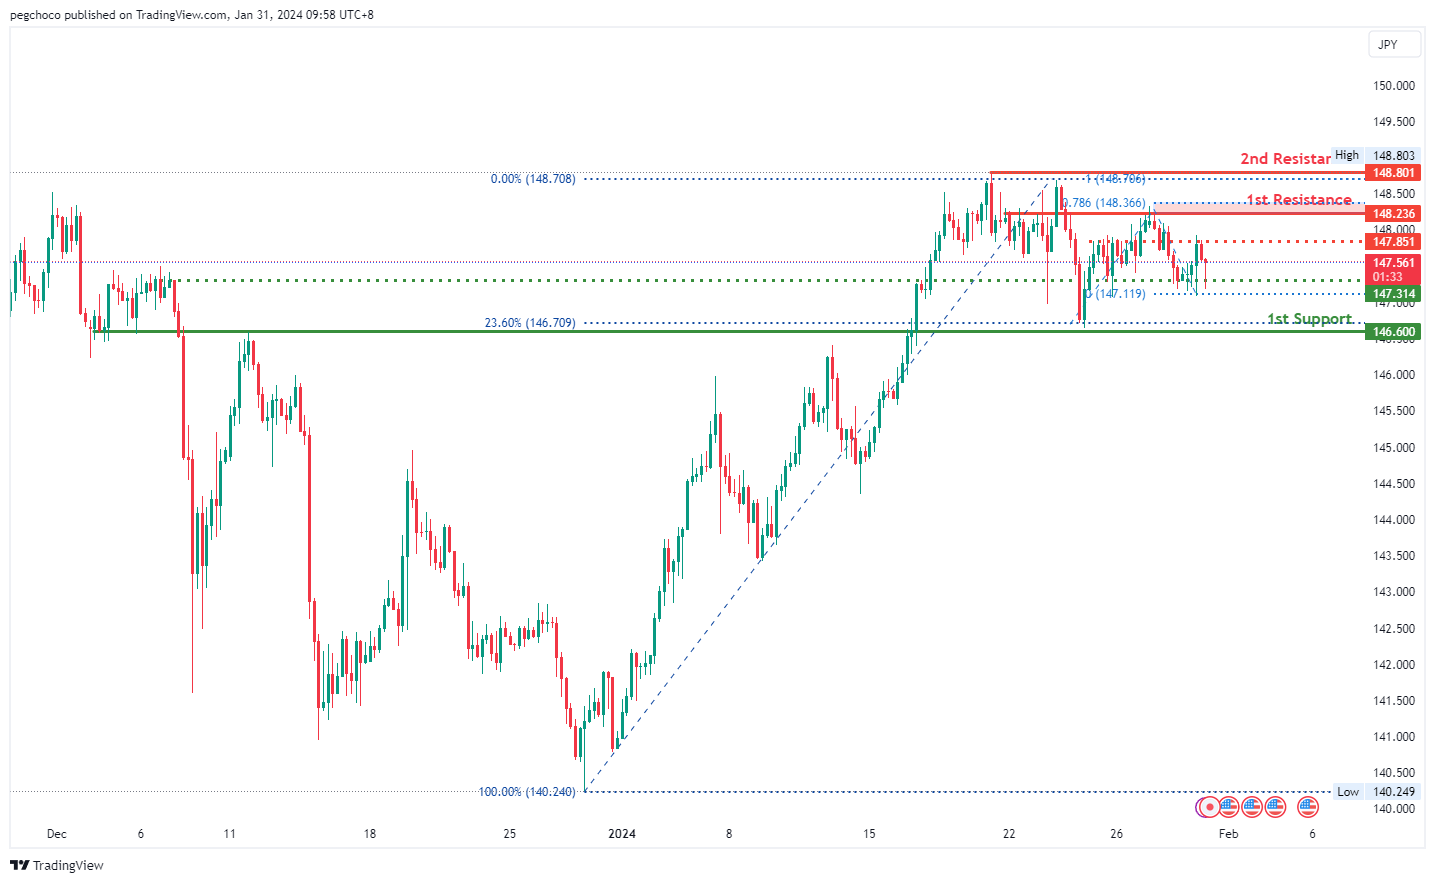
USD/JPY:
The USD/JPY chart is currently displaying a bearish overall momentum, indicating a downward trend. According to your analysis, the price could potentially continue its bearish movement towards the 1st support level.
The 1st support level at 146.60 is identified as an overlap support and is further reinforced by the presence of the 23.60% Fibonacci Retracement, suggesting historical significance and the potential for it to act as a strong support zone.
Additionally, there is an intermediate support level at 147.31, which is also categorized as an overlap support, adding further strength to the potential support in this area.
On the resistance side, the 1st resistance level at 148.23 is considered a multi-swing high resistance, and it is associated with the 78.60% Fibonacci Projection, making it a notable level to watch for potential price reversals.
The 2nd resistance level at 148.80 is identified as a swing high resistance and is associated with the 100% Fibonacci Projection, indicating its significance as a historical point of price resistance.
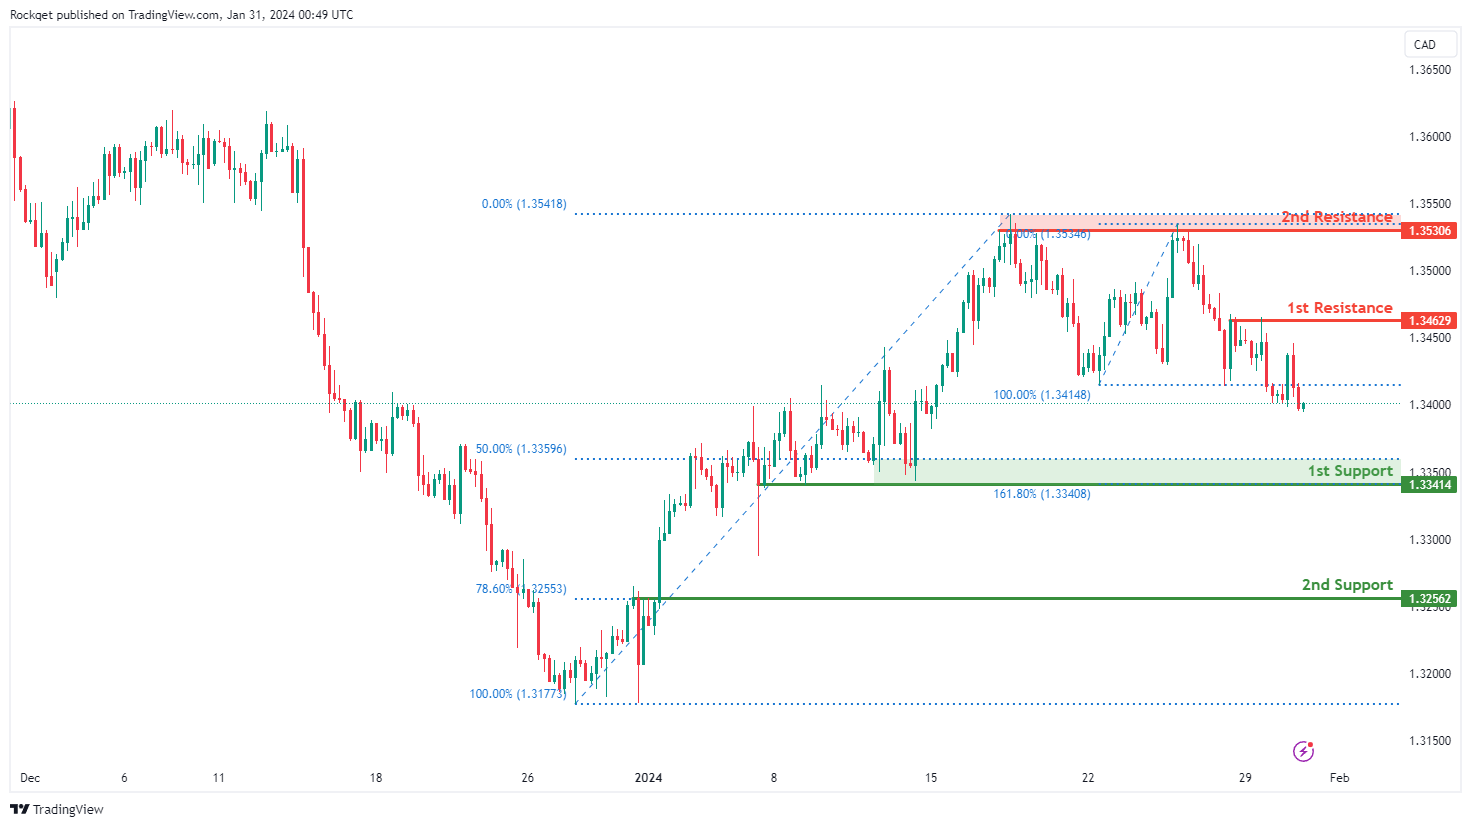
USD/CAD:
The USD/CAD chart currently exhibits an overall bearish momentum. In this context, there is a potential scenario for price to make a bearish continuation towards the 1st support level.
The 1st support level at 1.3341 is identified as a pullback support that aligns close to the 50.00% Fibonacci Retracement level. Further below, the 2nd support level at 1.3256 is also marked as a pullback support that aligns with the 78.60% Fibonacci Retracement level, further emphasizing its importance as a potential support zone.
On the resistance side, the 1st resistance level at 1.3462 is identified as a pullback resistance. Higher up, the 2nd resistance level at 1.3530 is noted as a multi-swing-high resistance, further highlighting its importance as a potential resistance point.
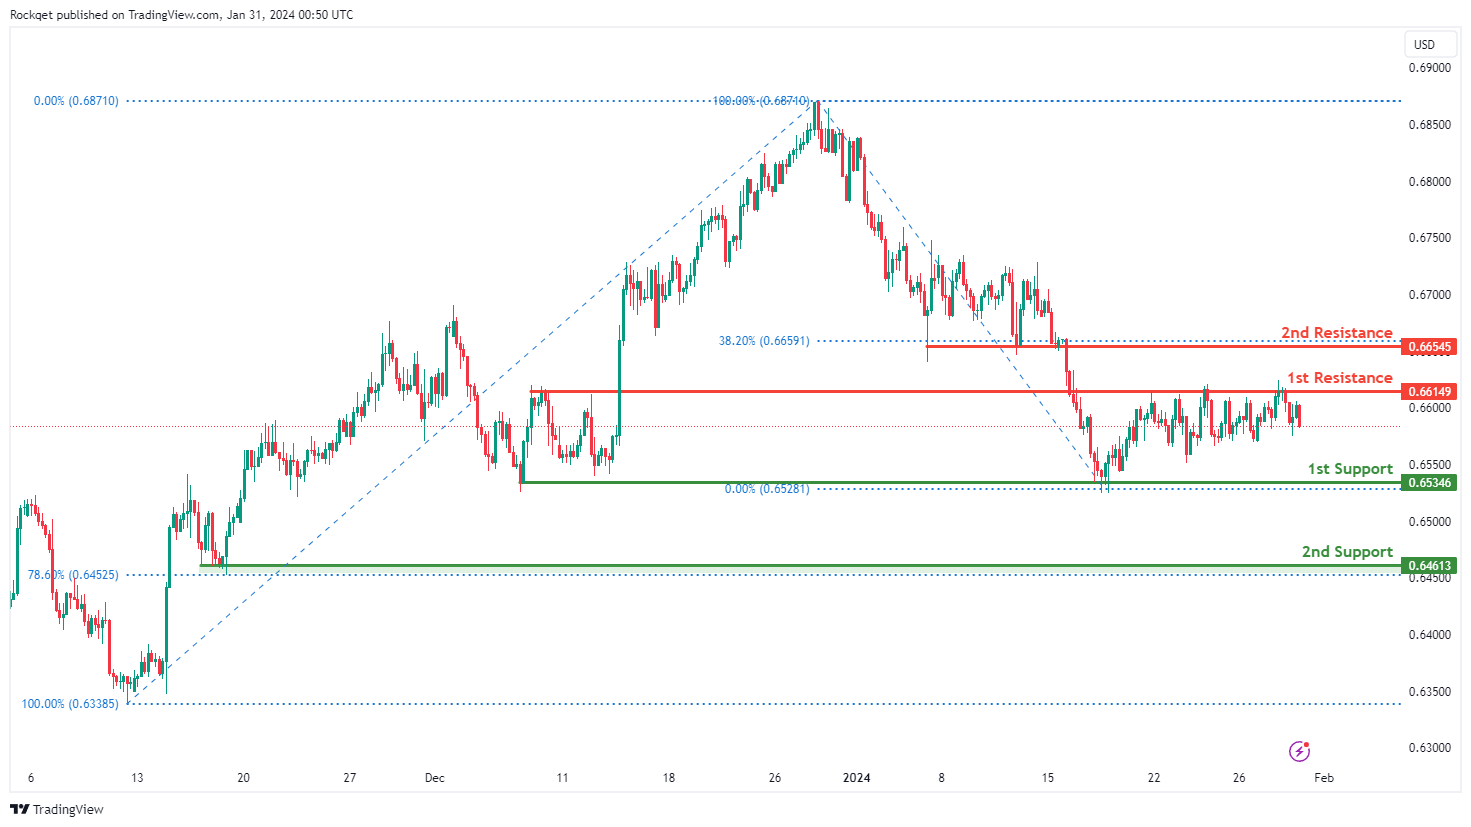
AUD/USD:
The AUD/USD chart currently exhibits a neutral bias. In this context, there is a potential scenario for price to fluctuate between the 1st resistance and 1st support.
The 1st support level at 0.6534 is identified as a pullback support. Further below, the 2nd support level at 0.6461 is also noted as a pullback support that aligns close to the 78.60% Fibonacci Retracement level, further emphasizing its importance as a potential support zone.
On the resistance side, the 1st resistance level at 0.6614 is identified as a pullback resistance. Higher up, the 2nd resistance level at 0.6654 is also marked as a pullback resistance that aligns with the 38.20% Fibonacci Retracement level, further highlighting its importance as a potential resistance point.
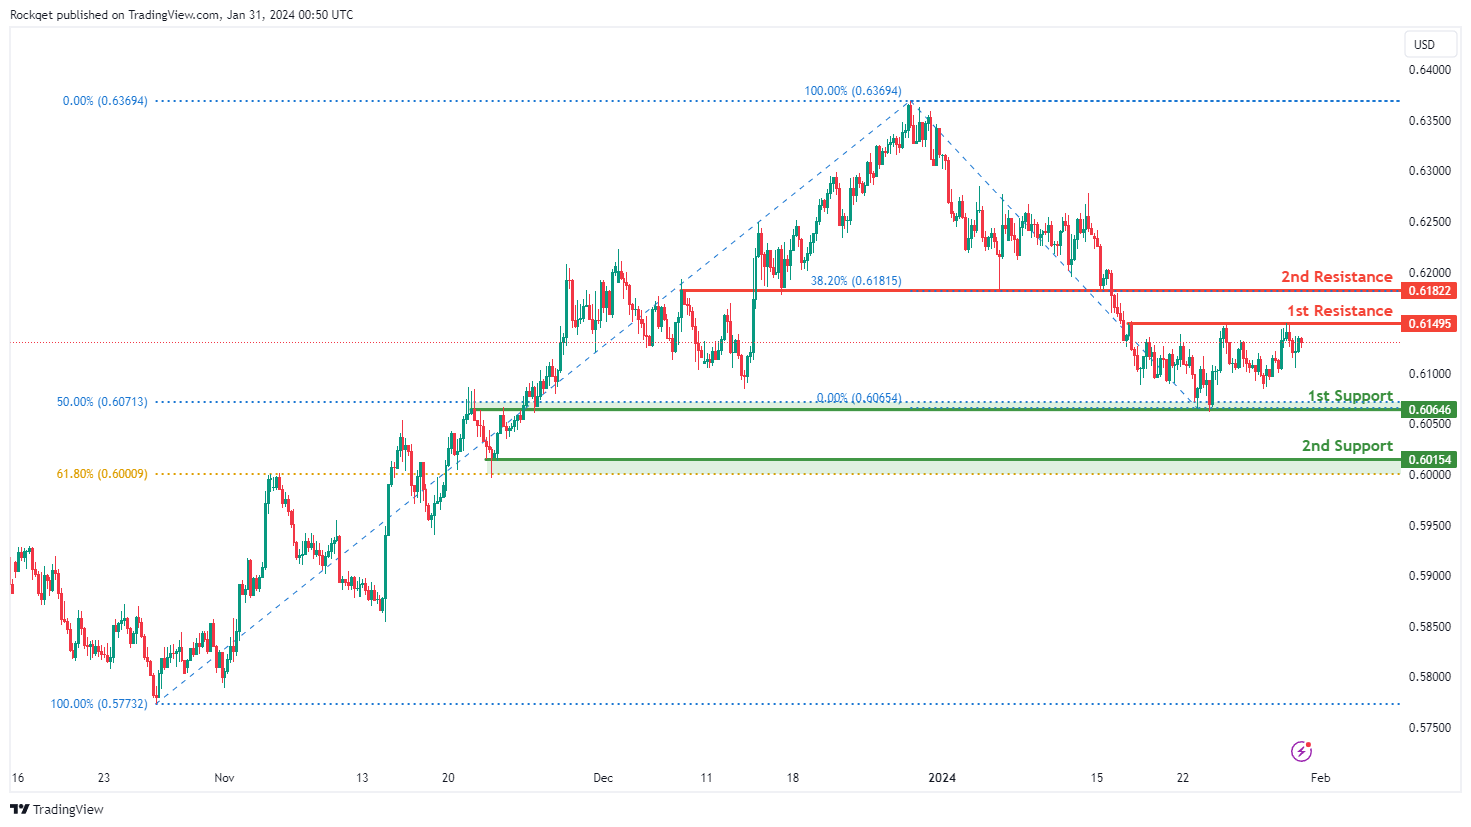
NZD/USD
The NZD/USD chart currently exhibits a neutral bias. In this context, there is a potential scenario for price to fluctuate between the 1st resistance and 1st support.
The 1st support level at 0.6064 is identified as an overlap support that aligns with the 50.00% Fibonacci Retracement level. Further below, the 2nd support level at 0.6015 is noted as a pullback support that aligns close to the 61.80% Fibonacci Retracement level, further emphasizing its importance as a potential support zone.
On the resistance side, the 1st resistance level at 0.6149 is identified as a pullback resistance. Higher up, the 2nd resistance level at 0.6182 is marked as an overlap resistance that aligns with the 38.20% Fibonacci Retracement level, further highlighting its importance as a potential resistance point.
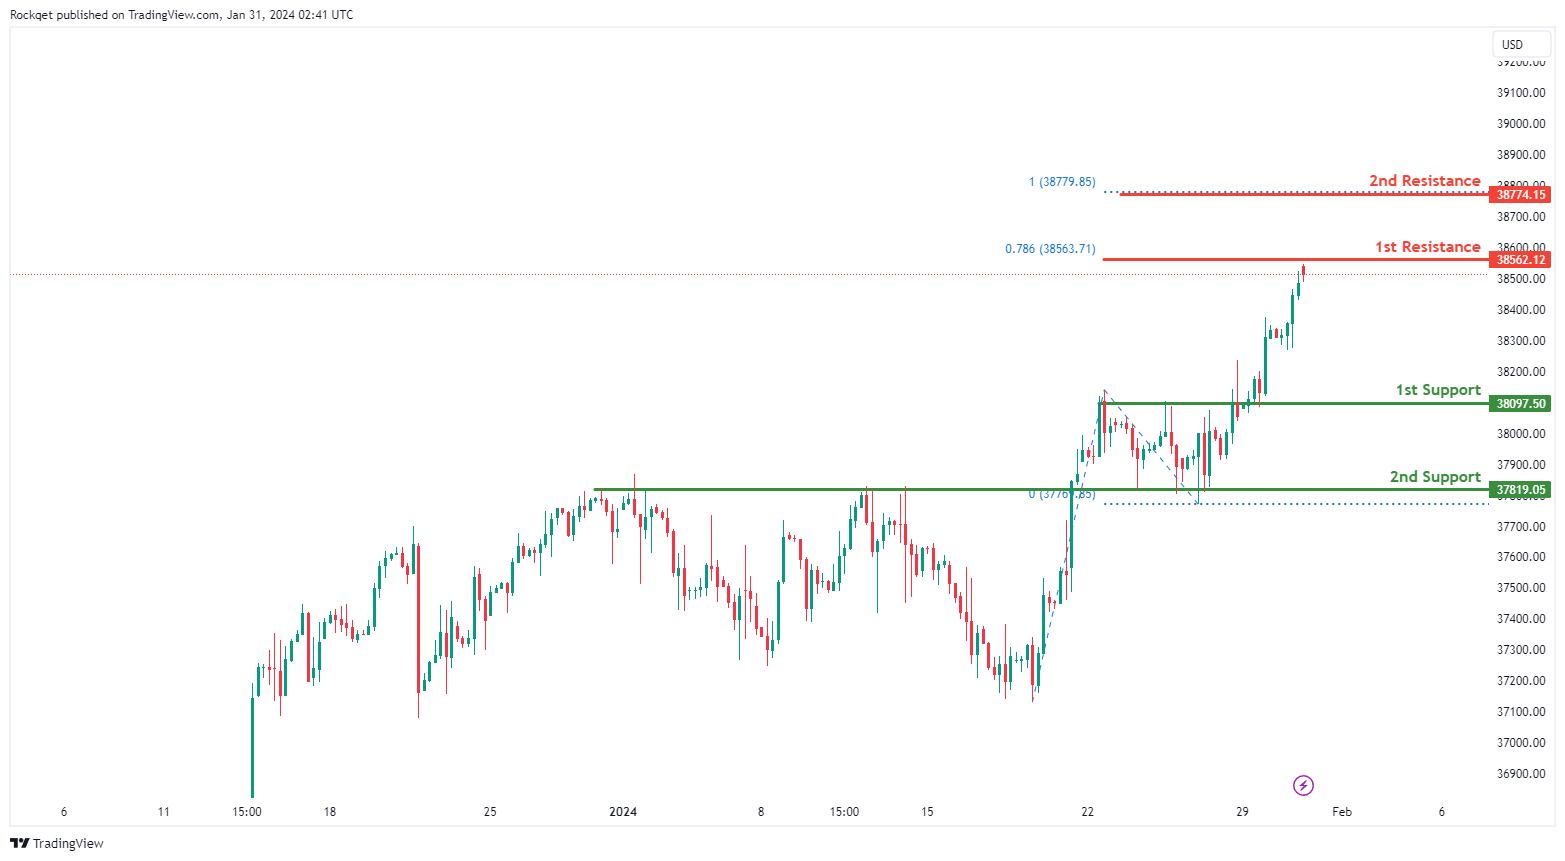
DJ30:
The DJ30 (Dow Jones Industrial Average) chart currently exhibits a bullish overall momentum, indicating a prevailing upward trend. There is a potential scenario where the price could continue its bullish movement towards the 1st resistance.
The 1st support at 38097.50 is considered favorable for being an overlap support, representing a historical level where buying interest has previously emerged.
The 2nd support at 37819.50 is also identified as an overlap support, adding additional strength to the support zone.
On the resistance side, the 1st resistance at 38562.12 is noteworthy for being a swing high resistance and aligning with the 78.60% Fibonacci Projection, adding confluence to its significance.
The 2nd resistance at 38774.15 is highlighted as the 100% Fibonacci Projection, indicating a potential price target.
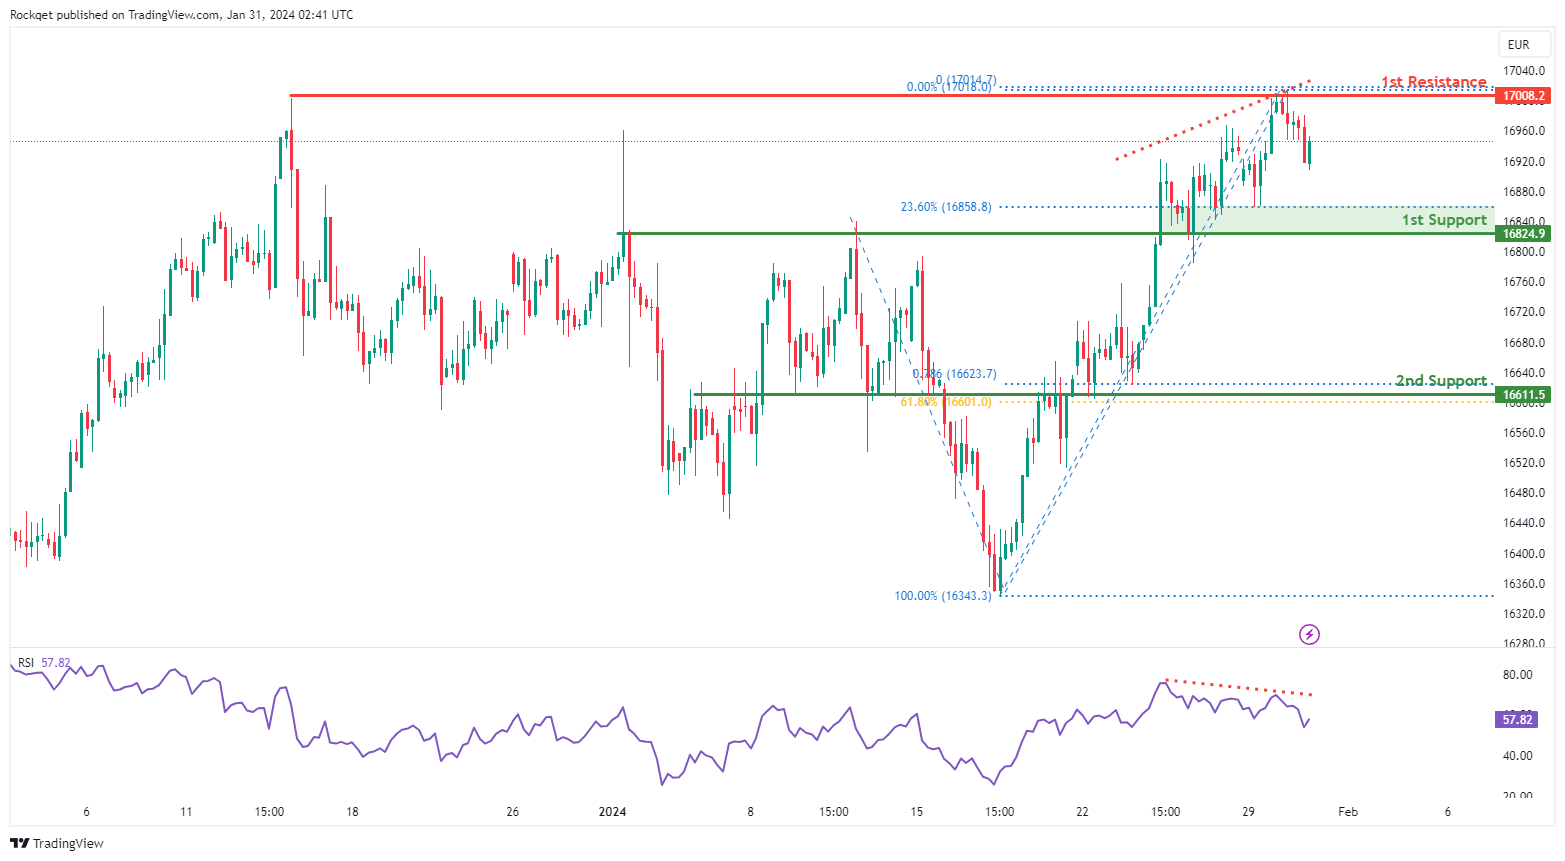
GER40:
The GER40 (DAX) chart is currently experiencing a bearish overall momentum, indicating a prevailing downward trend. Several factors contribute to this bearish momentum, suggesting potential downward movement in the price.
The 1st support at 16824.9 is considered advantageous for several reasons. Firstly, it is identified as a pullback support, indicating a historical level where buying interest has previously emerged. Additionally, this support level aligns with the 23.60% Fibonacci Retracement, adding confluence to its significance.
The 2nd support at 16611.5 is recognized as an overlap support, providing additional strength to the potential support zone. Furthermore, it coincides with the 61.80% Fibonacci Retracement and the 78.60% Fibonacci Projection, further reinforcing its importance.
On the resistance side, the 1st resistance at 17008.2 is highlighted as a multi-swing high resistance. This level may act as a barrier to the bearish momentum.
Additionally, the Relative Strength Index (RSI) is also displaying bearish divergence versus price, suggesting that a reversal might occur soon.This occurs when the RSI forms lower highs while the price forms higher highs, signaling potential weakening of the bullish momentum and the possibility of a reversal.
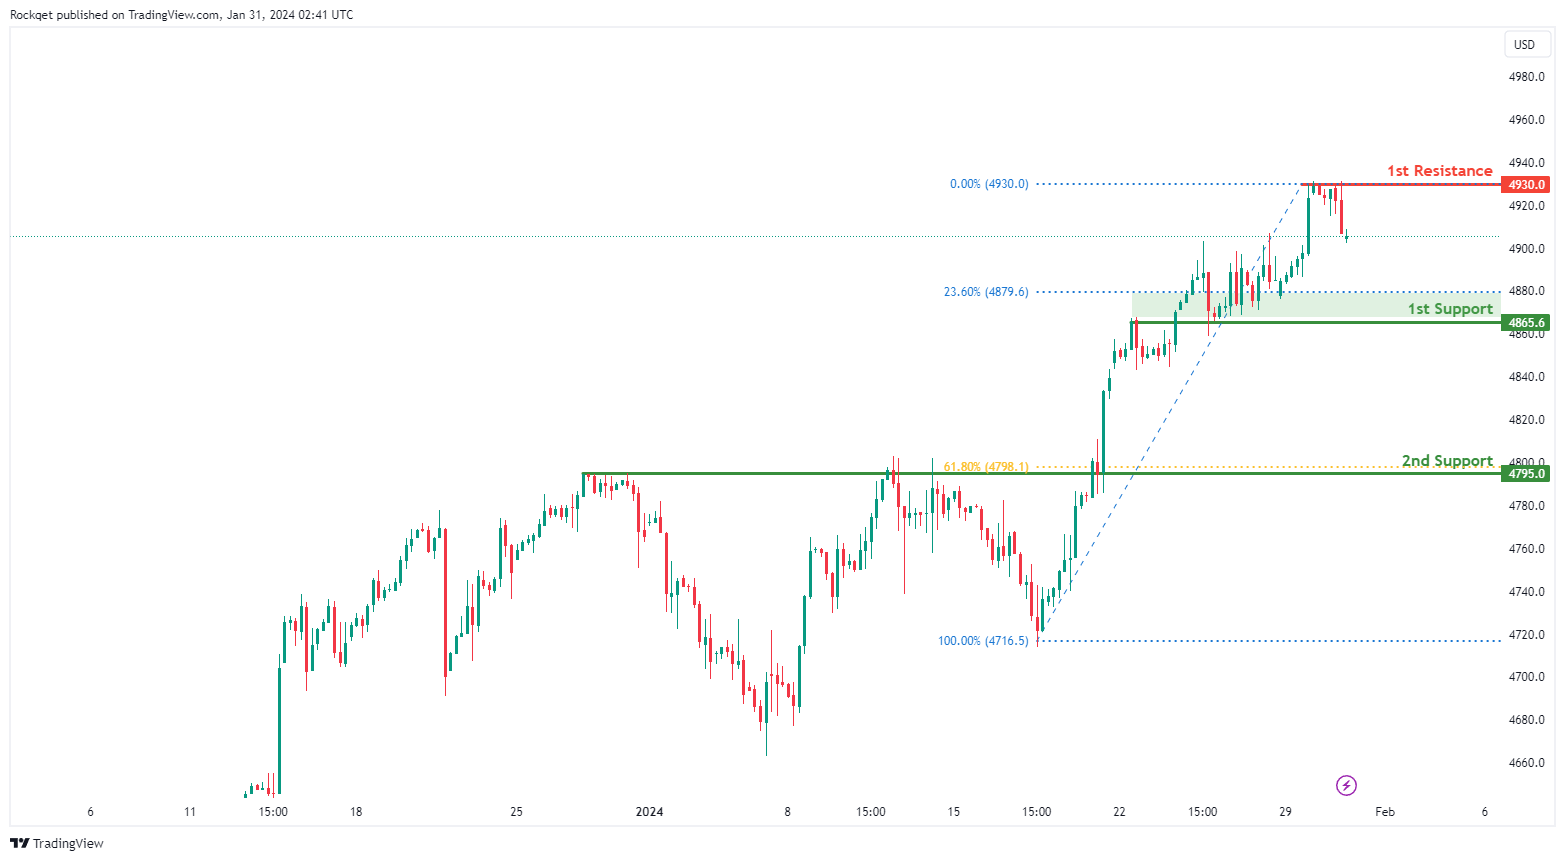
US500:
The US500 chart currently exhibits a weak bearish overall momentum with low confidence, indicating a hesitant downward trend. Several factors contribute to this weak bearish momentum, suggesting potential downward movement in the price.
The 1st support at 4865.6 is considered favorable for several reasons. Firstly, it is identified as an overlap support, indicating a historical level where buying interest has previously emerged. Additionally, this support level aligns with the 23.60% Fibonacci Retracement, adding confluence to its significance.
The 2nd support at 4795.0 is recognized as a pullback support and coincides with the 61.80% Fibonacci Retracement, providing additional strength to the potential support zone.
On the resistance side, the 1st resistance at 4939.0 is noteworthy for the presence of a swing high resistance. This level may act as a barrier to the bearish momentum.
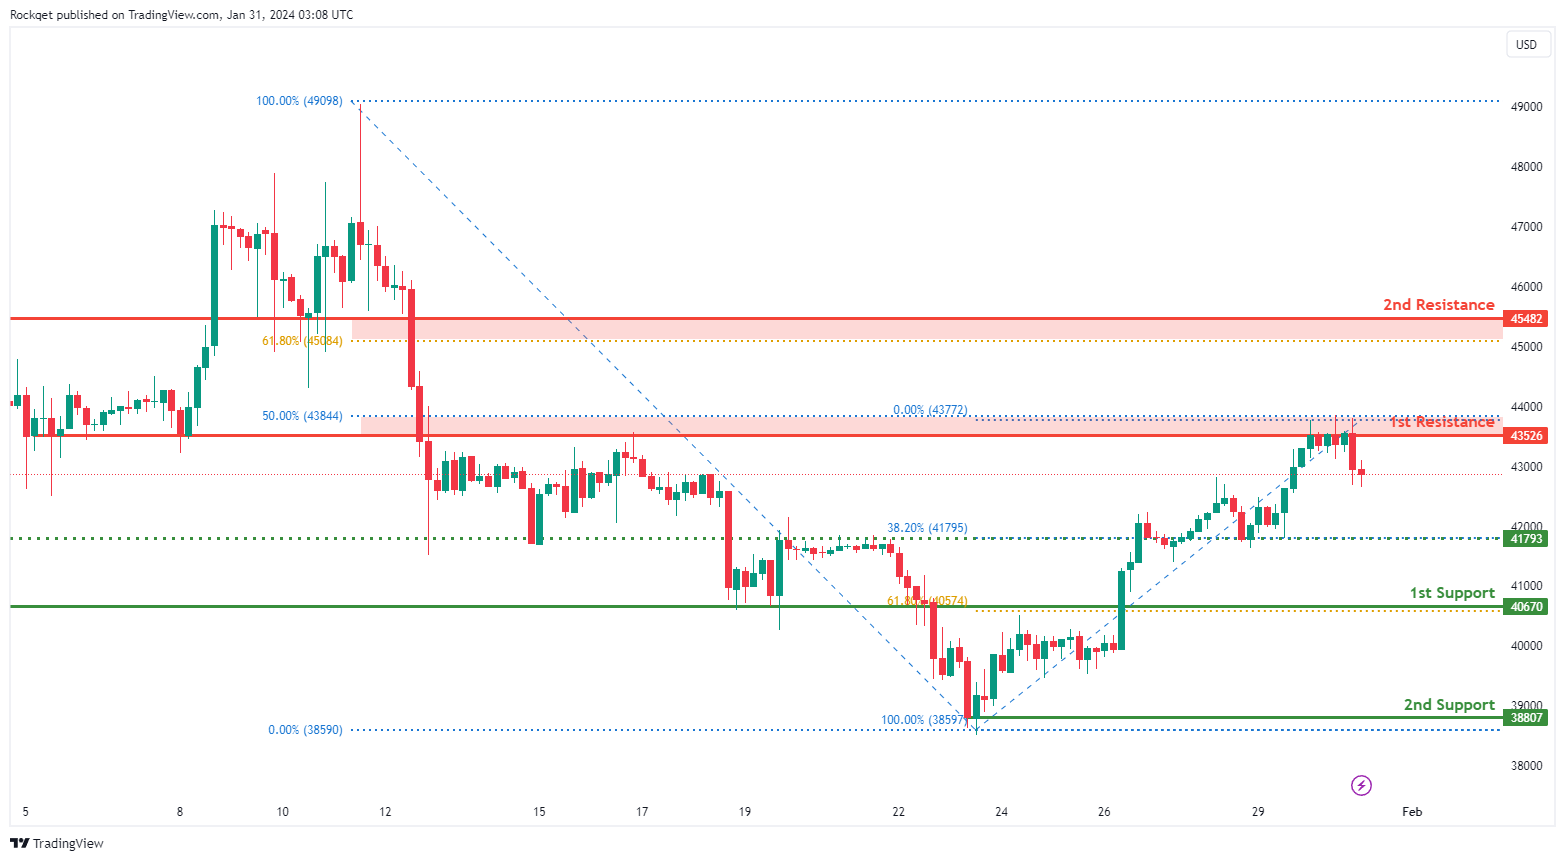
BTC/USD:
The BTC/USD chart currently displays a bearish overall momentum, indicating a prevailing downward trend. Several factors contribute to this bearish momentum, suggesting potential downward movement in the price.
The 1st support at 40670 is considered favorable for several reasons. Firstly, it is identified as an overlap support, indicating a historical level where buying interest has previously emerged. Additionally, this support level aligns with the 61.80% Fibonacci Retracement, adding confluence to its significance.
The 2nd support at 38807 is recognized as a swing low support, providing additional strength to the potential support zone.
The intermediate support at 41793 is identified as an overlap support and coincides with the 38.20% Fibonacci Retracement, further reinforcing its importance.
On the resistance side, the 1st resistance at 43526 is noteworthy for the presence of an overlap resistance and the 50% Fibonacci Retracement, adding significance to this potential resistance level.
Furthermore, the 2nd resistance at 45482 is acknowledged as an overlap resistance and aligns with the 61.80% Fibonacci Retracement, contributing to the overall resistance zone.
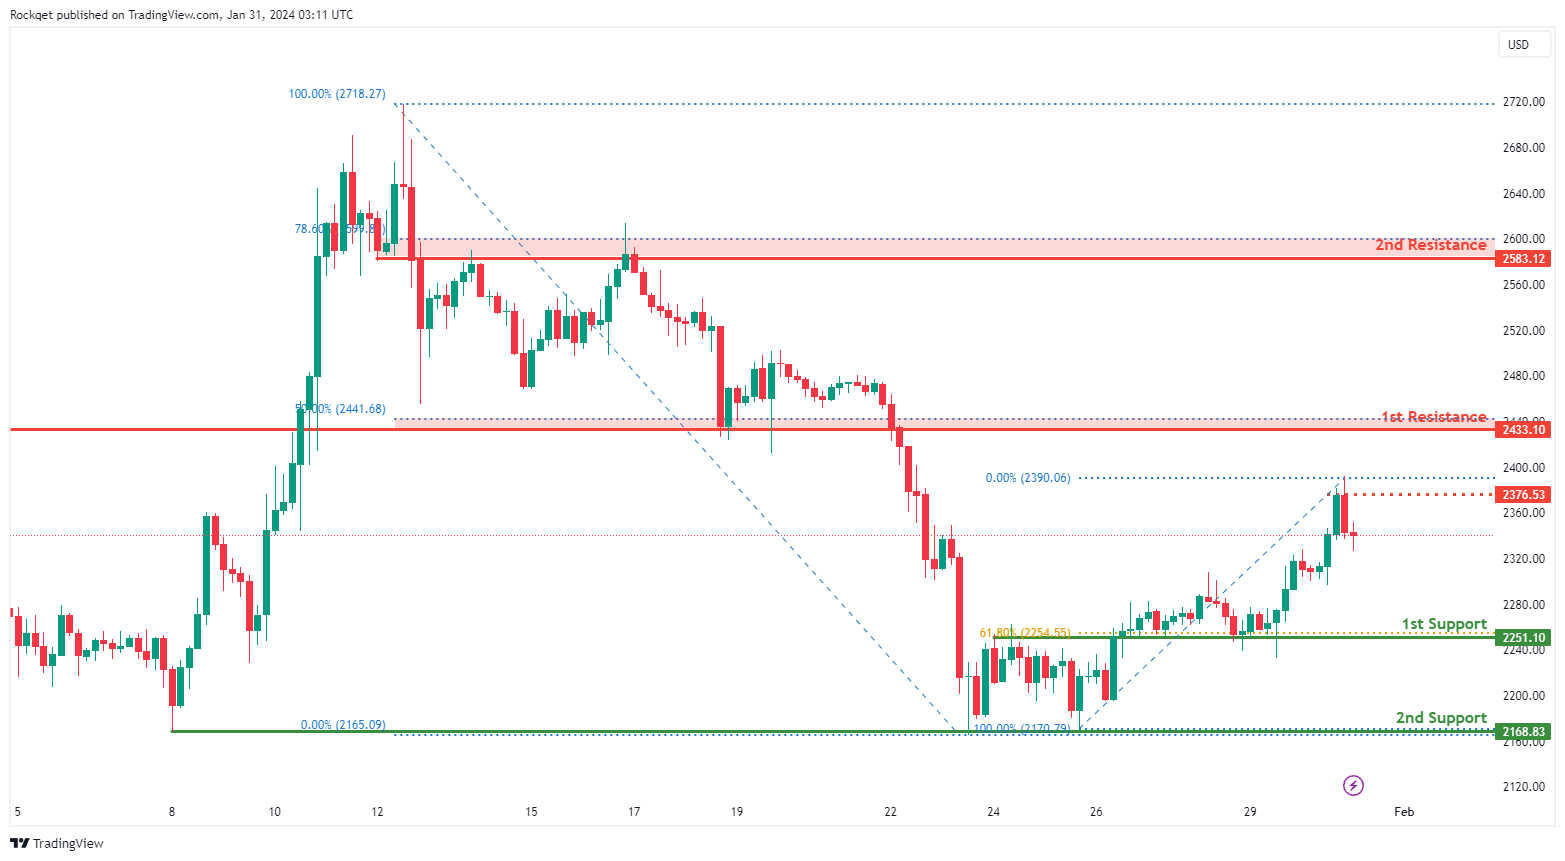
ETH/USD:
The ETH/USD chart currently displays a weak bearish overall momentum with low confidence, suggesting a hesitant downward trend. Several factors contribute to this weak bearish momentum, indicating the potential for downward movement in the price.
The 1st support at 2251.10 is considered favorable for several reasons. Firstly, it is identified as an overlap support, indicating a historical level where buying interest has previously emerged. Additionally, this support level aligns with the 61.80% Fibonacci Retracement, adding confluence to its significance.
The 2nd support at 2168.83 is recognized as a multi-swing low support, providing additional strength to the potential support zone.
On the resistance side, the 1st resistance at 2433.10 is noteworthy for the presence of an overlap resistance and the 50% Fibonacci Retracement, adding significance to this potential resistance level.
Furthermore, the 2nd resistance at 2583.12 is acknowledged as an overlap resistance and aligns with the 78.60% Fibonacci Retracement, contributing to the overall resistance zone.
The intermediate resistance at 2376.53 is identified as a swing high resistance, further reinforcing its importance.
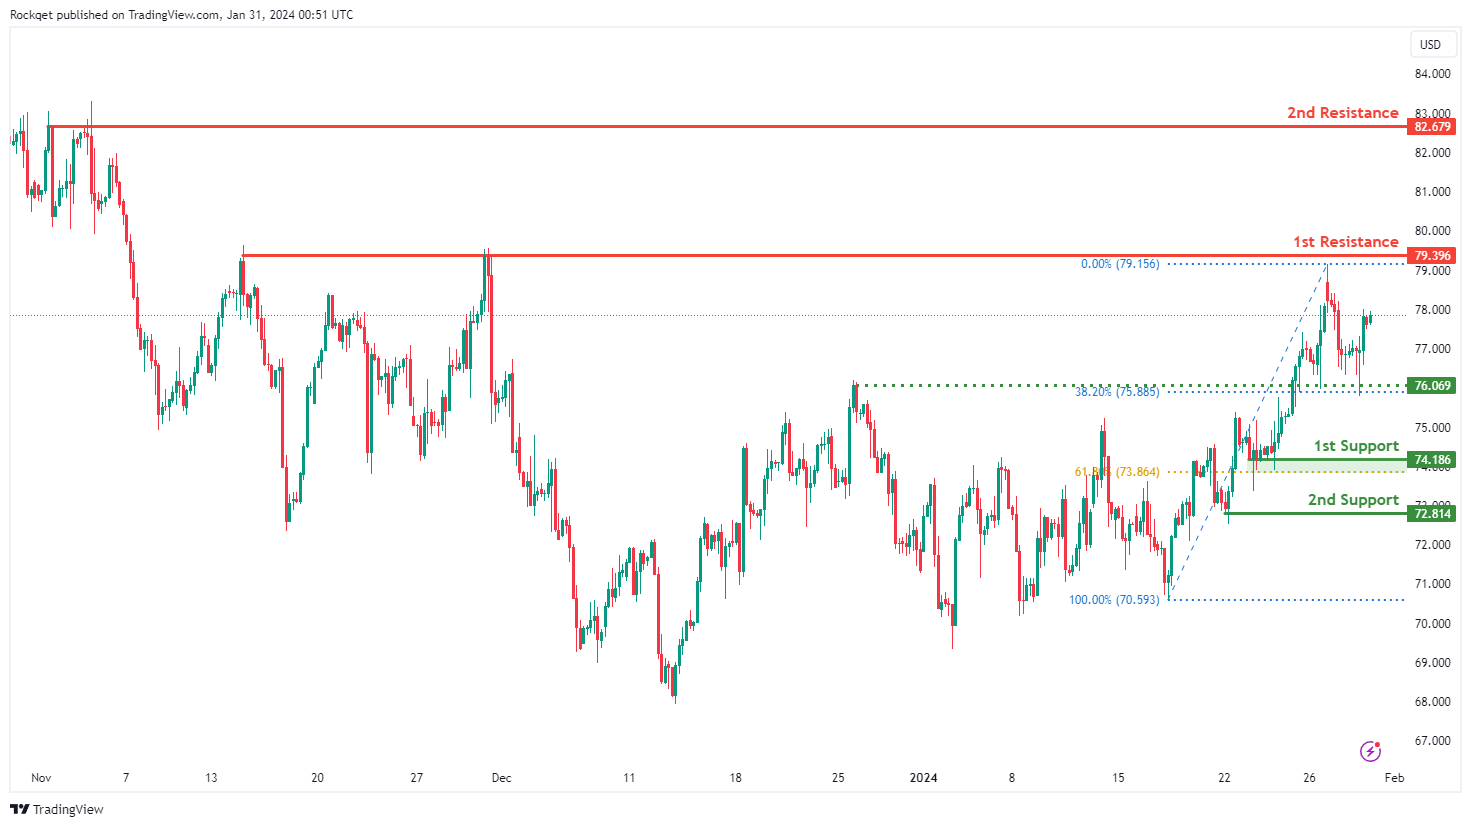
WTI/USD:
The WTI (West Texas Intermediate) chart currently exhibits an overall bullish momentum. In this context, there is a potential scenario for price to make a bullish rise towards the 1st resistance.
The 1st resistance level at 79.39 is identified as a multi-swing-high resistance. Higher up, the 2nd resistance level at 82.67 is noted as a pullback resistance, further highlighting its importance as a potential resistance point.
On the support side, the intermediate support level at 76.06 is identified as an overlap support that aligns close to the 38.20% Fibonacci Retracement level while the 1st support level at 74.18 is noted as a pullback support that aligns close to the 61.80% Fibonacci Retracement level. Further below, the 2nd support level at 72.81 is also marked as a pullback support, reinforcing its significance as a key support level.
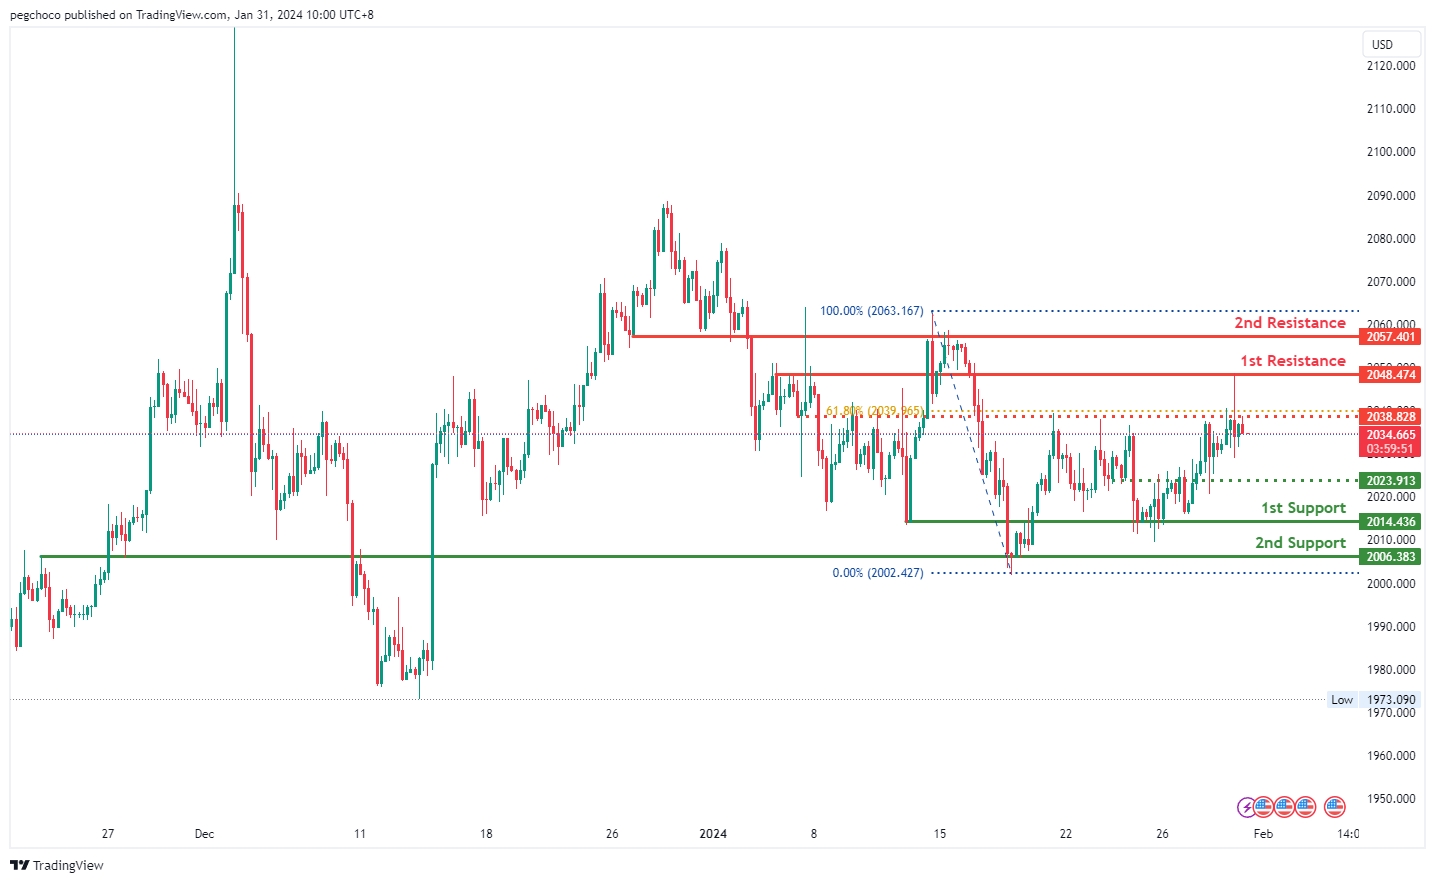
XAU/USD (GOLD):
The XAU/USD chart is currently displaying a bearish overall momentum, indicating a downward trend. According to your analysis, the price could potentially continue its bearish movement towards the 1st support level.
The 1st support level at 2014.43 is identified as an overlap support, suggesting historical significance and the potential for it to act as a strong support zone.
Additionally, there is a 2nd support level at 2006.38, which is also categorized as an overlap support, reinforcing the potential support in this area.
On the resistance side, the 1st resistance level at 2048.47 is considered an overlap resistance, indicating a historical point of price resistance.
The 2nd resistance level at 2057.40 is also identified as an overlap resistance, further suggesting a potential barrier for the price.
Moreover, there is an intermediate resistance level at 2038.82, categorized as an overlap resistance, which could potentially provide additional resistance to any bullish attempts.
The accuracy, completeness and timeliness of the information contained on this site cannot be guaranteed. IC Markets does not warranty, guarantee or make any representations, or assume any liability regarding financial results based on the use of the information in the site.
News, views, opinions, recommendations and other information obtained from sources outside of www.icmarkets.com, used in this site are believed to be reliable, but we cannot guarantee their accuracy or completeness. All such information is subject to change at any time without notice. IC Markets assumes no responsibility for the content of any linked site.
The fact that such links may exist does not indicate approval or endorsement of any material contained on any linked site. IC Markets is not liable for any harm caused by the transmission, through accessing the services or information on this site, of a computer virus, or other computer code or programming device that might be used to access, delete, damage, disable, disrupt or otherwise impede in any manner, the operation of the site or of any user’s software, hardware, data or property.


