
Key risk events today:
China Manufacturing PMI and Non-Manufacturing PMI; Swiss KOF Economic Barometer; ECB President Lagarde Speaks in Frankfurt; US ADP Non-Farm Employment Change; Canada GDP m/m; US Final GDP q/q; Chicago PMI; US Pending Home Sales m/m.
(Previous analysis as well as outside sources – italics).
EUR/USD:
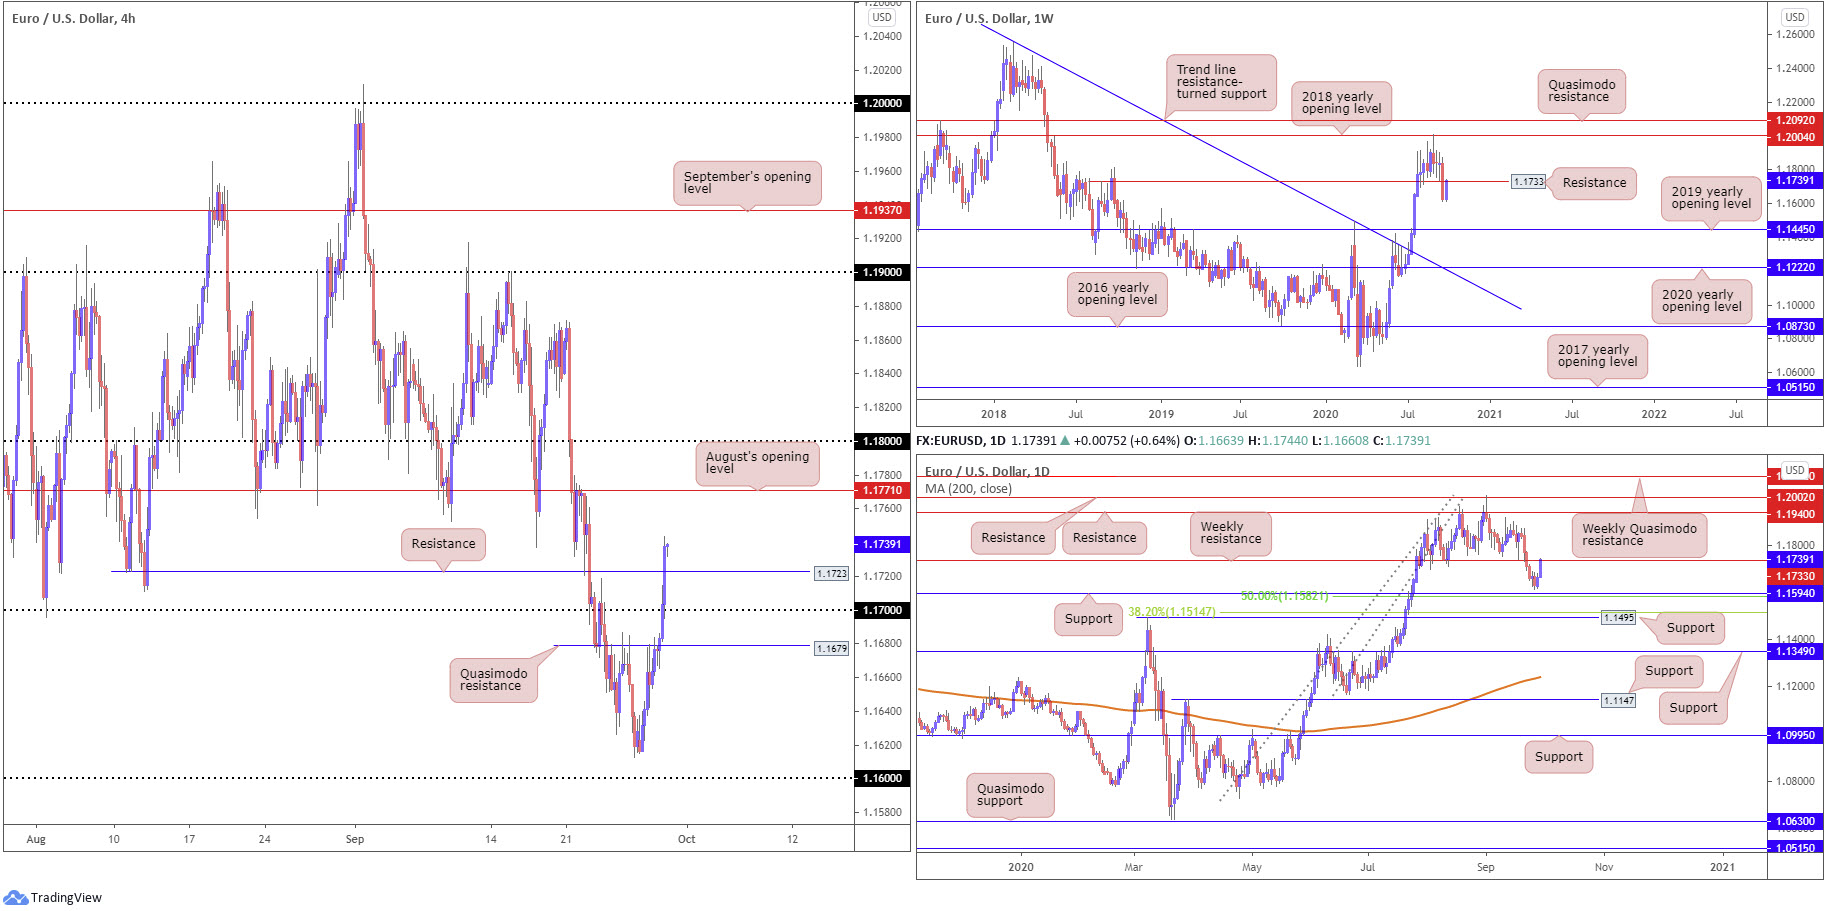
The US dollar index, or DXY, continued to deteriorate south of daily resistance at 94.65 Tuesday, consequently providing fresh impetus for EUR/USD bulls to take on the 1.17 handle and H4 resistance coming in at 1.1723. Clearance of the latter advertises August’s opening value at 1.1771, closely shadowed by the 1.18 handle.
While H4 reveals buyers have room to work with, weekly resistance at 1.1733 may put a lid on any upside attempts.
Areas of consideration:
When lower timeframes offer a clearance, but higher timeframes display active support or resistance, many traders (particularly those who do not include higher timeframe analysis) can be caught on the wrong side of the market.
In the case of EUR/USD, multi-timeframe analysis suggests a dip from weekly resistance at 1.1733 could be on the cards, forcing H4 support at 1.1723 into the fold. Should buyers make a stand here, in the form of a H4 bullish candlestick pattern, this suggests weekly sellers may be soft and we may reach August’s opening value at 1.1771 on the H4. Failure to print anything of note off 1.1723, however, indicates weekly sellers could push for 1.17.
Also, do keep in mind that a turn from weekly resistance shows higher timeframe action offers limited support until 1.1594 on the daily timeframe.
GBP/USD:
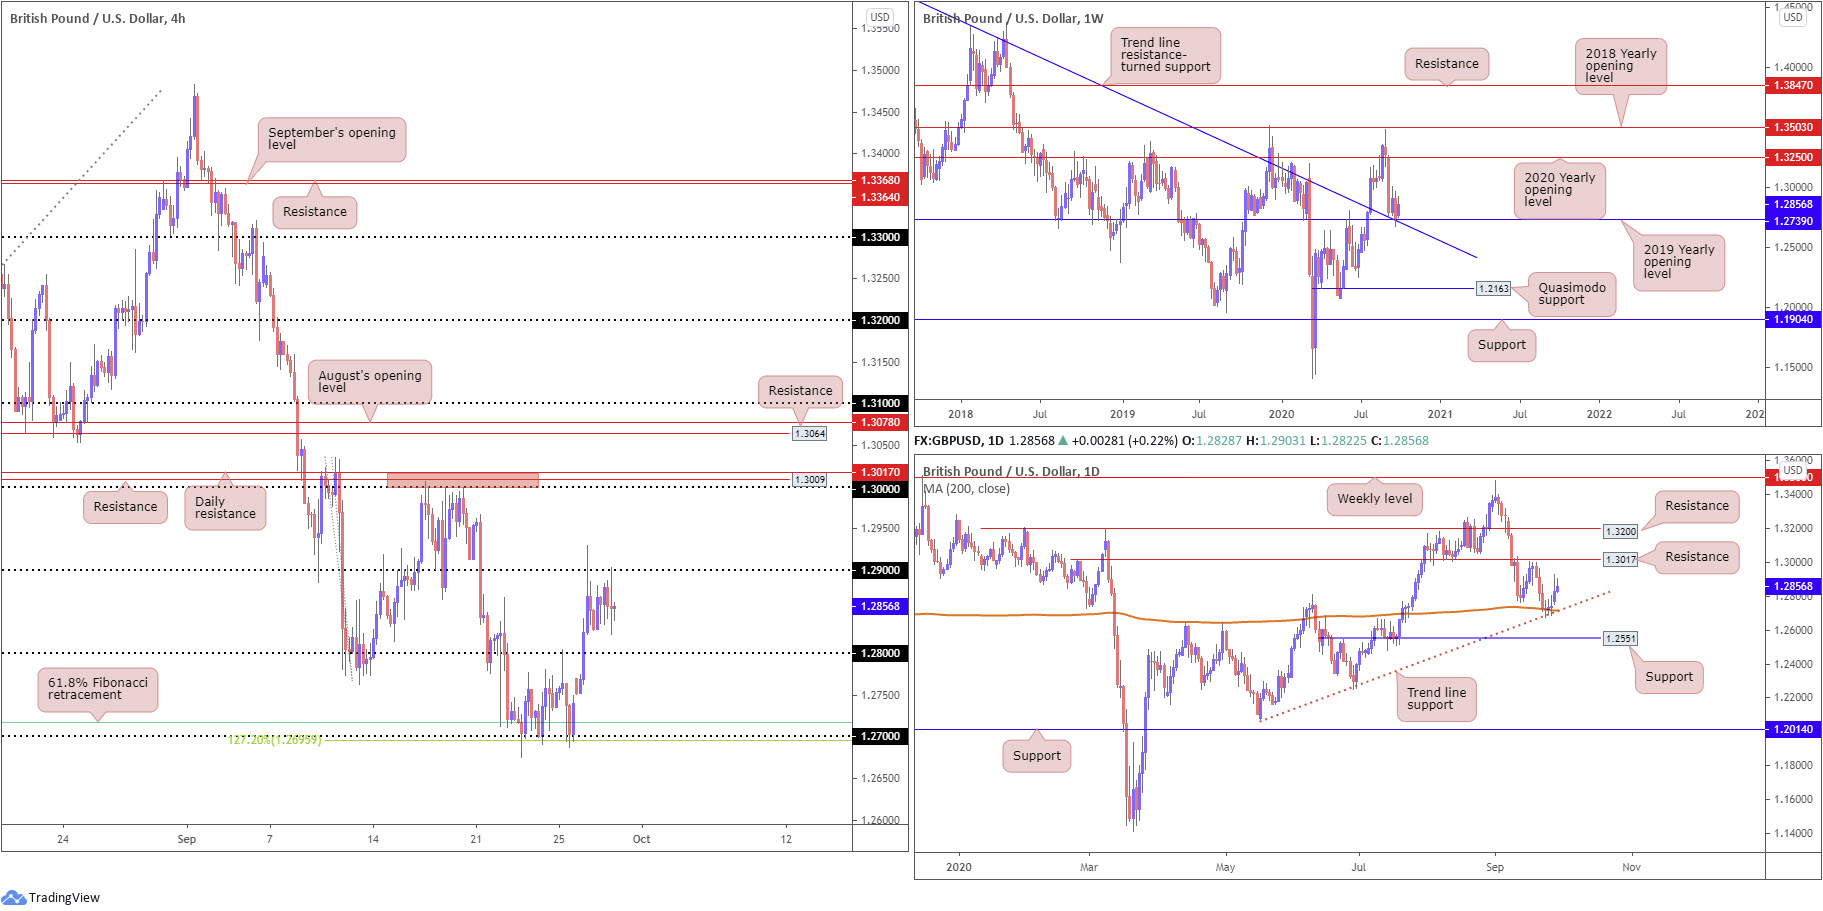
Sterling held onto a moderately bullish tone Tuesday, recording a fourth consecutive daily gain. From a technical standpoint, H4 recently knocked on the door of 1.29, a level that’s withstood two upside attempts this week. In spite of this, sellers offer a non-committal tone at the moment.
As highlighted in Tuesday’s technical briefing (italics), this week’s push higher is not a surprise.
The weekly timeframe engages with support at 1.2739, a 2019 yearly opening value. Technicians will acknowledge the level also merges with trend line resistance-turned support, extended from the high 1.5930. A rebound from here has room to advance as far north as the 2020 yearly opening value at 1.3250. In addition to weekly support, daily price crossed swords with the 200-day SMA (orange – 1.2715) and intersecting trend line support, extended from the low 1.2075. Further buying here throws daily resistance at 1.3017 into the mix. What was also attractive was the H4 timeframe holding off the 1.27 handle and converging 61.8% Fibonacci retracement at 1.2718, aided by a 127.2% Fibonacci extension point at 1.2695.
Areas of consideration:
As mentioned above, 1.29 is proving a problematic hurdle to overpower on the H4 right now, despite the higher timeframe supports in sight. Yet, given the lacklustre show from sellers here, a 1.29 breach is still potentially in store. Above 1.29, the river north on the higher timeframes appears ripple free until daily resistance at 1.3017, which happens to merge with the key figure 1.30 and H4 resistance at 1.3009.
- Dip-buying at any retest seen at 1.28 remains a possible scenario (should intraday sellers strengthen their grip).
- Another setup worth keeping a tab on is a H4 close above 1.29, signalling bullish scenarios in favour of reaching the 1.30 range.
Irrespective of the support used, conservative traders are likely to seek at least additional H4 candlestick confirmation before committing.
AUD/USD:
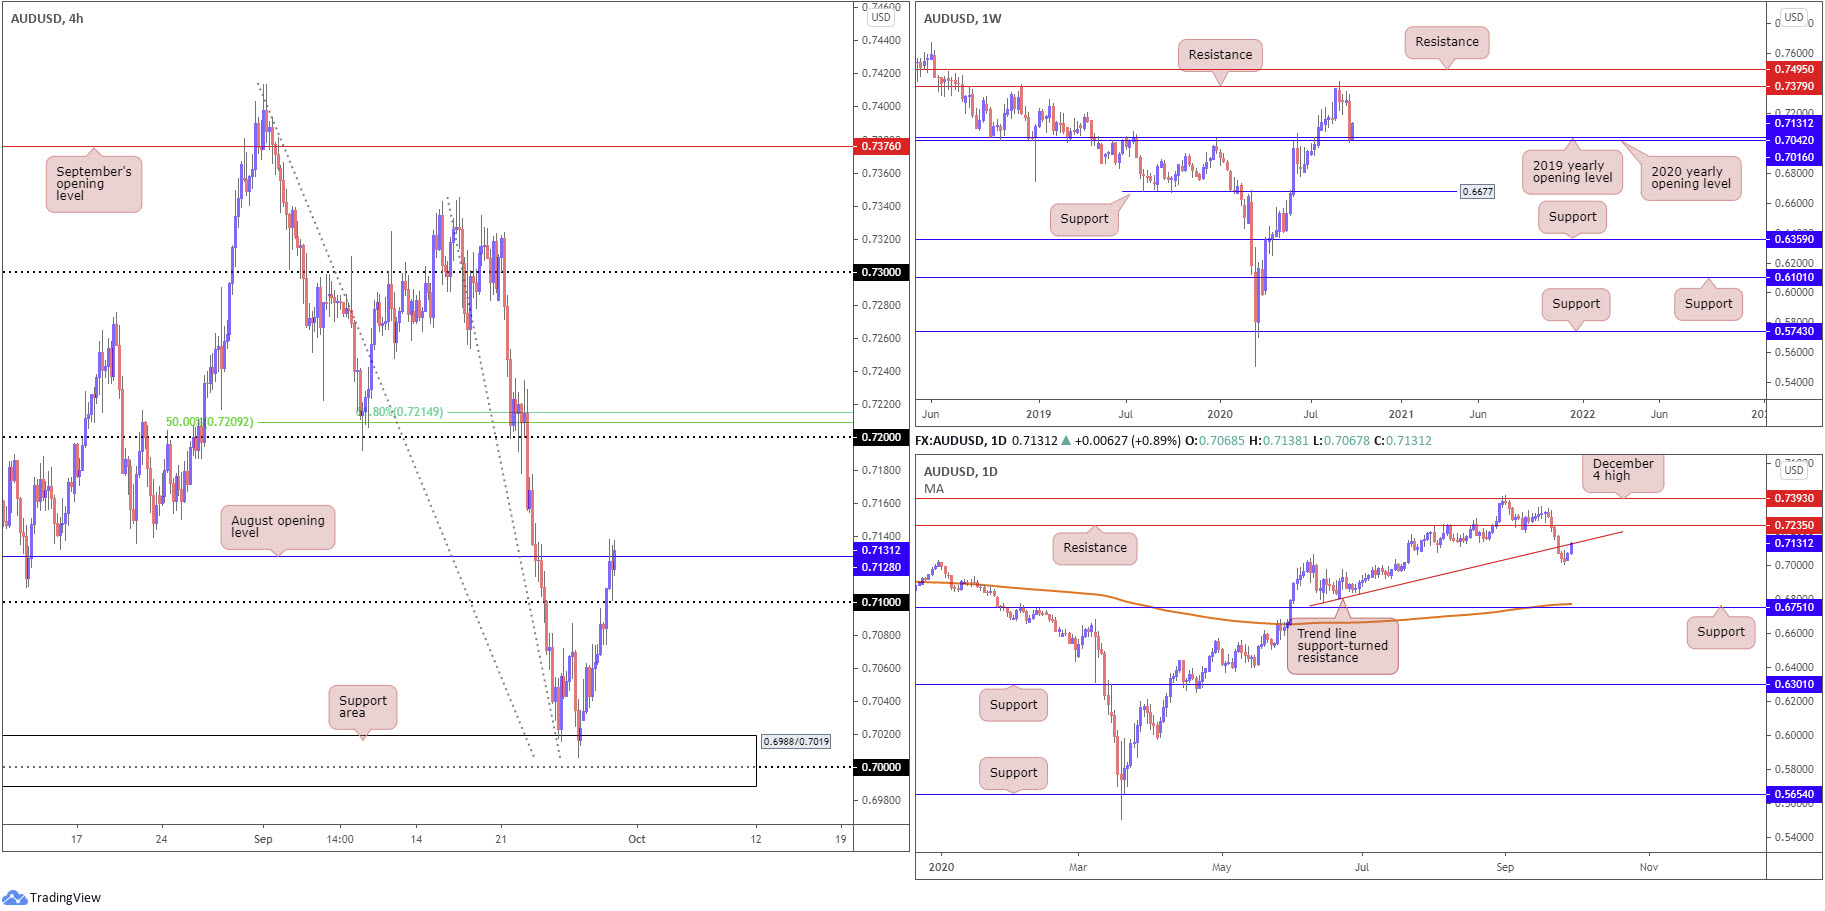
Recent buying took the AUD/USD exchange rate north of 0.71 on the H4 and, in recent hours, above August’s opening value at 0.7128. This potentially sets the technical stage for another wave of buying today, targeting the 0.72 handle, closely followed by a 50.0% retracement ratio at 0.7209 and a 61.8% Fibonacci retracement ratio at 0.7214.
In conjunction with the H4 timeframe, the weekly timeframe is attempting to pencil in a presence from the 2020 and 2019 yearly opening values at 0.7016 and 0.7042, respectively. Additional bullish sentiment from here could target as far north as resistance at 0.7379.
On the daily timeframe, however, we are shaking hands with a trend line support-turned resistance, extended from the low 0.6776. Breaking beyond here, as the weekly timeframe suggests, signals a run at resistance drawn from 0.7235.
Areas of consideration:
In favour of further buying, we have weekly price bouncing from support, in a market that’s trended higher since March. With that being the case, a H4 close above August’s opening value at 0.7128 may be interpreted as a bullish signal to approach 0.72. Granted, initiating long positions north of 0.7182 does involve going up against daily resistance, though given the support in this market right now, a reaction from the daily base is questionable.
USD/JPY:
USD/JPY is seen trading higher heading into the close of trade on Tuesday, despite the US dollar index trekking lower and US equities taking a hit. Overall, however, little change to technical structure has been seen.
From the weekly timeframe:
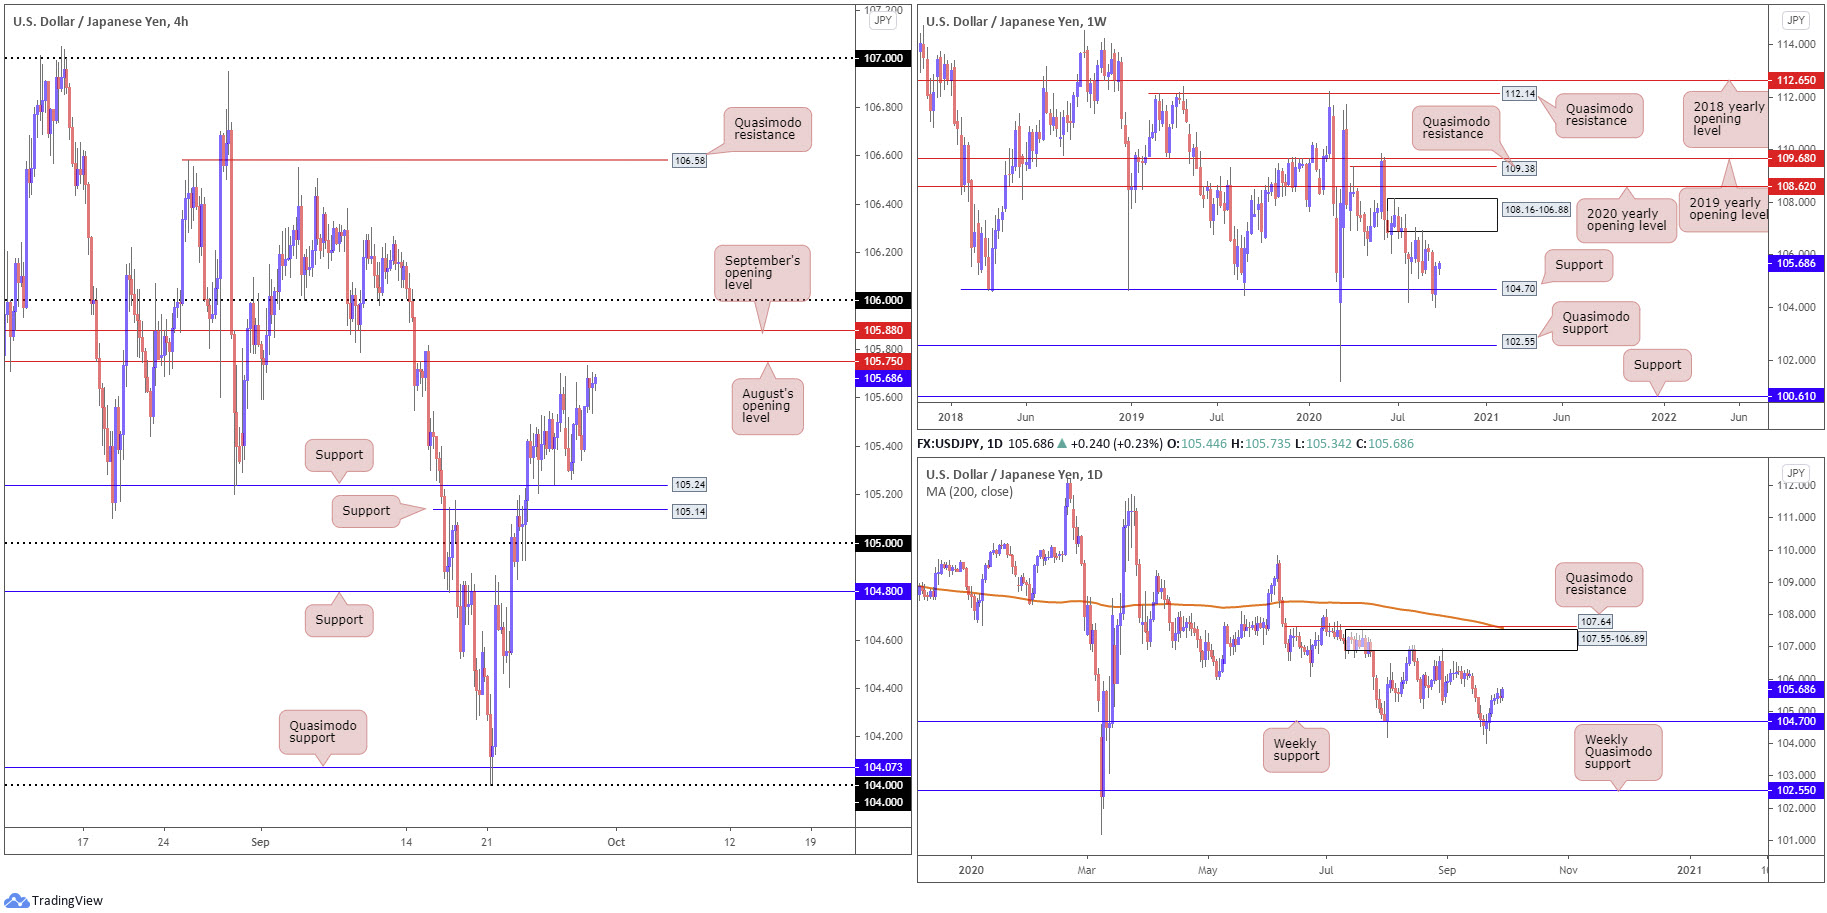
Supply at 108.16-106.88 remains prominent, capping upside since price made its way off support at 104.70 at the end of July. As evident from the weekly chart, the pair recently retested the 104.70 support. Although tumbling to lows at 104.00, the unit regained a strong footing above the aforementioned support last week, adding 100 points. While additional upside is perhaps the favoured course, Quasimodo support at 102.55 offers a feasible target beyond current support in the event we turn south.
Daily timeframe:
Supply at 107.55-106.89, an area housed within the lower boundary of weekly supply mentioned above at 108.16-106.88, has proved tough to takeover. The recovery from weekly support at 104.70 over the course of last week, fashioned by way of five consecutive daily bullish candles, highlights the possibility of readdressing the aforementioned supply. Of note, we can see the daily area also benefits from nearby Quasimodo resistance at 107.64 and the 200-day SMA (orange – 107.58).
H4 timeframe:
In recent analysis, research underlined possible support forming off 105.24, which, as you can see, came to fruition. Those long the 105.24 retest are likely looking for the currency pair to reach for August’s opening value at 105.75, with a break throwing September’s opening value at 105.88 and the 106 handle into the mix.
With Tuesday closing in on August’s opening value at 105.75, it is likely we’ll see the latter make an appearance today.
Areas of consideration:
Weekly support at 104.70 elbowing its way back into the spotlight, together with both the weekly and daily timeframes displaying room to reach 107ish (the underside of weekly/daily supply [106.88/89), underpins the possibility of further buying materialising north of 106 (H4). Above here, resistance appears limited until crossing paths with H4 Quasimodo resistance at 106.58, with a break exposing the 107 handle (and the lower edges of higher timeframe supply).
Given the prospect of higher levels, most buyers have likely held long positions off 105.24 (though the majority would have reduced risk to breakeven by now) in favour of a possible 106 break.
USD/CAD:
Despite the US dollar ending a shade higher against its Canadian counterpart Tuesday, technical structure remains unchanged heading into Wednesday’s sessions.
From the weekly timeframe
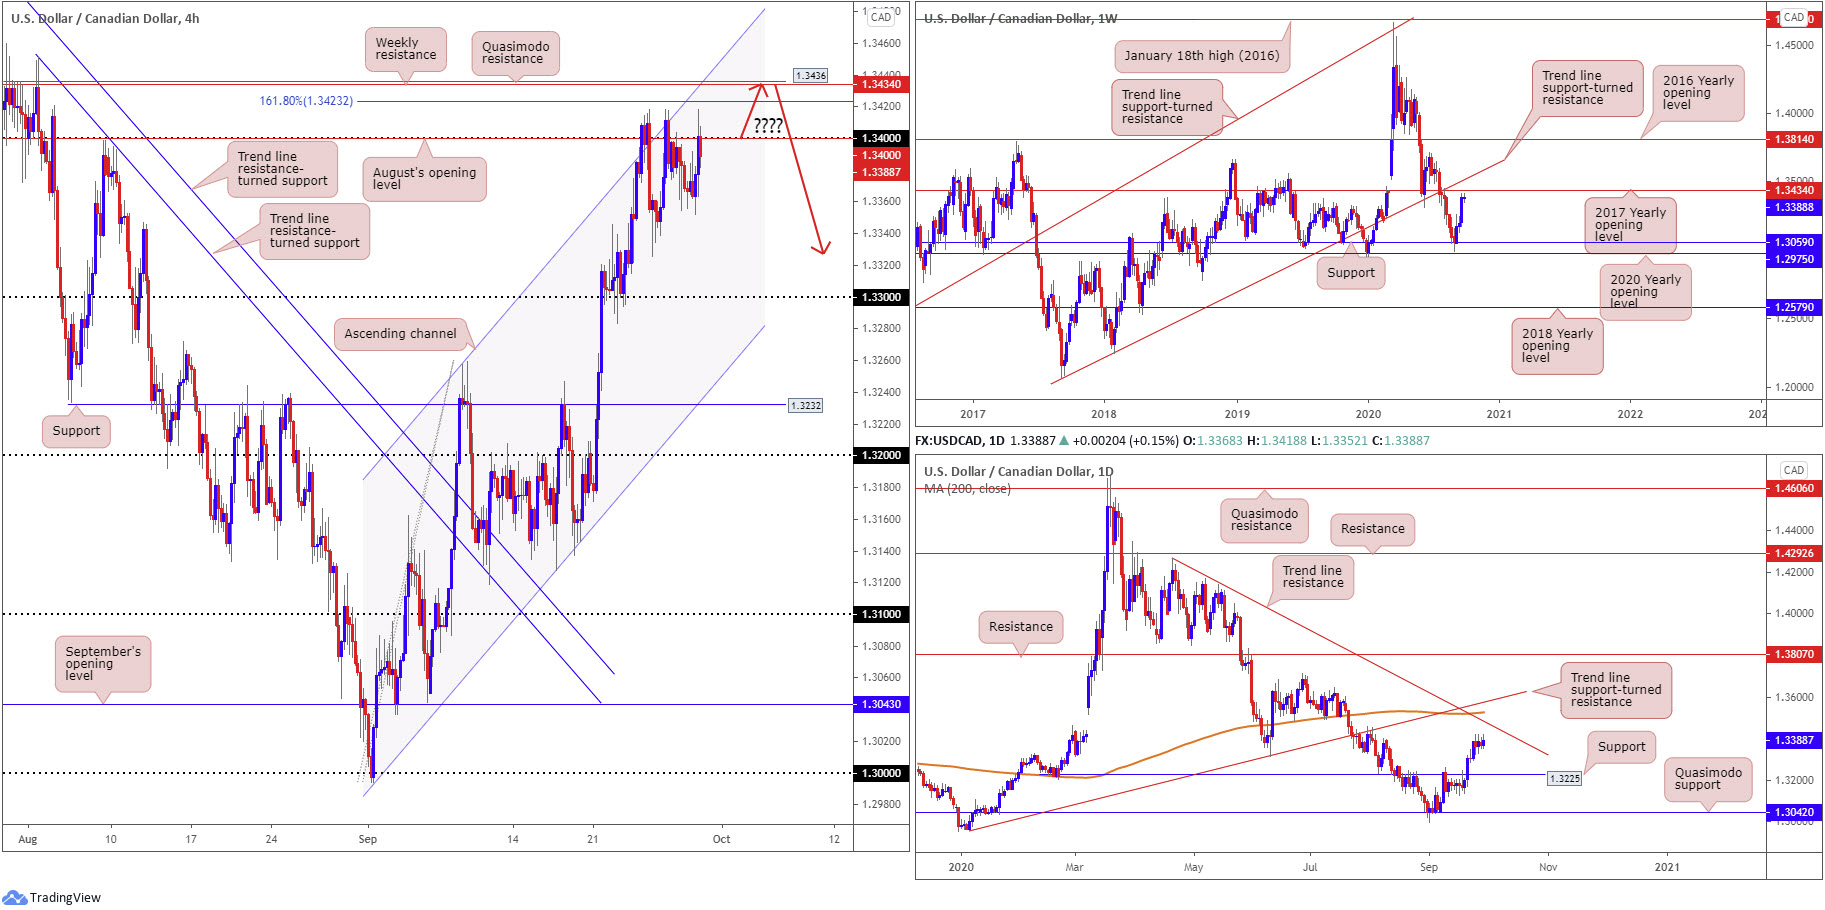
Following a retest at support from 1.3059 (pinned just north of the 2020 yearly opening value at 1.2975) at the beginning of September, the 2017 yearly opening value at 1.3434 (resistance) is now seen within touching distance, therefore a pullback could arise should we challenge the aforementioned area. Brushing aside the level, however, throws trend line support-turned resistance, taken from the low 1.2061, into the mix.
Daily timeframe:
Resistance is not expected to make an appearance until trend line resistance, etched from the high 1.4265, which happens to align closely with the 200-day SMA (orange – 1.3526). Also in close view is trend line support-turned resistance, taken from the low 1.2957. While the above hints at the possibility of follow-through buying, a pullback, perhaps caused by weekly resistance at 1.3434, to 1.3225 support is a scenario worth monitoring.
H4 timeframe:
A closer reading of price action on the H4 timeframe reveals 1.34 and August’s opening value, two levels that merge closely with channel resistance, taken from the high 1.3257, continue to hamper upside. Interestingly, directly above 1.34 lies an area of notable resistance, consisting of a 161.8% Fibonacci extension point at 1.3423, weekly resistance at 1.3434 (2017 yearly opening level) and Quasimodo resistance at 1.3436.
Areas of consideration:
Having seen technical movement offer a somewhat stationary tone off 1.34 so far this week, the areas of consideration remain unchanged.
The fact we’re closing in on weekly resistance at 1.3434, surrounded by a H4 Quasimodo resistance level at 1.3436 and a 161.8% H4 Fibonacci extension at 1.3423, buyers are unlikely to have the firepower to take these resistances down. With this in mind, a H4 close back under 1.34, off the noted resistances, is likely to stir sellers, targeting at least the 1.33 handle on the H4 (see red arrows).
USD/CHF:
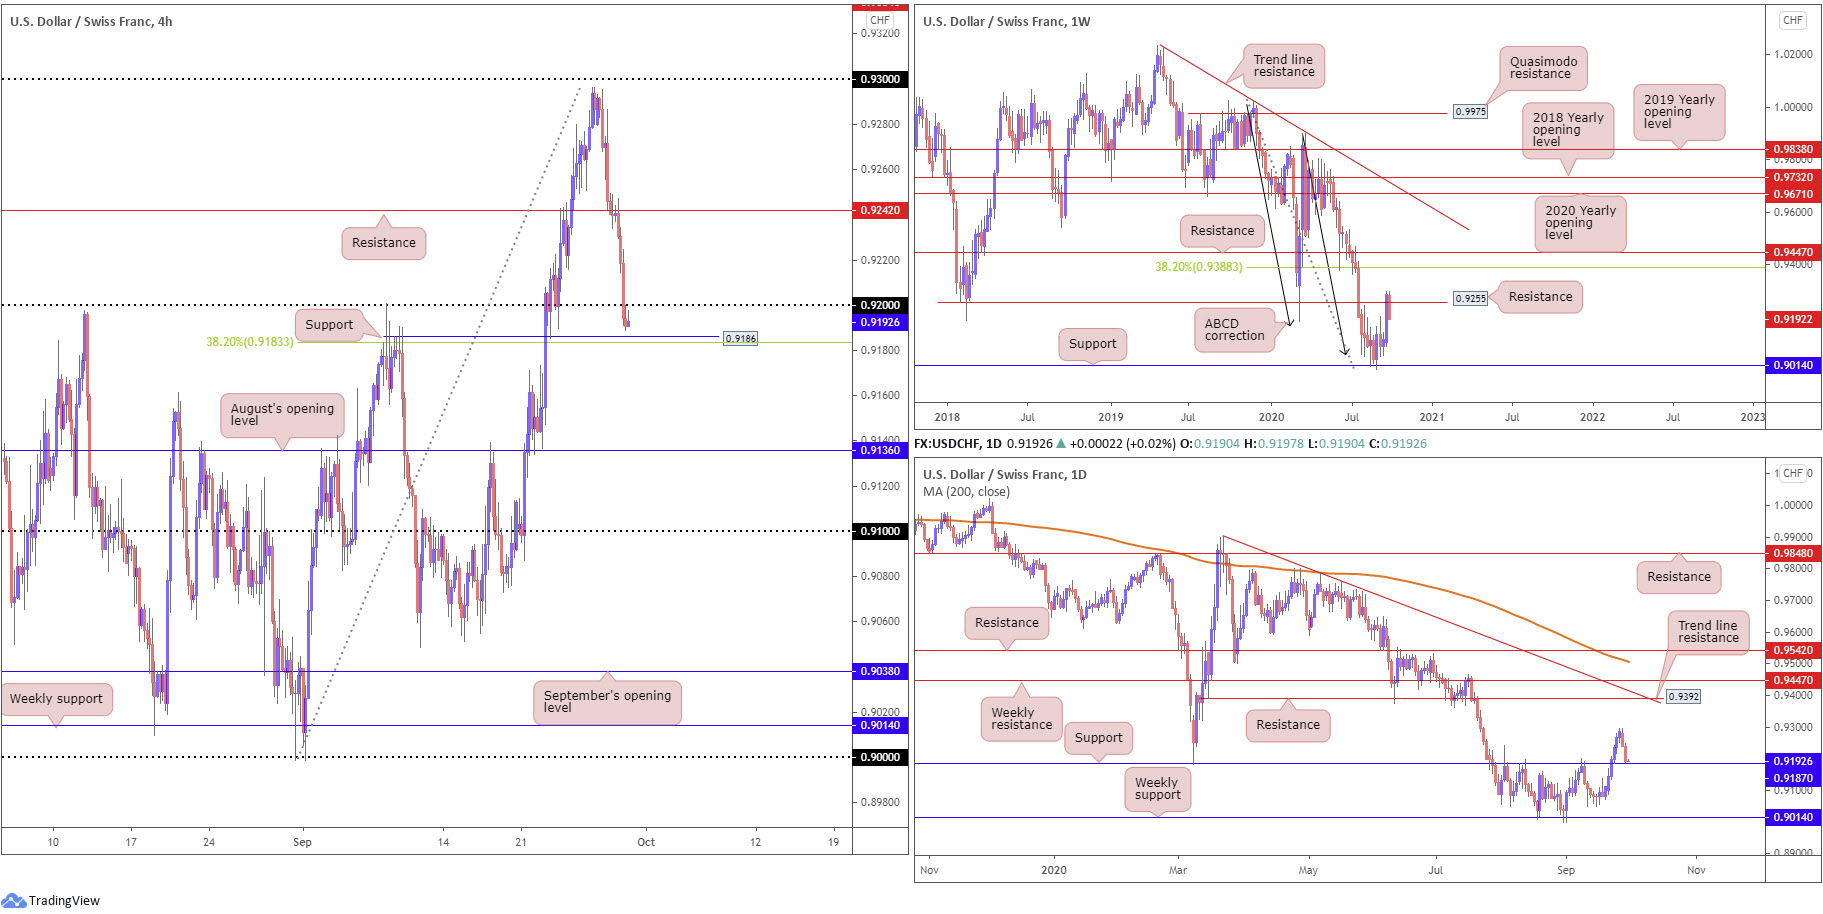
Risk aversion favouring a CHF bid, along with the US dollar index cementing additional losses on Tuesday, directed USD/CHF beneath H4 support at 0.9242 (now a serving resistance) and, in recent hours, under the 0.92 handle. This shines the headlights on nearby H4 support priced in at 0.9186, a prior Quasimodo resistance level, and a 38.2% Fibonacci retracement ratio at 0.9183. Absorbing bids at this point swings the pendulum in favour of further downside towards August’s opening value at 0.9136.
Longer-term movement recently shook hands with weekly resistance at 0.9255, likely adding to the recent downward pressure. In terms of the daily timeframe, support can be found at 0.9187, a level boasting clear history as an S/R level.
Areas of consideration:
Daily support at 0.9187, joined with H4 support at 0.9186 and a 38.2% H4 Fibonacci retracement ratio at 0.9183, could, despite weekly price demonstrating room for additional underperformance to support at 0.9014, be enough to entice buyers into the fight today. Many conservative players will seek a H4 close back above 0.92 before pulling the trigger.
Dow Jones Industrial Average:
US equities dipped Tuesday, following back-to-back gains. The Dow Jones Industrial Average slipped 131.40 points, or 0.48%; the S&P 500 dropped 16.13 points, or 0.48% and the Nasdaq traded lower by 32.28 points, or 0.29%.
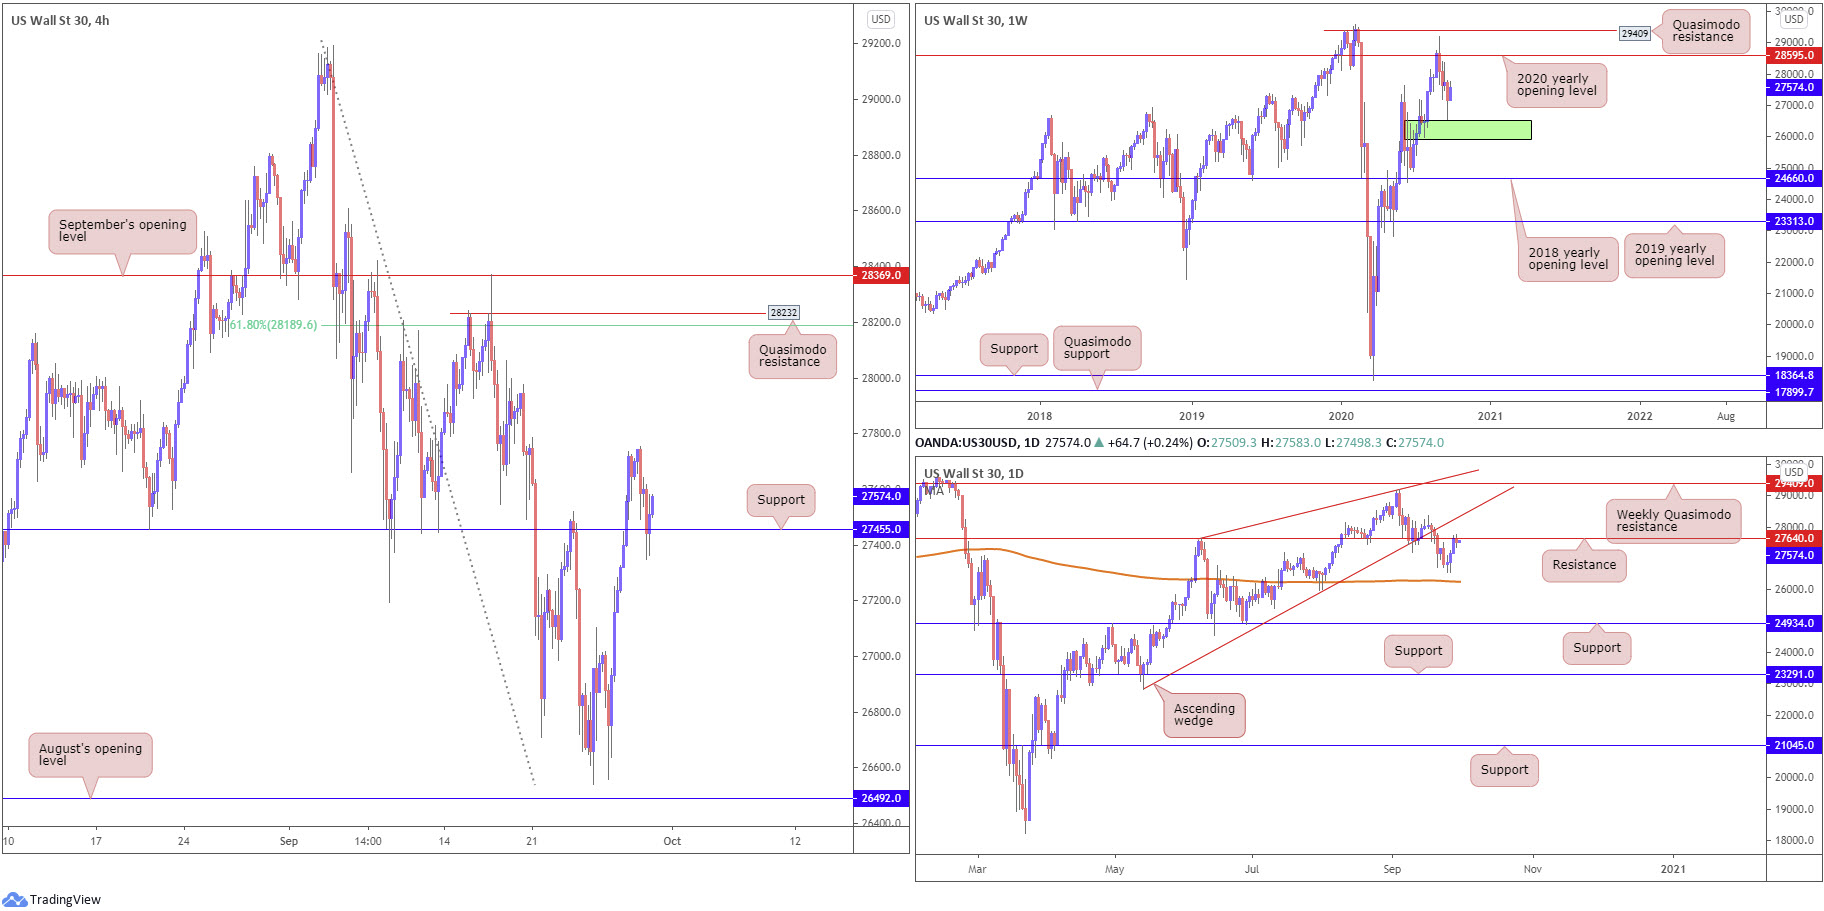
The technical landscape on the weekly timeframe reveals price recently recoiled a few pips north of demand (green) at 25916-26523. Should buyers maintain a presence, reaching for the 2020 yearly opening value at 28595, sited under Quasimodo resistance at 29409, is possible.
Trading on the daily timeframe found a floor ahead of the 200-day SMA (orange – 26257) into the close last week, which was clearly enough to tempt an extension to the upside early this week. As a result of this, resistance moved into play at 27640.
Amidst risk aversion, candle action dipped from the aforementioned daily resistance, enough to retest H4 support at 27455, which held into Tuesday’s close. Ultimately, buyers on the H4 chart are likely to hone in on Quasimodo resistance at 28232 and the closely converging 61.8% Fibonacci retracement ratio at 28189. Unable to hold gains off the current H4 support, nevertheless, could trigger selling to as far south as August’s opening value at 26492.
Areas of consideration:
The rebound from H4 support at 27455 is potentially reinforced by the weekly timeframe demonstrating room to advance towards 28595. The one cautionary point, of course, is daily resistance currently active at 27640.
Should buyers decide 27455 is a good fit for their trading plan, H4 Quasimodo resistance at 28232 is likely to call for attention in the event price explores higher territory.
XAU/USD (GOLD):
With the US dollar index sinking for a second consecutive session Tuesday, XAU/USD extended gains.
For those who read Tuesday’s technical briefing you may recall the following (italics):
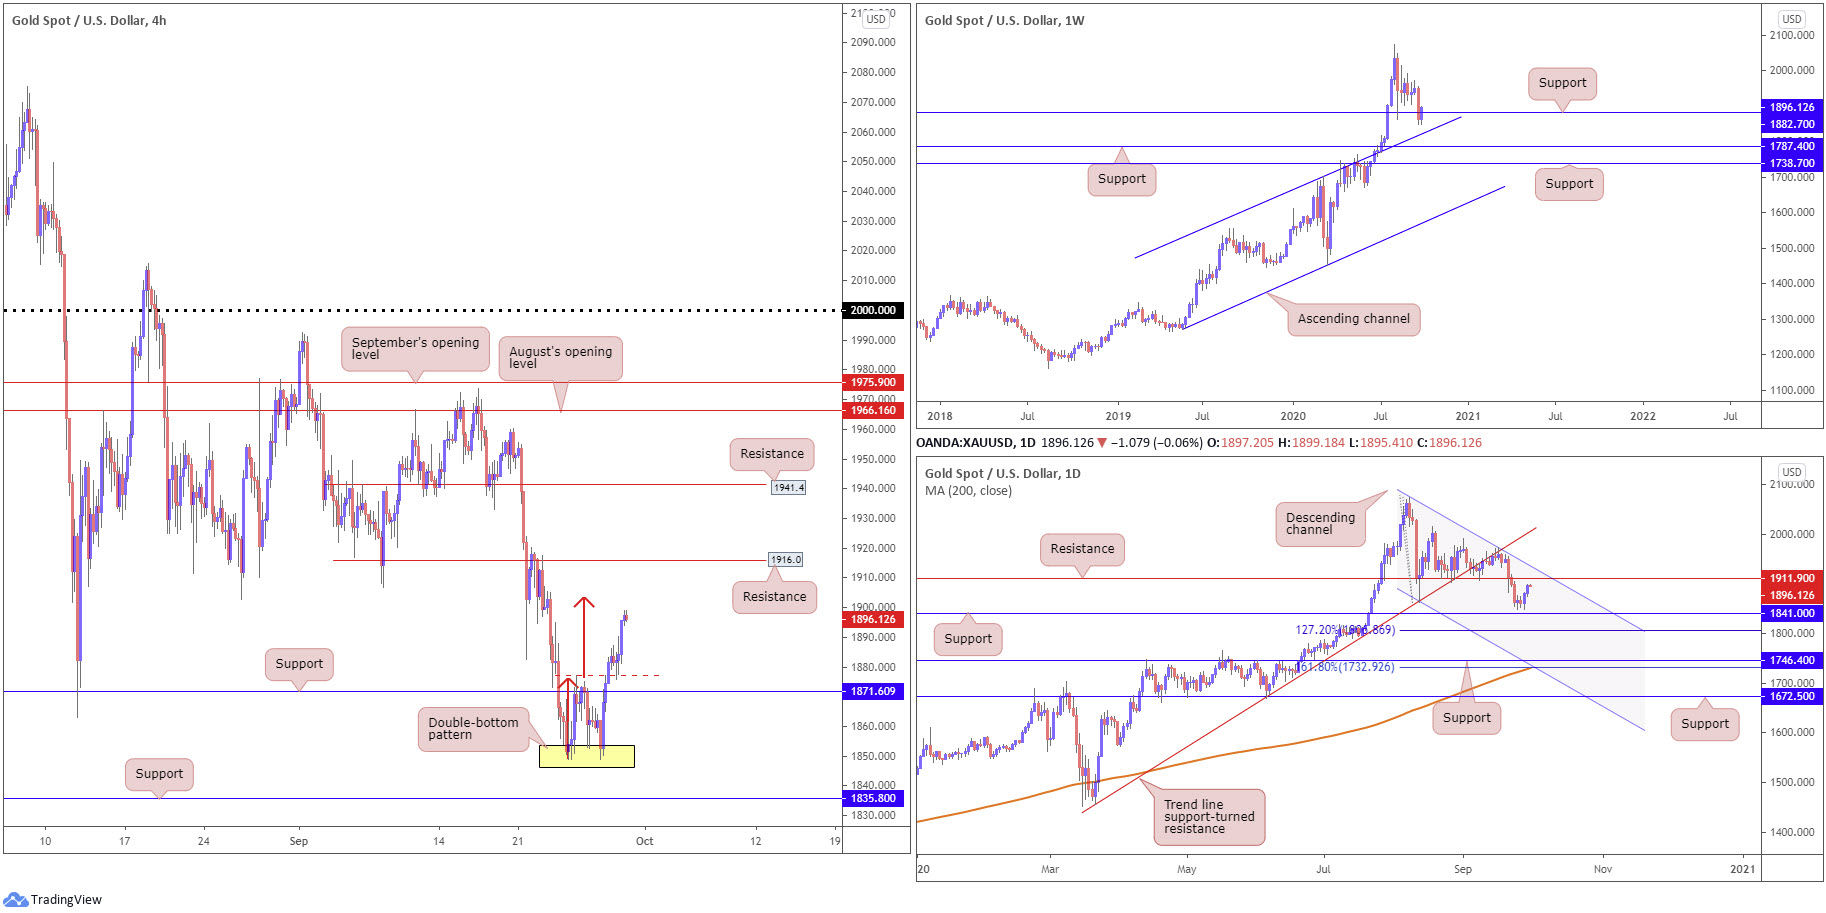
Spot gold adopted an offensive phase Monday, generating enough oomph to overthrow H4 resistance at $1,871 and the neckline of a double-bottom pattern (yellow – $1,849) at $1,877. As evident from the H4 chart, the double-bottom take-profit target sits at $1,903 (red arrows), followed by H4 resistance at $1,916.
Price action, as you can see, retested the $1,877 neckline on Tuesday and reached for higher ground, closing in on the double-bottom take-profit target at $1,903.
From the weekly timeframe, bullion is attempting to regain some status above support at $1,882, after missing channel resistance-turned support, etched from the high $1,703, by a hair. On the daily timeframe, room is seen for buyers until shaking hands with resistance at $1,911.
Areas of consideration:
With price approaching resistance on the H4 timeframe: the double-bottom take-profit target at $1,903, traders are likely to seek intraday bearish themes, despite the yellow metal trading decisively higher since 2016.
The combination of $1,903, H4 resistance at $1,916 and daily resistance from $1,911 might be sufficient to tempt sellers into the market today.
Breaking $1,916, on the other hand, may ignite further buying (in line with the current uptrend) and force H4 resistance at $1,941 and daily channel resistance, taken from the high $2,075, into play.
The accuracy, completeness and timeliness of the information contained on this site cannot be guaranteed. IC Markets does not warranty, guarantee or make any representations, or assume any liability regarding financial results based on the use of the information in the site.
News, views, opinions, recommendations and other information obtained from sources outside of www.icmarkets.com.au, used in this site are believed to be reliable, but we cannot guarantee their accuracy or completeness. All such information is subject to change at any time without notice. IC Markets assumes no responsibility for the content of any linked site.
The fact that such links may exist does not indicate approval or endorsement of any material contained on any linked site. IC Markets is not liable for any harm caused by the transmission, through accessing the services or information on this site, of a computer virus, or other computer code or programming device that might be used to access, delete, damage, disable, disrupt or otherwise impede in any manner, the operation of the site or of any user’s software, hardware, data or property.


