
A note on lower timeframe confirming price action…
Waiting for lower timeframe confirmation is our main tool to confirm strength within higher timeframe zones, and has really been the key to our trading success. It takes a little time to understand the subtle nuances, however, as each trade is never the same, but once you master the rhythm so to speak, you will be saved from countless unnecessary losing trades. The following is a list of what we look for:
- A break/retest of supply or demand dependent on which way you’re trading.
- A trendline break/retest.
- Buying/selling tails – essentially we look for a cluster of very obvious spikes off of lower timeframe support and resistance levels within the higher timeframe zone.
- Candlestick patterns. We tend to only stick with pin bars and engulfing bars as these have proven to be the most effective.
EUR/USD:
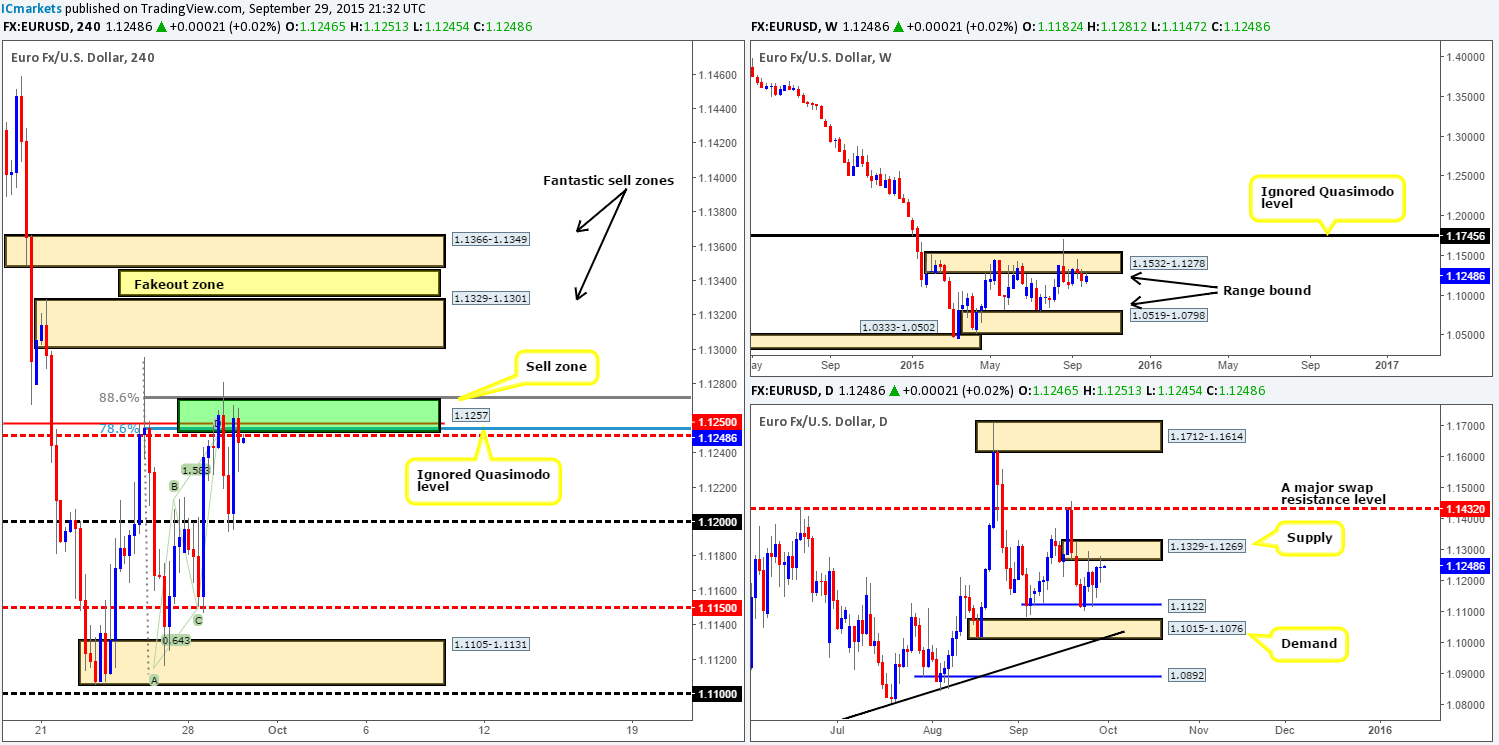
For those who read out previous report on the EUR/USD (http://www.icmarkets.com/blog/tuesday-29th-september-daily-technical-outlook-and-review/) you may recall us noting to watch for a (confirmed) sell between 1.1250/1.1270. In addition to this, we also mentioned that for traders interested in shorting here need to be prepared for the possibility of a fakeout higher to take stops and connect with daily supply at 1.1329-1.1269. As can be seen on the chart, this played out perfectly. A fakeout above our sell zone was indeed seen, and price sold off down to psychological support at 1.1200. Well done to any of our readers who managed to lock in some green pips from this move!
For all that though, price quickly corrected itself from 1.1200 going into the American session, pushing the EUR back up to where it began – our aforementioned sell zone, consequently forming an indecision candle over on the daily scale.
Given the above, do we believe a second short could be possible from this area today? Of course, it is possible, but it’s not something we’d label high probability. Instead, we now have our beady little eye on the two fresh supply zones sitting just above (1.1329-1.1301/ 1.1366-1.1349). The lower of the two zones sits within the extremes of the aforementioned daily supply, so it’s highly likely we’ll see a bounce from here at the very least. However, seeing as this area is positioned only a few pips below the upper supply zone, it’s very possible a fakeout here will be seen, and this is what we’re looking to trade, hence the fakeout zone!
From our perspective, lower timeframe confirmation will be needed if one is thinking of shorting the lower zone. Nonetheless, if you’re looking to trade the potential fakeout above this area, as we are, a pending short order at 1.1346 might be the best tool for the job in order to catch any quick spike seen. It will be interesting to see how this plays out!
Levels to watch/live orders:
- Buys: Flat (Stop loss: N/A).
- Sells: 1.1329-1.1301 [Tentative- confirmation required] (Stop loss: dependent on where one confirms this area) 1.1346 (Stop loss: 1.1369).
GBP/USD:
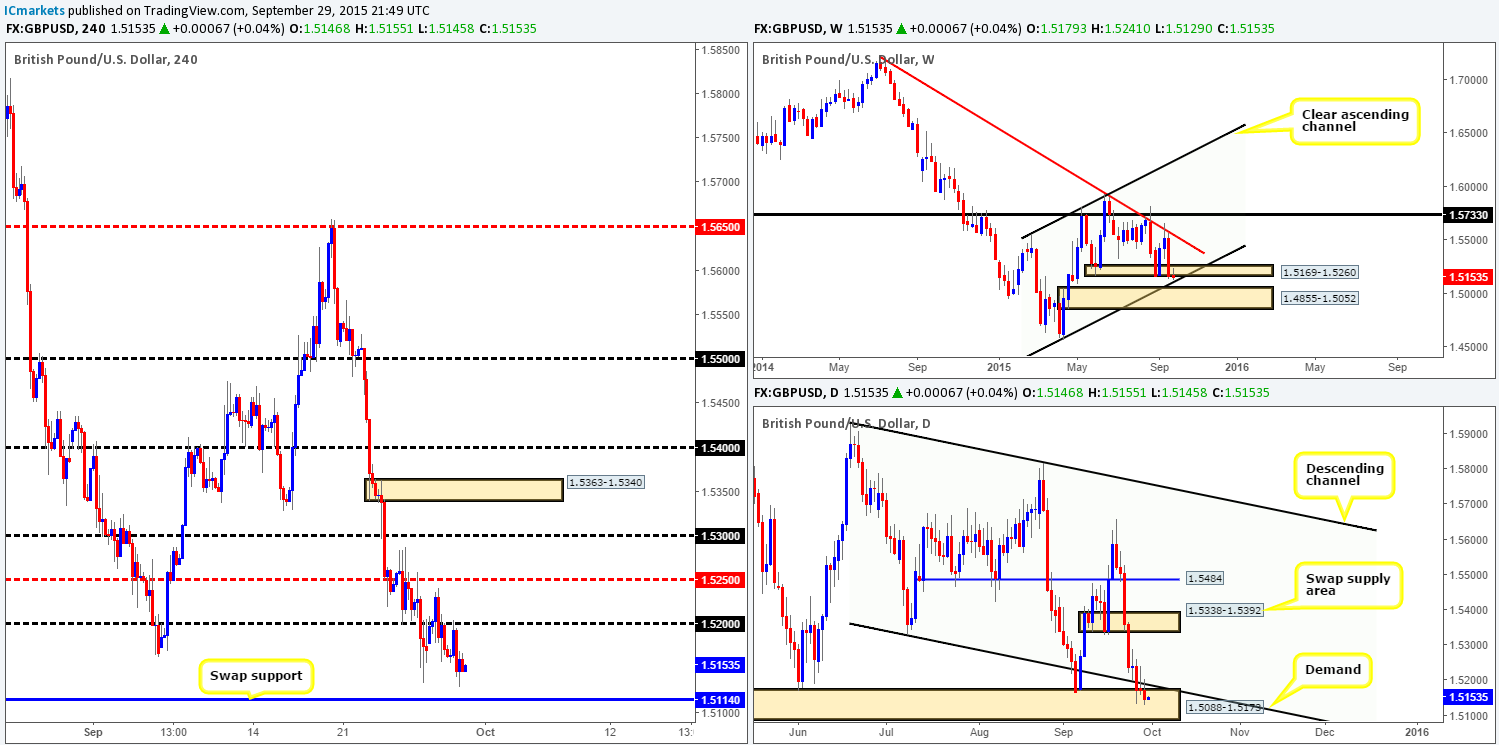
As can be seen on the 4hr chart, Cable did indeed see a decline in value during yesterday’s trade, as we reported may happen in our previous analysis (http://www.icmarkets.com/blog/tuesday-29th-september-daily-technical-outlook-and-review/). Candle action beautifully retested the underside of psychological resistance1.5200 and reached lows of 1.5129 on the day. Seeing as price has yet to hit the swap support level at 1.5114, our level of interest, much of the following analysis will remain the same as the previous…
- Weekly shows price lurking around the lower limits of a weak-looking demand base at 1.5169-1.5260. With this, we believe Cable will drill a little lower to either the near-term channel support line (1.4564) or demand taken from 1.4855-1.5052 before any noteworthy correction takes place.
- As expected, the daily demand area at 1.5169-1.5260 has been tested further. There’s a strong possibility that price will continue to do so as well, at least until it connects with the aforementioned weekly channel support which converges with the lower limits of this demand area.
- Taking into account the higher timeframe structures (see above), and the likelihood of price dropping lower, the 4hr swap (support) level we mentioned above is a barrier we believe to be a perfect buy zone for (confirmed) longs. The reason being is that It merges not only with the lower limits of daily demand mentioned above at 1.5088-1.5173, but also with the aforementioned weekly channel support, thus making it a very high-probability turning point in this market.
Levels to watch/ live orders:
- Buys: 1.5114 [Tentative – confirmation required] (Stop loss: dependent on where one confirms this level).
- Sells: Flat (Stop loss: N/A).
AUD/USD:
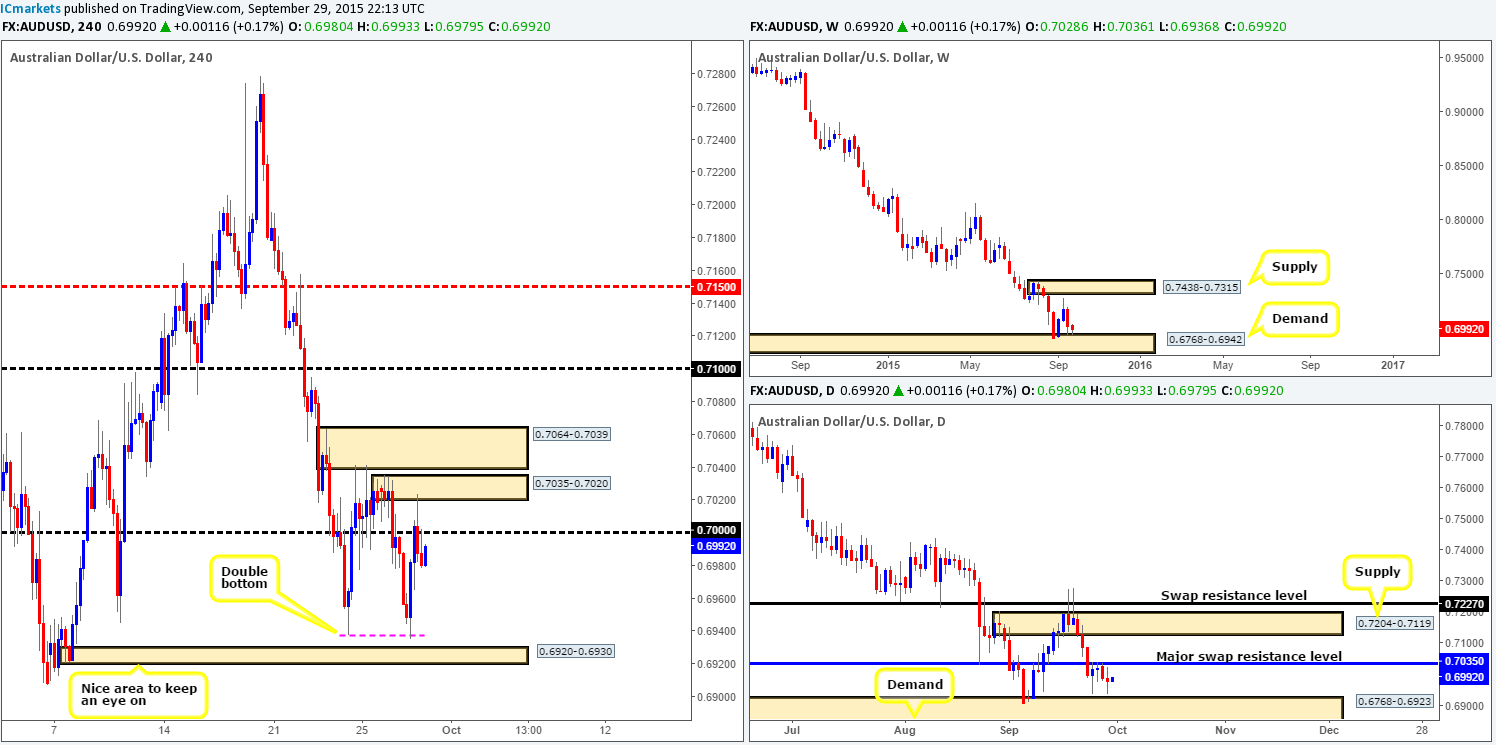
During the course of yesterday’s sessions, the AUD/USD fell sharply shortly after retesting the underside of psychological resistance 0.7000. This saw price one again fake below demand at 0.6945-0.6962 (erased from the chart), forming an almost perfect double bottom, which forced price north up to supply coming in at 0.7035-0.7020.
The reaction seen from this supply did, as you can see, push price back beneath the 0.7000 number and is at the time of writing, holding firm. With the possibility of a further decline from 0.7000 today, where does our team stand in the bigger picture? Well, weekly action remains kissing the top-side of demand at 0.6768-0.6942, while on the daily chart; market action printed an indecision candle between swap resistance at 0.7035 and demand at 0.6768-0.6923.
Now, given that price has yet to connect with daily demand, and the fact that traders are likely watching the double bottom formation on the 4hr chart like a hawk for longs, where do we see this pair headed to today? For one, we are relatively confident that if price does drop from 0.7000, the double bottom will not hold and price will fake lower into 4hr demand at 0.6920-0.6930. Why? Our rationale comes from this small demand zone converging with both the aforementioned higher timeframe demand areas, making this, at least in our opinion, a very nice zone to look for (confirmed) longs into this market.
However, as we mentioned in yesterday’s report, one still needs to tread carefully here. Reason being is that the Aussie remains in a humongous downtrend at present, and has already taken out several weekly demand zones very similar to the current! At this point, you may be thinking why are they not looking to sell 0.7000 with the trend. Granted, this a fair point, and our only reason for not doing so is simply because the current weekly demand may bounce price as it did three weeks ago.
Levels to watch/ live orders:
- Buys: 0.6920-0.6930 [Tentative – confirmation required] (Stop loss: dependent on where one confirms this area).
- Sells: Flat (Stop loss: N/A).
USD/JPY:
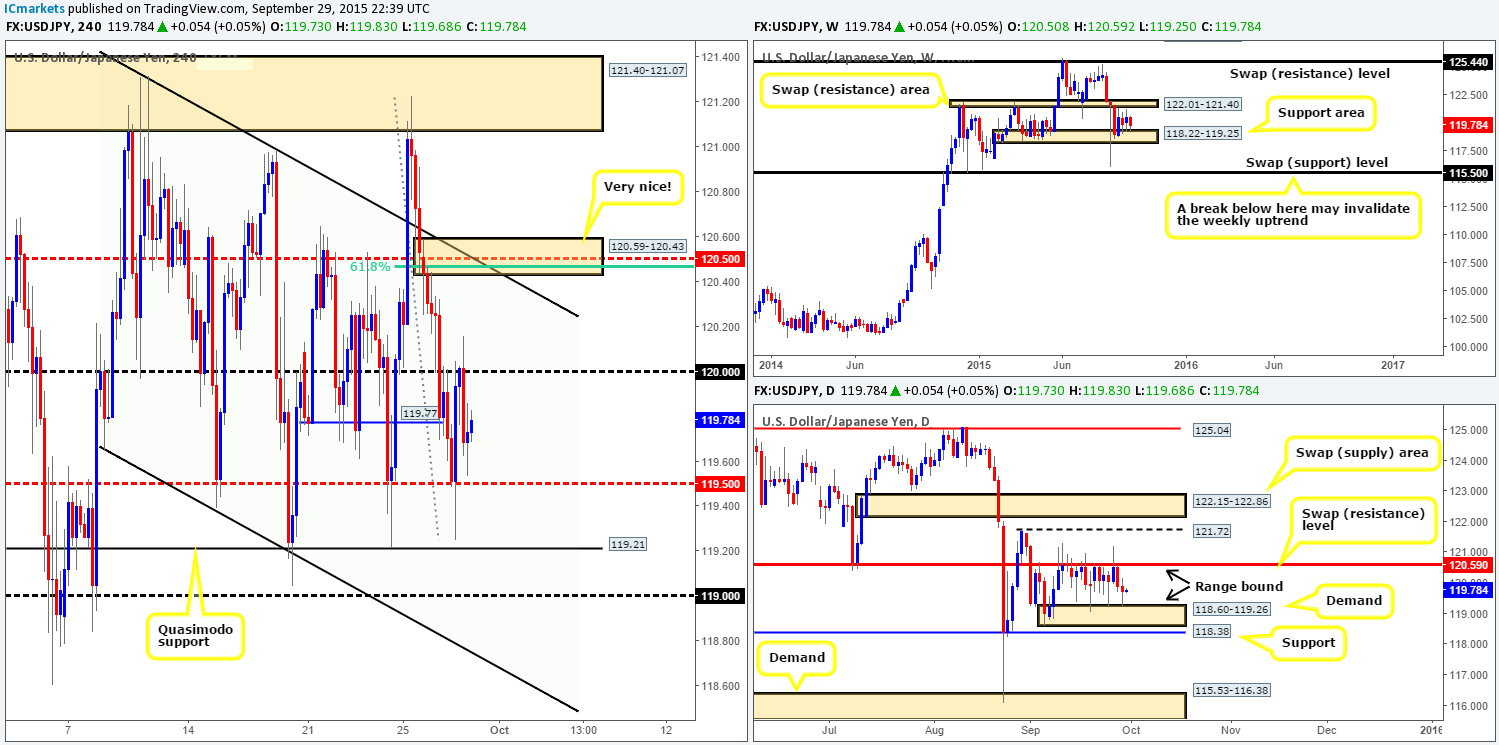
Recent action shows 119.77 failed to hold and as a result a somewhat whipsaw motion was seen in this market yesterday. Price continued lower, spiking below mid-number support 119.50, just missing Quasimodo support at 119.21. Following this, price aggressively rallied back up to 120.00 and shortly after pushed down to just above 119.50. A bit of a ‘yo-yo’ day for this pair we sure you’ll agree.
In view of price currently trading mid-range between 120.00/119.50 at the moment, where is this market likely headed today? Considering that this pair has just bounced off of not only a weekly support area at 118.22-119.25, but also a small daily demand zone at 118.60-119.26, it’s likely we may see an attack on 120.00. Given that 120.00 coincides with little on the higher timeframe structures, we believe this level could be taken out today, and an advance seen up to mid-number resistance 120.50, which is a lovely sell zone due to the following:
- 61.8% Fib resistance at 120.46.
- Supply coming in at 120.59-120.43.
- Channel resistance (121.31).
- Daily swap (resistance) at 120.59, which currently forms the upper limit of the daily consolidation being seen at the moment.
Other than 120.50, the only other place we’d feel comfortable buying from is 119.21 – the Quasimodo support level, due to this beauty lining up with both the current weekly support area and also the daily demand zone.
Levels to watch/ live orders:
- Buys: 119.21 [Tentative – confirmation required] (Stop loss: dependent on where one confirms this level).
- Sells: 120.59-120.43 [Tentative – confirmation required] (Stop loss: 120.61).
USD/CAD:
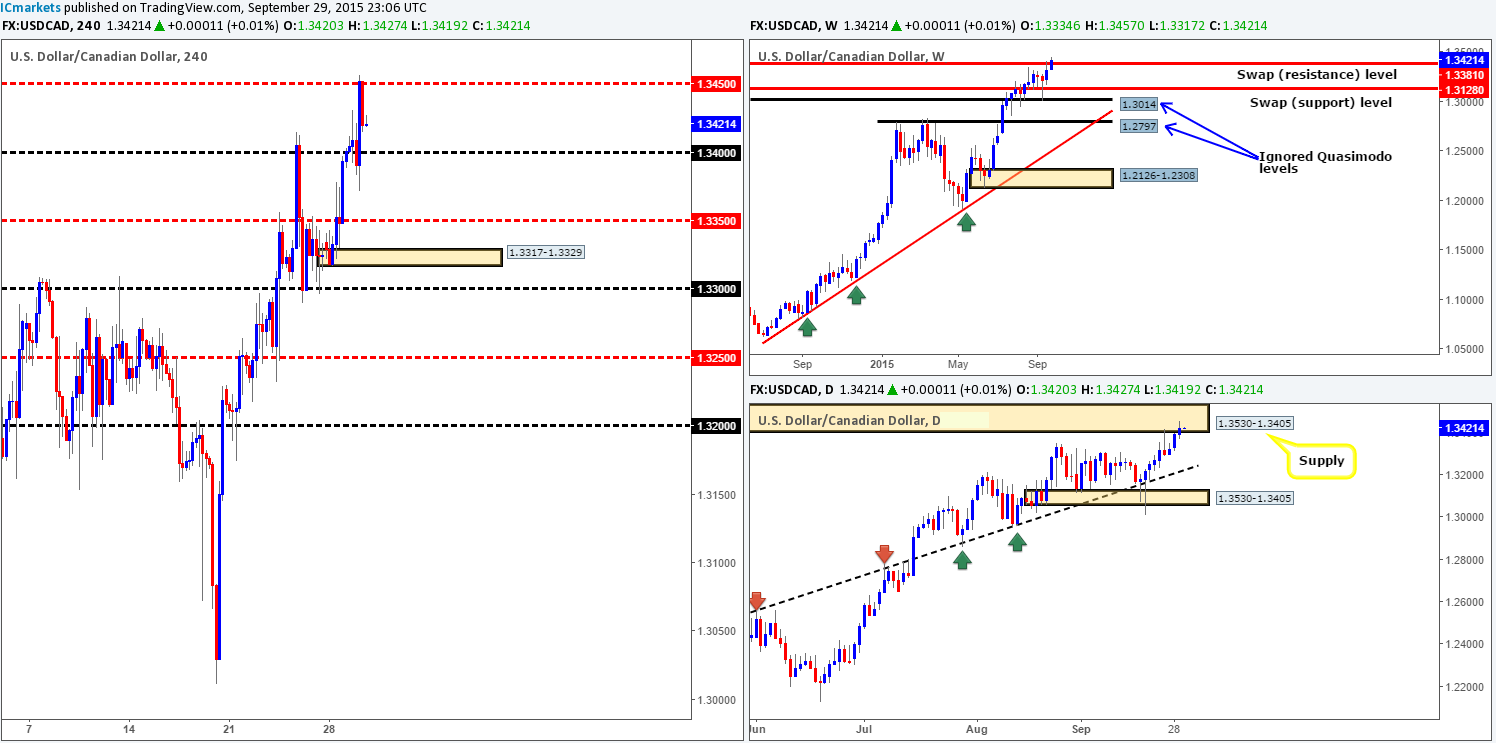
Beginning with the weekly timeframe this morning, we can see that price is currently poking its head above the swap resistance level at 1.3381 at the moment. However, before we all go shouting ‘BREAKOUT!’ It may be worth waiting for this weekly candle to close up shop before presuming that offers have been consumed here. Moving one lower into the pits of the daily timeframe, it’s clear to see that the buyers and sellers are currently battling for position within supply drawn from 1.3530-1.3405.
Turning our attention to the 4hr timeframe show us that psychological resistance 1.3400 was aggressively taken out yesterday, and price hit and slightly extended past mid-number resistance 1.3450, reaching fresh 11-year highs of 1.3457.
With weekly buyers possibly trying to push this market higher, and daily sellers attempting to control this these bids (see above), it’s difficult for us to be confident that the bounce from 1.3450 is legit, and also if the buyers actually have the strength to continue this upside momentum.. Therefore, until clearer price action presents itself, opting to stand on the sidelines here may very well be the best path to take today.
Levels to watch/ live orders:
- Buys: Flat (Stop loss: N/A).
- Sells: Flat (Stop loss: N/A).
USD/CHF:
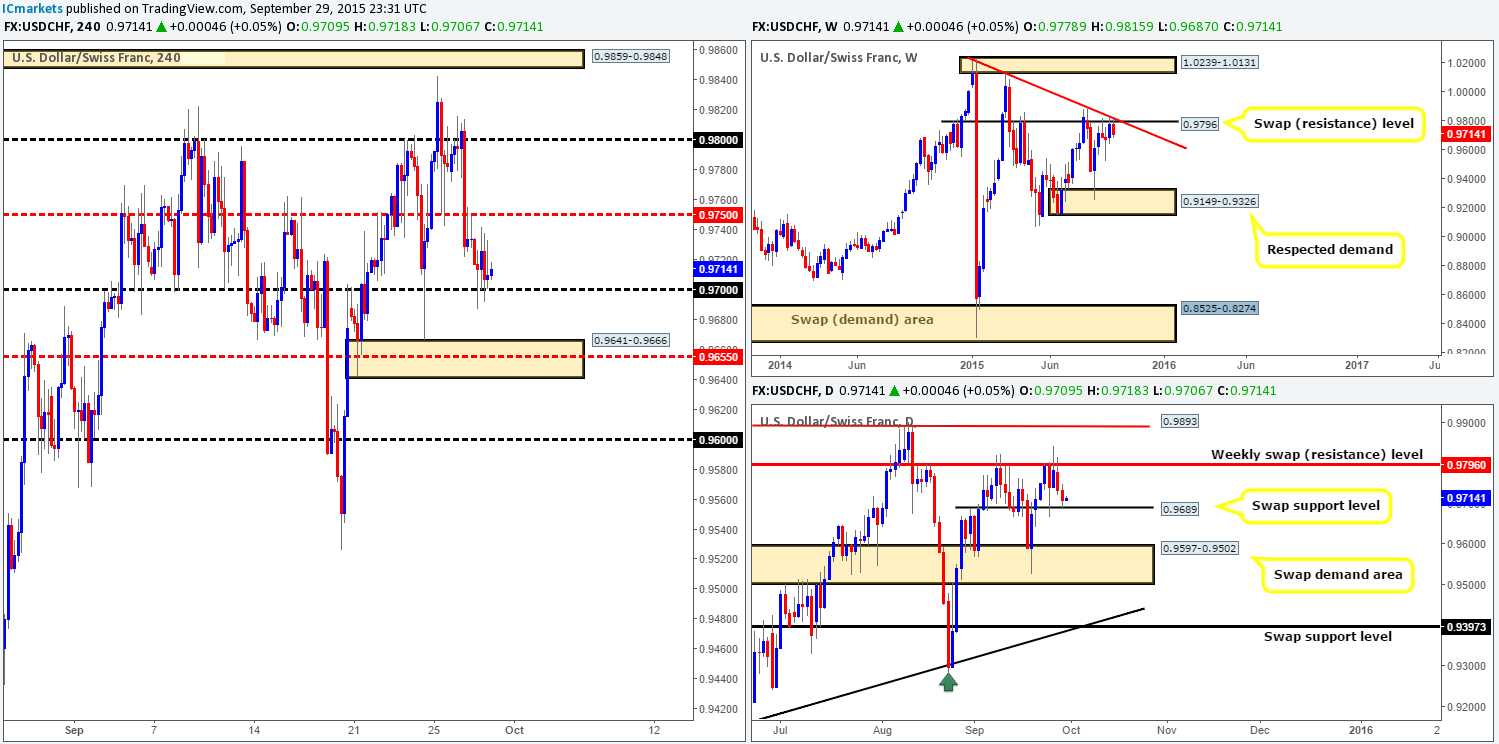
For those who read our previous report on the USD/CHF (http://www.icmarkets.com/blog/tuesday-29th-september-daily-technical-outlook-and-review/), you may recall us mentioning to be prepared for a retest of mid-number resistance 0.9750 before prices dropped lower. As can be seen from the 4hr chart, price did exactly that and hit our first area of interest – the 0.9700 figure. Unfortunately, we could not pin-point a suitable lower timeframe entry on the retest here so we missed out! Well done to any of our readers who managed a short from here.
With price continuing to flirt with 0.9700, is this number likely to hold going into the more active sessions today? From looking at the daily timeframe, our answer would be a resounding YES, since this number lines up with a swap support level at 0.9689. Despite this, when we look above to the weekly action and see price currently selling off from a swap resistance level at 0.9796, our directional bias changes somewhat. This is certainly not to say that 0.9700 is not worthy of a buy today, it merely means one should be cautious trading this number, and that is where lower timeframe confirmation really shows it use!
In the event that 0.9700 convincingly breaks lower, one could look to play any retest seen at the underside of this level, targeting 4hr demand at 0.9641-0.9666, followed by 0.9600 which is where we’d liquidate our full position. The reason for choosing 0.9600 is simply because below the aforementioned daily swap (support) level (which would likely be consumed if 0.9700 is) the next downside target to watch on the daily is a swap demand area at 0.9597-0.9502, which converges with 0.9600!
Levels to watch/ live orders:
- Buys: 0.9700 [Tentative – confirmation required] (Stop loss: dependent on where one confirms this level).
- Sells: Watch for bids at 0.9700 to be consumed and then look to enter on any retest seen at this level (confirmation required).
DOW 30:
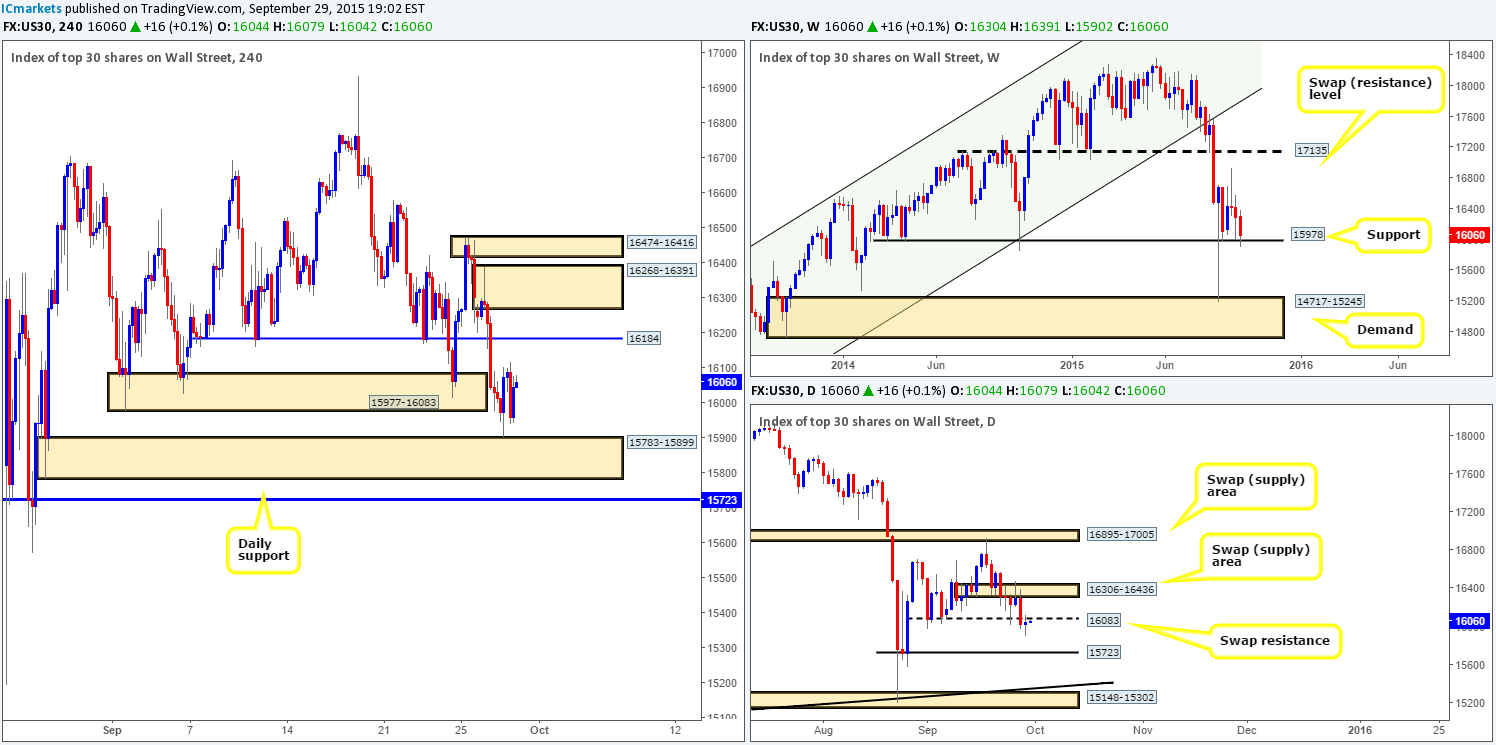
The DOW is currently printing some very interesting price action at present. The weekly timeframe shows that as of yet there has been no ‘real’ attempt to push below support at 15978. Meanwhile, on the daily scale, price retested the underside of, what is now, a swap resistance barrier at 16083, consequently forming an indecision candle in the process.
Down on the 4hr timeframe, we can see that 4hr demand at 15977-16083 eventually gave way in early trade yesterday. This pulled prices down to just above demand coming in at 15783-15899, which has so far held firm.
So, let’s just outline what we have here:
- Weekly is trading at support (15978).
- Daily is trading at resistance (16083).
- 4hr is currently hovering above demand (15783-15899).
Given the points above, there is not much to go on right now. We certainly would not want to be trading at current prices. However, should price pullback to retest the current 4hr demand area once more today, there could be a possible (confirmed) long trade to be had from here. Granted, by entering long from here you would be likely going up against daily flow, but at the same time, you’d be in line with weekly buyers from support at 15978!
Conversely, if price rallies from its current location and connects with 16184 today, a potential (confirmed) short could present itself since this level sits just above the aforementioned daily swap (resistance) level. Nevertheless, selling into weekly support is not something we’d feel comfortable being a part of, so for any traders who do wish to short here, trade cautiously!
Levels to watch/ live orders:
- Buys: 15783-15899 [Tentative – confirmation required] (Stop loss: dependent on where one confirms this area since there is a chance price may fakeout below to daily support at 15723).
- Sells: 16184 [Tentative – confirmation required] (Stop loss: dependent on where one confirms this level).
XAU/USD: (Gold)
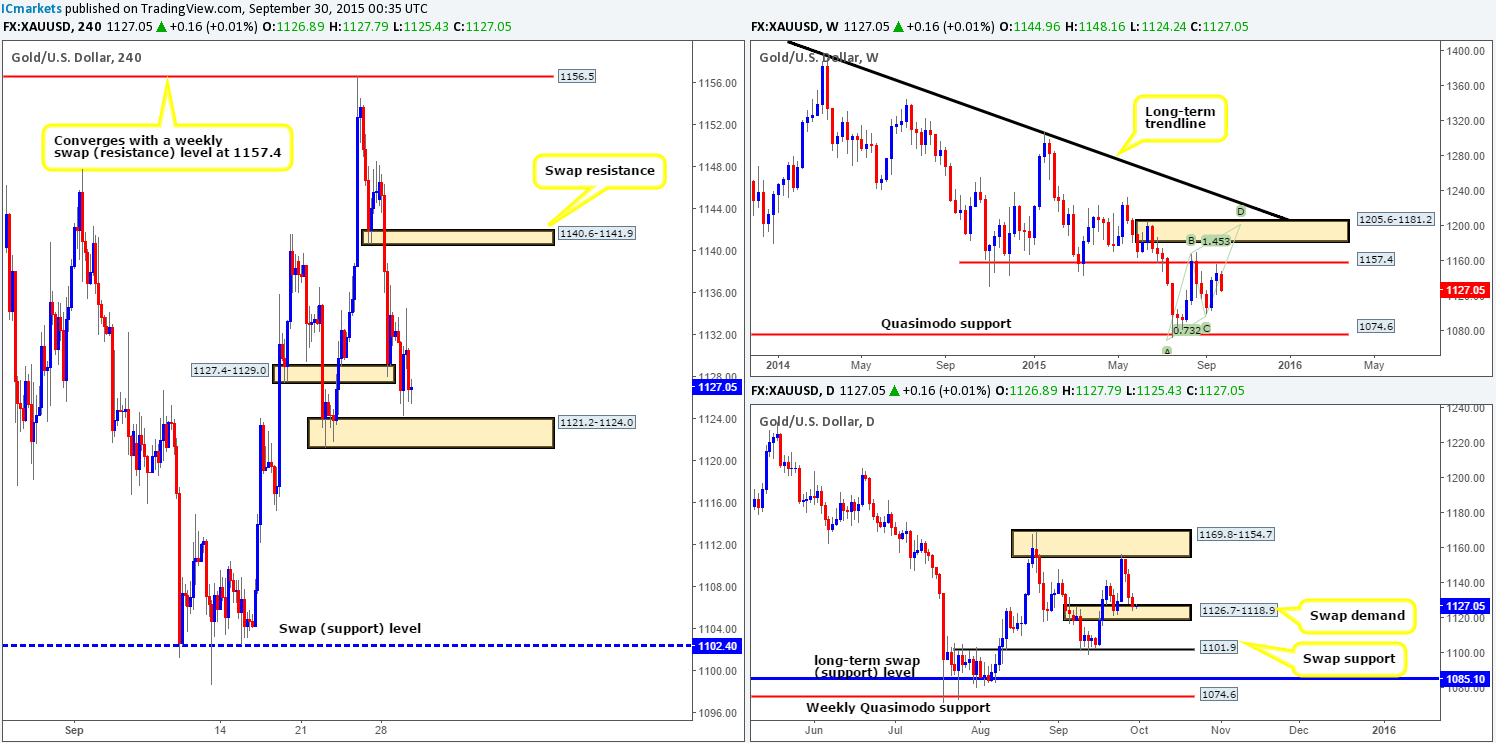
Amid yesterday’s trade, the 4hr chart shows that Gold aggressively took out the Quasimodo area at 1127.4-1129.0, and came within a few pips of colliding with demand seen at 1121.2-1124.0 before advancing north. Although this current demand sits within a daily swap (demand) zone at 1126.7-1118.9, one still has to be careful if they’re considering looking for buys if price, which it looks like it is going to, tests this zone for a second time today.
The reason for why stems from the weekly scale. Following the rebound from the swap resistance level at 1157.4, price has continued to steam lower ever since. As we’re sure you’ll agree, buying into this, even with 4hr and daily convergence, would make the majority of traders hesitant. However, this does not mean one has to completely ignore the 4hr/daily demand convergence currently being seen at the moment. On the assumption that price does indeed retest the aforementioned 4hr demand zone, and we see some form of lower timeframe buying confirmation (preferably from the 30/60 minute timeframes), we’d feel confident enough to place a buy in the market here. Targets for this trade will be dependent on the approach to our zone. Stops, at least in our opinion, are best placed below the 4hr demand area itself even if we find confirmation on the 30 minute timeframe.
Levels to watch/ live orders:
- Buys: 1121.2-1124.0 [Tentative – confirmation required] (Stop loss: dependent on where one confirms this area).
- Sells: Flat (Stop loss: N/A).


