A note on lower timeframe confirming price action…
Waiting for lower timeframe confirmation is our main tool to confirm strength within higher timeframe zones, and has really been the key to our trading success. It takes a little time to understand the subtle nuances, however, as each trade is never the same, but once you master the rhythm so to speak, you will be saved from countless unnecessary losing trades. The following is a list of what we look for:
- A break/retest of supply or demand dependent on which way you’re trading.
- A trendline break/retest.
- Buying/selling tails – essentially we look for a cluster of very obvious spikes off of lower timeframe support and resistance levels within the higher timeframe zone.
- Candlestick patterns. We tend to only stick with pin bars and engulfing bars as these have proven to be the most effective.
EUR/USD:
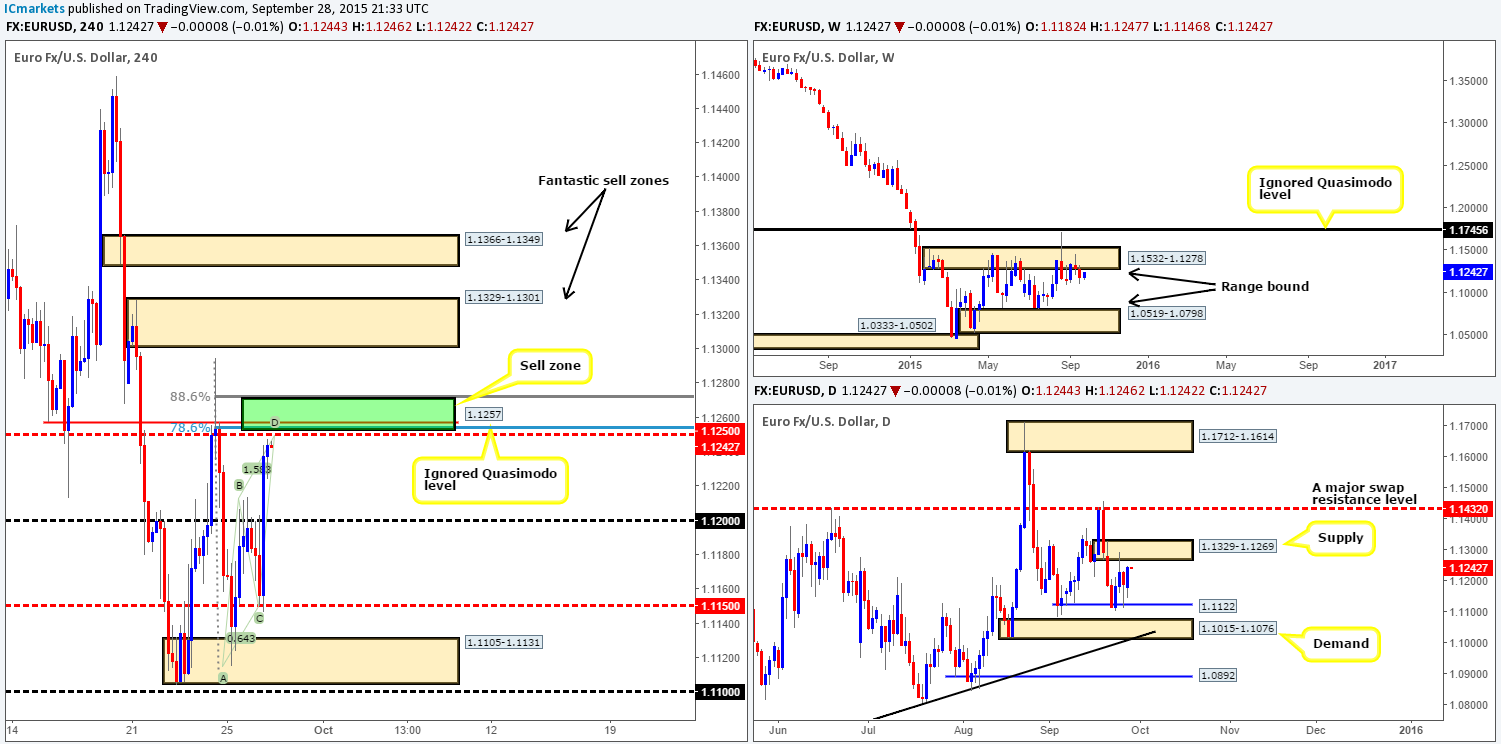
The EUR/USD market, as you can see, plunged from psychological resistance 1.1200 and crossed swords with mid-number support 1.1150 during the beginning of London trade yesterday. It was from here, the U.S. open, that we saw the EUR currency correct itself and aggressively surge close to 100 pips up to the underside of 1.1250.
In view of price now trading below not only 1.1250 but also an ignored Quasimodo resistance just above it at 1.1257, would we consider this a stable enough platform to sell from today? 100% we would! Supporting the aforementioned resistances are the following structures:
- A Harmonic AB=CD approach that completes around the 1.1250 mark.
- 78.6% Fib resistance level at 1.1254.
- One could also consider this a nearly complete Harmonic Bat pattern, hence the defining limit of our sell zone being the 88.6% Fib level at 1.1270.
- The base of a daily supply area at 1.1329-1.1269 sits on top of the above said 4hr structures.
- And, finally, we mustn’t forget that price still remains loitering around the underside of weekly supply at 1.1532-1.1278.
Taking into account the confluence seen in this market today, we’re confident a rebound will likely be seen from the 1.1250/1.1270 region. That being said though, there is always the chance the big boys may edge price into stops above the Harmonic sell zone into the jaws of the aforementioned daily supply. Therefore, we would recommend waiting for lower timeframe price action to confirm strength exists here before placing a trade – just to be on the safe side!
Levels to watch/live orders:
-
Buys: Flat (Stop loss: N/A).
-
Sells: 1.1250/1.1270 Tentative- confirmation required (Stop loss: dependent on where one confirms this area).
GBP/USD:
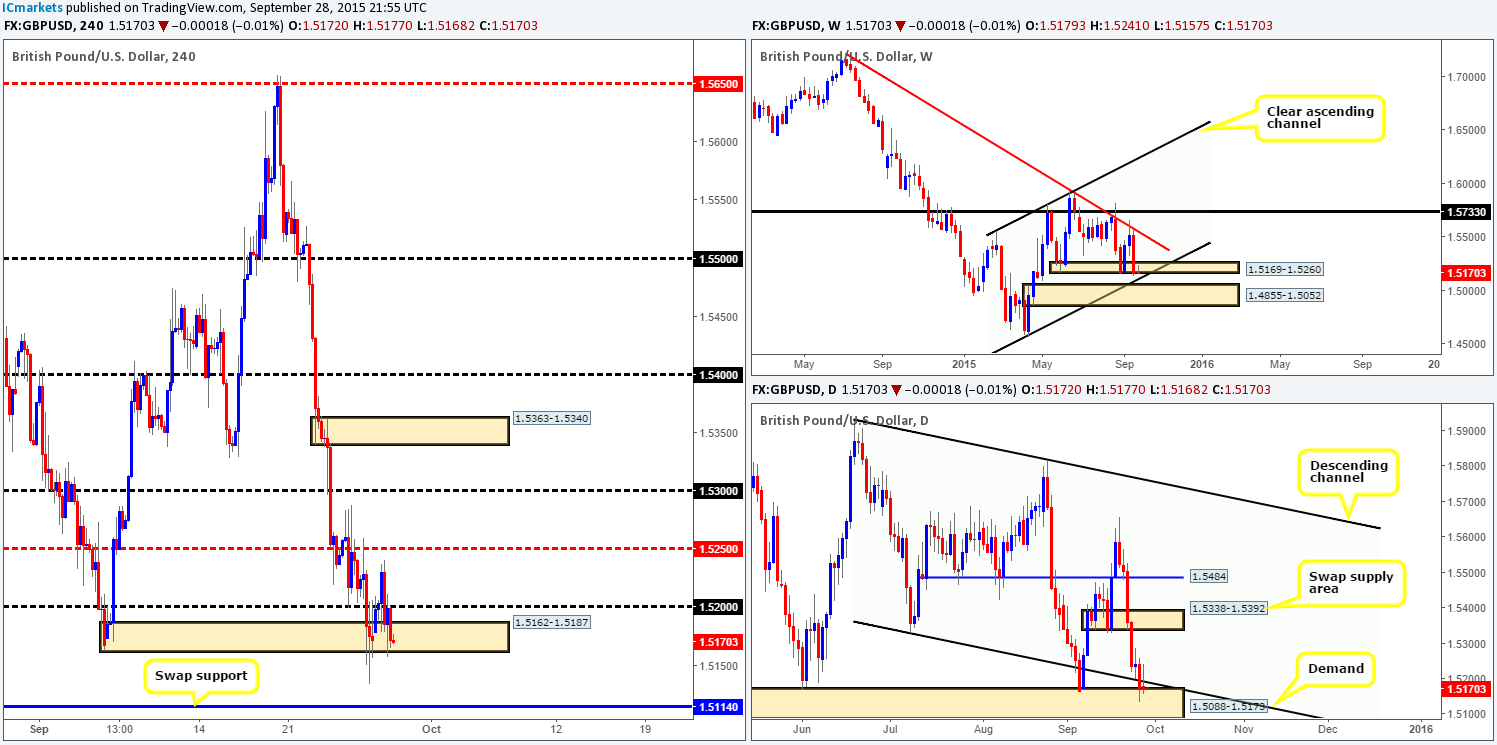
This morning’s analysis will kick-off with a look at the weekly structure, which, as you can see, shows price lurking around the lower limits of a weak-looking demand base at 1.5169-1.5260. With this, as we mentioned in yesterday’s report, we believe Cable will drill a little lower to either the near-term channel support line (1.4564) or demand taken from 1.4855-1.5052 before any noteworthy correction takes place.
Scrolling down to the daily action, an inverted pin candle formed off the back of demand yesterday at 1.5088-1.5173. Even though this area appears firm, there’s a strong possibility that this zone will be tested further this week since the aforementioned weekly channel support converges with the lower limits of this area (see above). Therefore, a reaction is highly likely from this zone, only this time it may be a little deeper than the previous two touches seen at 1.5178/1.5162 back in June and early September.
Turning our attention to the 4hr scale, price is, after a short burst of buying yesterday above psychological resistance 1.5200, back trading around the lower limits of weak-looking demand at 1.5162-1.5187 – the week’s opening price!
That being the case – taking into account the higher timeframe structures (see above), and the likelihood of price dropping lower, the 4hr swap (support) level at 1.5114 is a barrier we believe to be a perfect buy zone for (confirmed) longs. The reason being is that It merges not only with the lower limits of daily demand mentioned above at 1.5088-1.5173, but also with the aforementioned weekly channel support, thus making it a very high-probability turning point in this market.
Levels to watch/ live orders:
-
Buys: 1.5114 [Tentative – confirmation required] (Stop loss: dependent on where one confirms this level).
-
Sells: Flat (Stop loss: N/A).
AUD/USD:
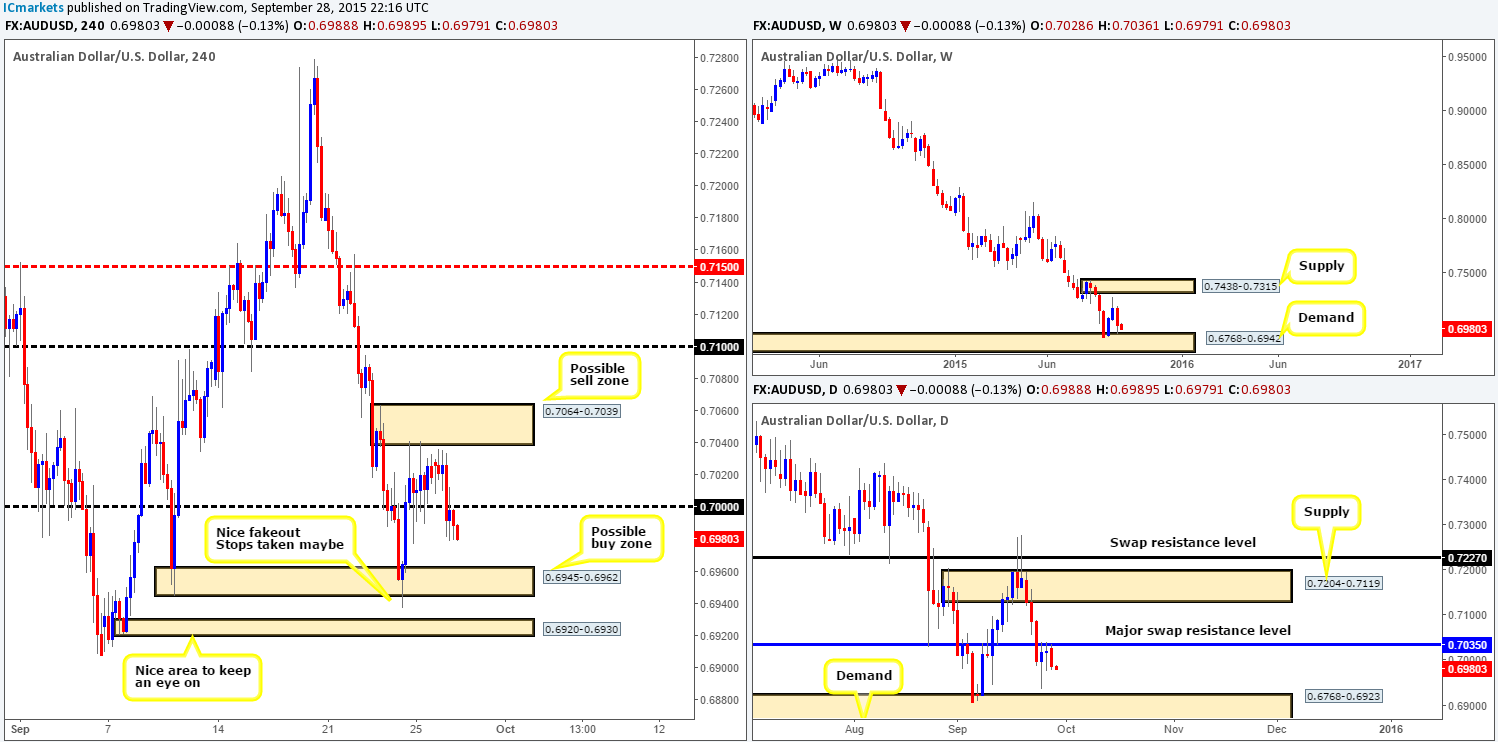
In the thick of trade yesterday, the Aussie dollar sunk lower against its U.S. counterpart, breaking below the large psychological hurdle 0.7000 and retesting it into the close 0.6988. With little in the way of support seen in this market until demand at 0.6945-0.6962, followed closely by a smaller demand drawn from 0.6920-0.6930, we see the Aussie continuing lower during Asia today.
Now, one could possibly find a buy trade around the above said upper demand zone today, since it sits directly on top of weekly demand at 0.6768-0.6942. However, the smaller aforementioned demand below appears the more attractive of the two since this area not only converges with weekly demand, but also has the added advantage of lining up with daily demand at 0.6768-0.6923 as well. Therefore, do keep an eye on these areas today for possible (confirmed) longs.
Although the above 4hr zones boast demand from the higher timeframes, one still needs to tread carefully here, hence the need for lower timeframe confirmation! Reason being is that the Aussie remains in a humongous downtrend at present, and also the fact that the major daily swap (resistance) level at 0.7035 appears to be holding very strong at this time.
Levels to watch/ live orders:
-
Buys: 0.6945-0.6962 [Tentative – confirmation required] (Stop loss: dependent on where one confirms this area) 0.6920-0.6930 [Tentative – confirmation required] (Stop loss: dependent on where one confirms this area).
-
Sells: Flat (Stop loss: N/A).
USD/JPY:
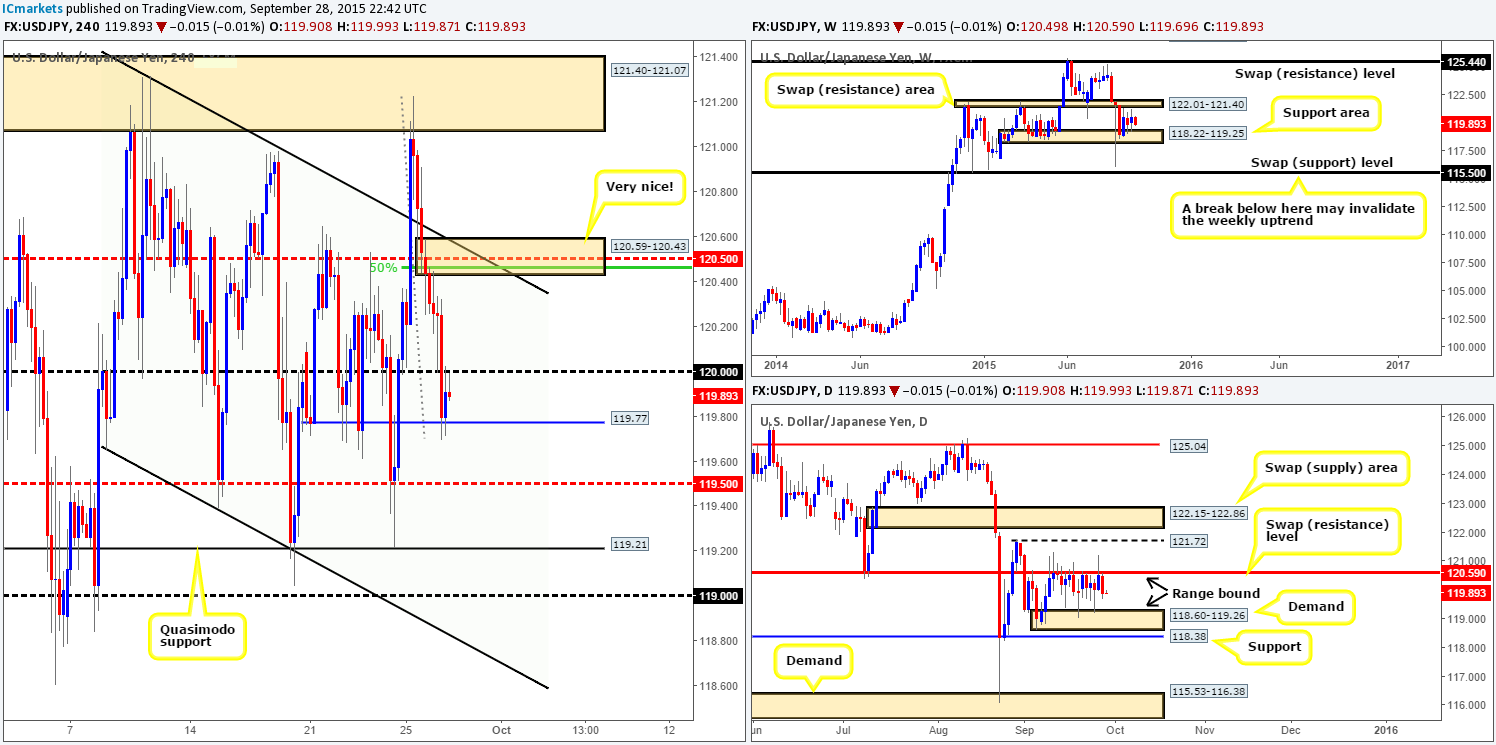
Upon opening the USD/JPY 4hr chart this morning, we were greeted with a sea of red candles with price only really stabilizing once the market hit 119.77 during the American afternoon session.
Should this pair remain well-bid from 119.77 going into today’s sessions, we’ll be eyeing the mid-level barrier 120.50 for confirmed shorts. However, before price reaches this number, offers at psychological resistance 120.00 will need to be consumed! The reasons for favoring 120.50 are due to the following converging structures:
- 50.0% Fib resistance at 120.46.
- Supply coming in at 120.59-120.43.
- Channel resistance (121.31).
- Daily swap (resistance) at 120.59.
The above, at least in our book, is enough to consider this a worthy sell zone. Nevertheless, what if price does not make it there today and continues to sell-off from 120.00? This is highly possible as we’re dealing with daily sellers here from the underside of the aforementioned daily swap (resistance) level! A break below 119.77 would likely force this pair down to 119.50, followed closely by Quasimodo support at 119.21. It is this Quasimodo level that we’d be interested in buying from, not 119.50, due to this hurdle coinciding nicely with daily demand coming in at 118.60-119.26.
Levels to watch/ live orders:
-
Buys: 119.21 [Tentative – confirmation required] (Stop loss: dependent on where one confirms this level).
-
Sells: 120.59-120.43 [Tentative – confirmation required] (Stop loss: 120.61).
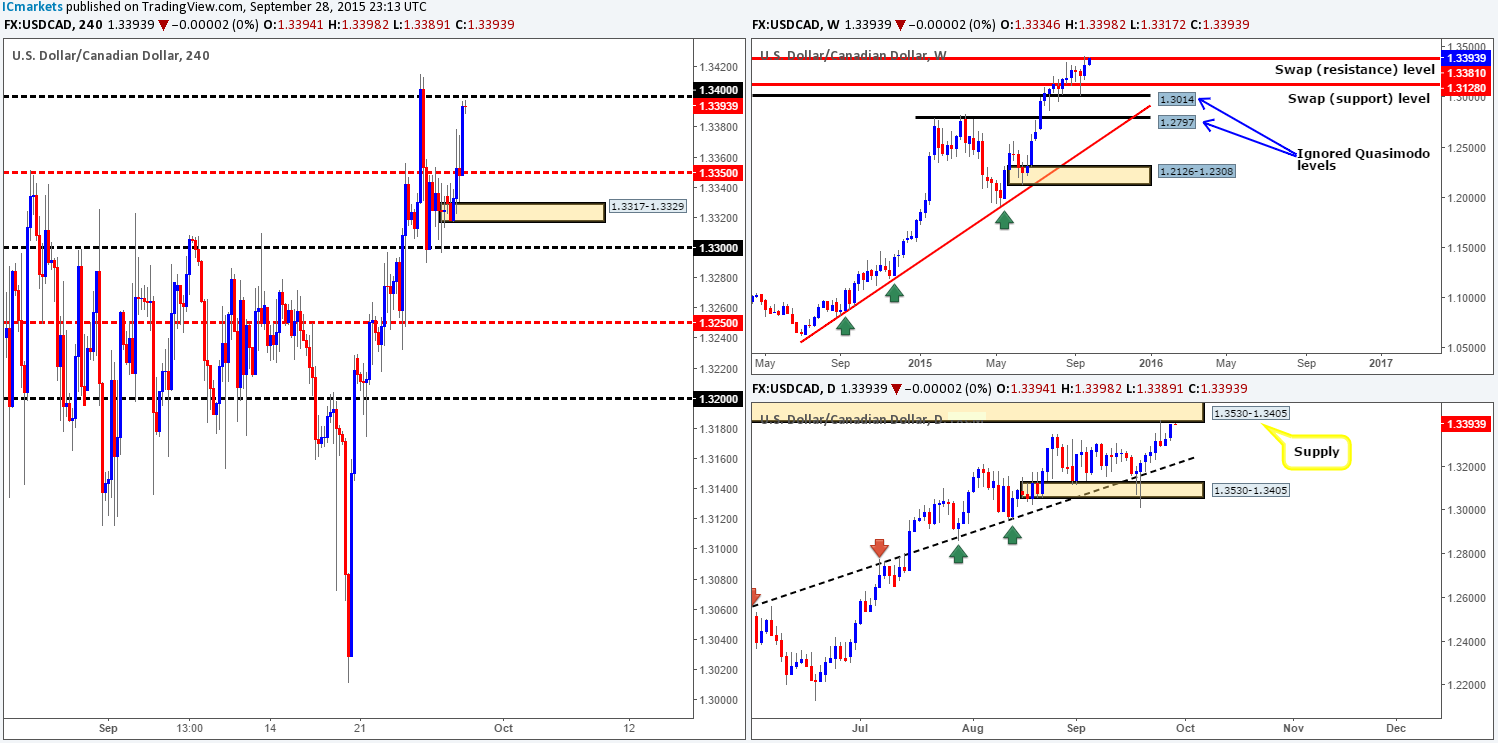
USD/CAD:
Despite this market trading from both a weekly swap (resistance) level at 1.3381 and the underside of daily supply at 1.3530-1.3405, the USD/CAD appreciated in value during trade yesterday. This, as can be seen on the 4hr chart, eventually brought this market up to within touching distance of psychological resistance 1.3400.
Given the above, the big question for us today is: will 1.3400 hold as resistance? We believe it has every chance of being respected. Just look to the left of price, last Thursday’s reaction from this level was absolutely beautiful! Furthermore, let’s not discount the potential of our higher timeframe resistances just yet because of one day’s buying! Therefore, should lower timeframe sellers show strength around 1.3400 today, we’ll jump in short from here, targeting 1.3350 first and foremost.
On the flip side, what if 1.3400 does indeed see a break and holds as support today? Well, then it becomes tricky. Here’s why, on the one hand, we have support on the 4hr timeframe backed by the overall trend on this pair. And, on the other, we’re surrounded by higher timeframe resistances (see above). It would be very difficult to even guess, but we’d likely go with a continuation move north should 1.3400 hold as support as the trend on this pair is incredibly strong at present.
Levels to watch/ live orders:
-
Buys: Flat (Stop loss: N/A).
-
Sells: 1.3400 [Tentative – confirmation required] (Stop loss: dependent on where one confirms this level).
USD/CHF:
During the course of yesterday’s sessions, we can see that there were a few hesitant candles printed around the 0.9800 psychological resistance during the London morning session. It was only once we entered into the early hours of the American session did we see price move. The market heavily sold off in one fell swoop, closing below mid-number support 0.9750 in the process.
As can be seen from the 4hr chart, candle action has already retested 0.9750 as resistance, but it looks as though it will be retested again shortly. Now, considering that price has recently connected with a weekly swap (resistance) level at 0.9796 that shows room to continue lower on both the weekly and daily timeframes, we believe 0.9750 is worthy of our attention. On the assumption that we see some form of lower timeframe selling strength around this number today, we’d feel confident enough to place a sell order in the market. From here, we’d look to target psychological support 0.9700, followed closely by demand coming in at 0.9641-0.9666, positioned just below a daily swap (support) level drawn from 0.9689.

Levels to watch/ live orders:
-
Buys: Flat (Stop loss: N/A).
-
Sells: 0.9750 [Tentative – confirmation required] (Stop loss: dependent on where one confirms this level).
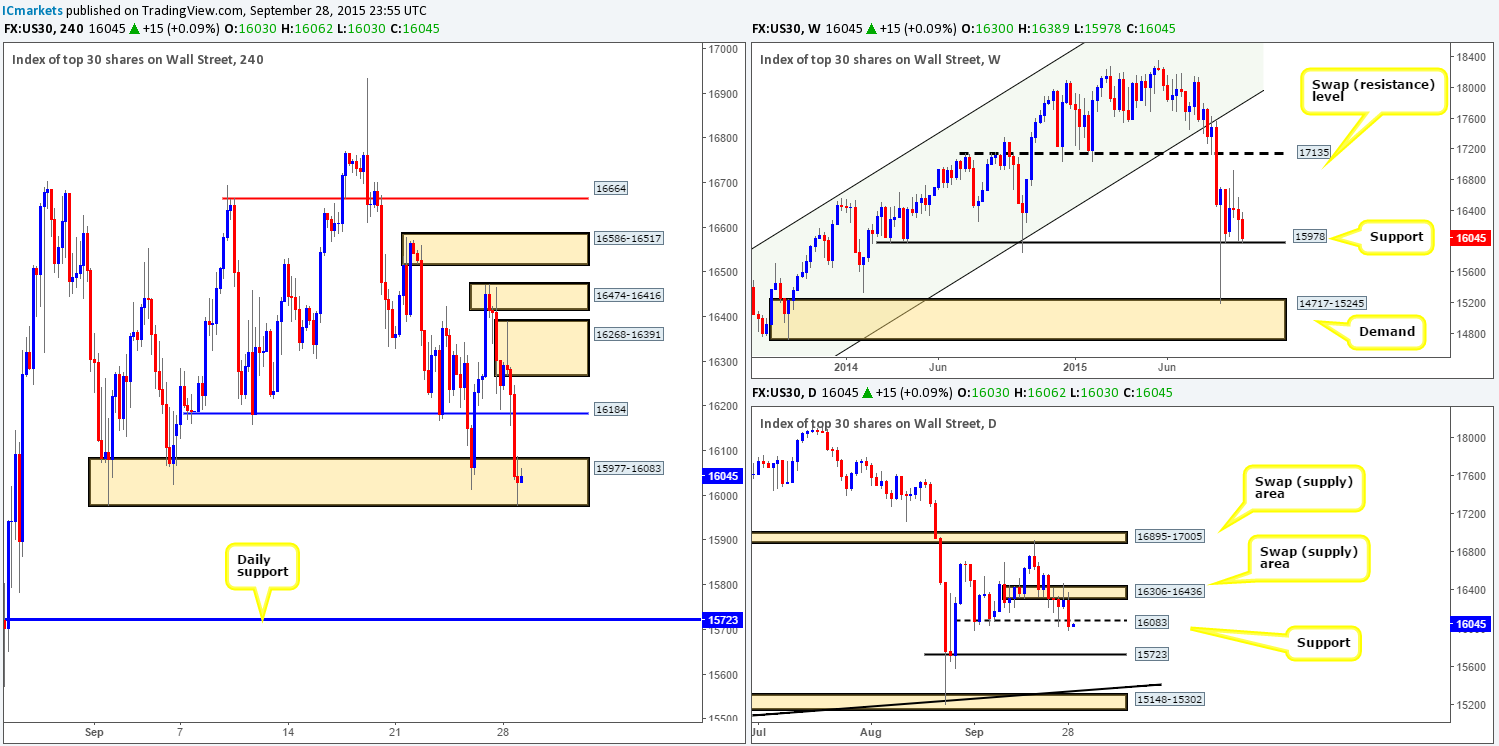
DOW 30:
Coming at you directly from the pits of the weekly timeframe this morning, it’s clear to see that price is now flirting with support seen at 15978. Looking down to the daily timeframe, however, support at 16083 was taken out during yesterday’s session. Assuming that this number holds as resistance, further downside could be seen towards support taken from 15723.
4hr action shows that buyers attempted to push this market north during early trade yesterday, but failed reaching highs of 16389. From here, price plummeted lower, barely seeing any reaction around support at 16184, and driving extremely deep into demand seen at 15977-16083.
Given that weekly support at 15978 remains intact, there could still be a potential trade from deep within the aforementioned 4hr demand zone today. However, since daily support at 16083 has been breached, waiting for lower timeframe confirmation before buying this index here is highly recommended! Should we manage to spot a long entry within the 4hr demand area today; we’ll be eyeing 16184 as our immediate take-profit target, followed closely by supply at 16268-16391.
Levels to watch/ live orders:
-
Buys: 15977-16083 [Tentative – confirmation required] (Stop loss: 15955).
-
Sells: Flat (Stop loss: N/A).
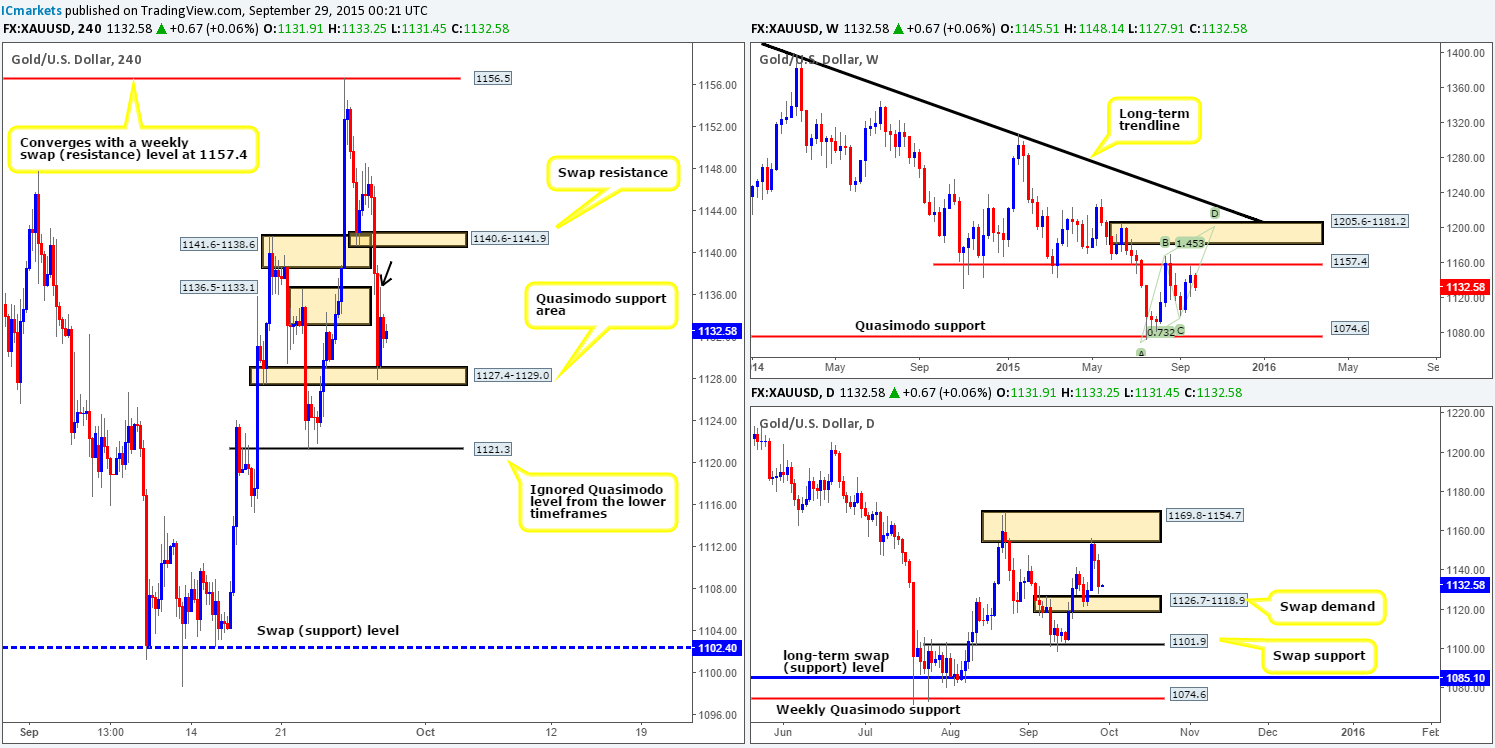
XAU/USD: (Gold)
Using a top-down approach this morning, the weekly timeframe shows that the rebound from the swap resistance level at 1157.4 has so far continued to extend lower. Scaling down to the daily timeframe, we can see that price has sold off beautifully from supply seen at 1169.8-1154.7, consequently bringing this market down to within shouting distance of connecting with a swap demand area given at 1126.7-1118.9.
Moving down one lower to the 4hr timeframe reveals that yesterday’s sell-off consumed two very obvious swap demand areas (1141.6-1138.6/ 1136.5-1133.1), and, as a result, touched gloves with a Quasimodo support area at 1127.4-1129.0.
In view of this market already responding well to this Quasimodo base, and the fact that price is just inches away from the aforementioned daily swap (demand) area, would we consider this platform stable enough for buys today? In short, yes we would. Other than the above reasons, we also like the current candle action around this area. Granted we have effectively missed the first boat from here, but this could be a good thing since we believe the wick/spike seen marked with a black arrow at 1136.7 has consumed the majority of unfilled offers from the break of the recent swap demand zone at 1136.5-1133.1. Therefore, should Gold retest this zone today and produce some sort of lower timeframe buying confirmation, we’d jump in long targeting the swap resistance area at 1140.6-1141.9.
The reason behind requiring confirmation here simply comes from seeing the weekly timeframe selling off from 1157.4. To enter long blindly into this potential opposition is NOT something we’d be comfortable with!
Levels to watch/ live orders:
-
Buys: 1127.4-1129.0 [Tentative – confirmation required] (Stop loss: dependent on where one confirms this area).
-
Sells: Flat (Stop loss: N/A).


