
Key risk events today:
Australia GDP q/q; US ADP Non-Farm Employment Change; BoE Gov Bailey Speaks; MPC Member Broadbent Speaks; Crude Oil Inventories.
(Previous analysis as well as outside sources – italics).
EUR/USD:
For those who read Tuesday’s technical briefing you may recall the following (italics):
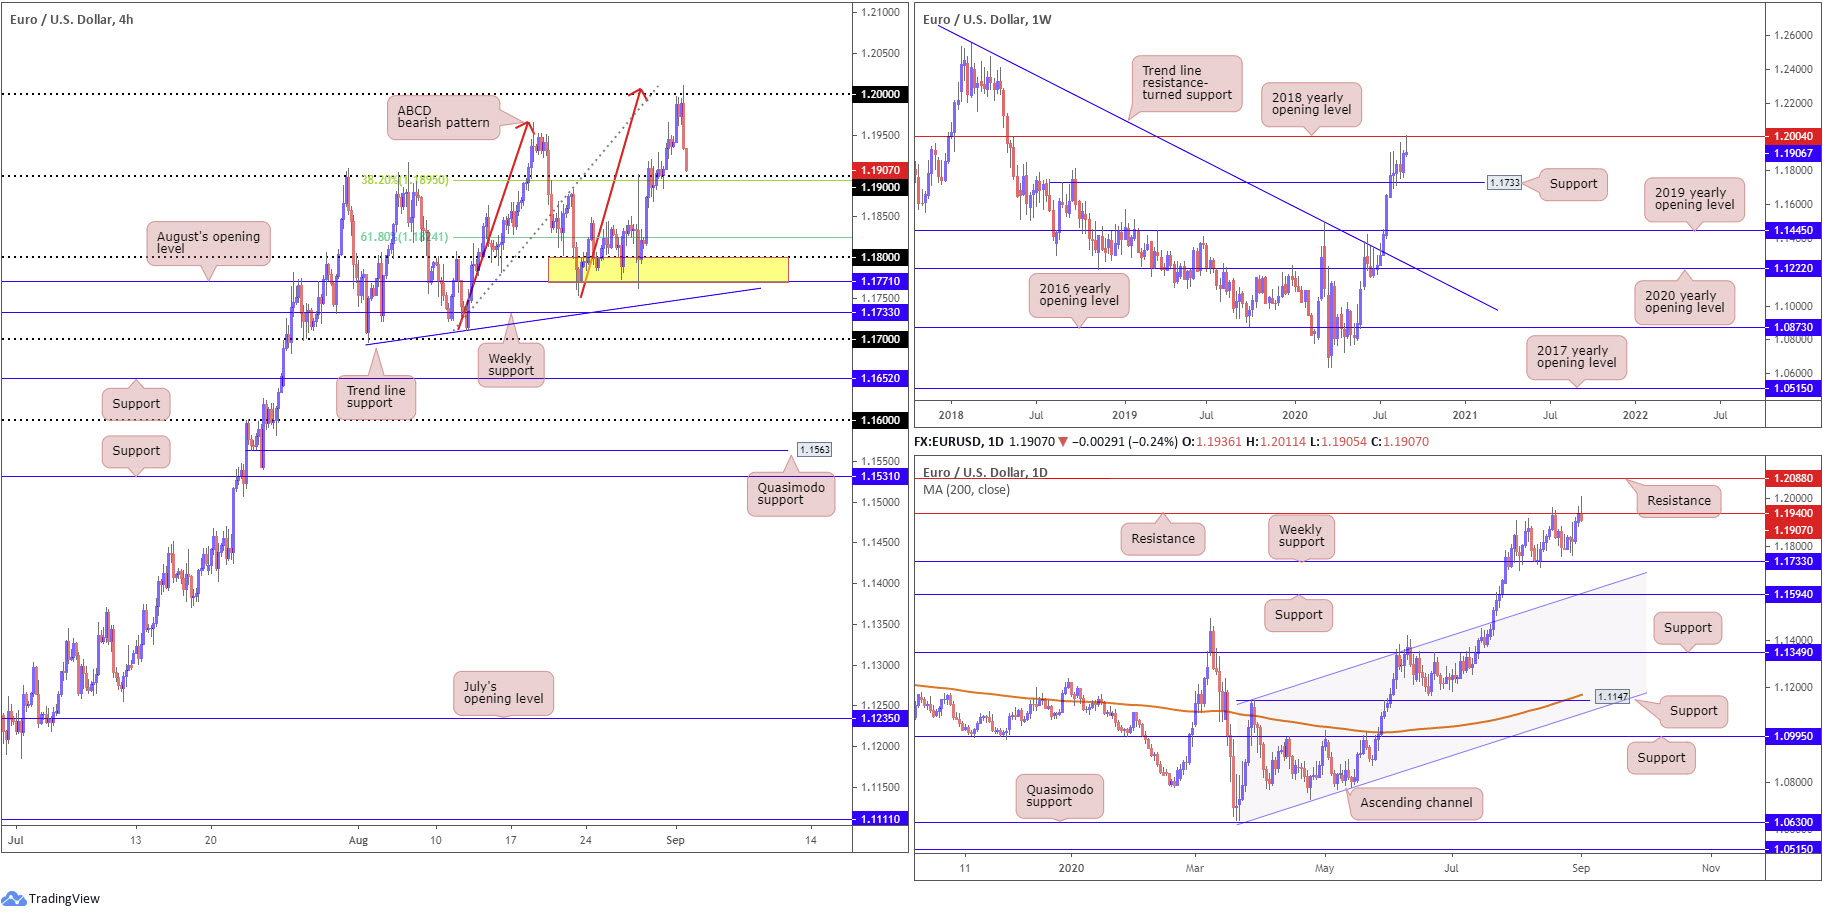
1.20 is likely a watched figure going forward, not only as a take-profit target for bullish themes from 1.19 (and any intraday breakout signals taken above 1.1965), but also as a potential reversal zone given the H4 ABCD confluence and weekly resistance at 1.2004 (2018 yearly opening level).
Tuesday, as evident from the H4 chart, had the pair shake hands with the 1.20 neighbourhood, spiking to highs at 1.2011, fresh year-to-date peaks. The reaction, as you can see, sparked a sell-off, aided by an upbeat US ISM Manufacturing PMI print, consequently drawing H4 candles to within touching distance of 1.19.
The 1.19 handle, coupled with a 38.2% Fibonacci retracement ratio at 1.1895, could hamper downside. Not only are psychological figures widely watched levels, the 38.2% Fibonacci level, in this case, represents a common take-profit target out of ABCD patterns (with the 61.8% Fib at 1.1824 often set as the next take-profit).
Areas of consideration:
Sellers short 1.20 will likely reduce risk to breakeven around 1.19 and bank partial profits. The higher timeframes, both the weekly and daily chart show price trading from resistance (1.2004/1.1940), suggest we could pursue additional downside beyond 1.19, with room on the bigger picture to decline as far south as 1.1733 support, a prior Quasimodo resistance level on the weekly timeframe.
Therefore, a H4 close under 1.19 could prompt additional bearish scenarios today, targeting the 61.8% Fibonacci retracement ratio at 1.1824.
GBP/USD:
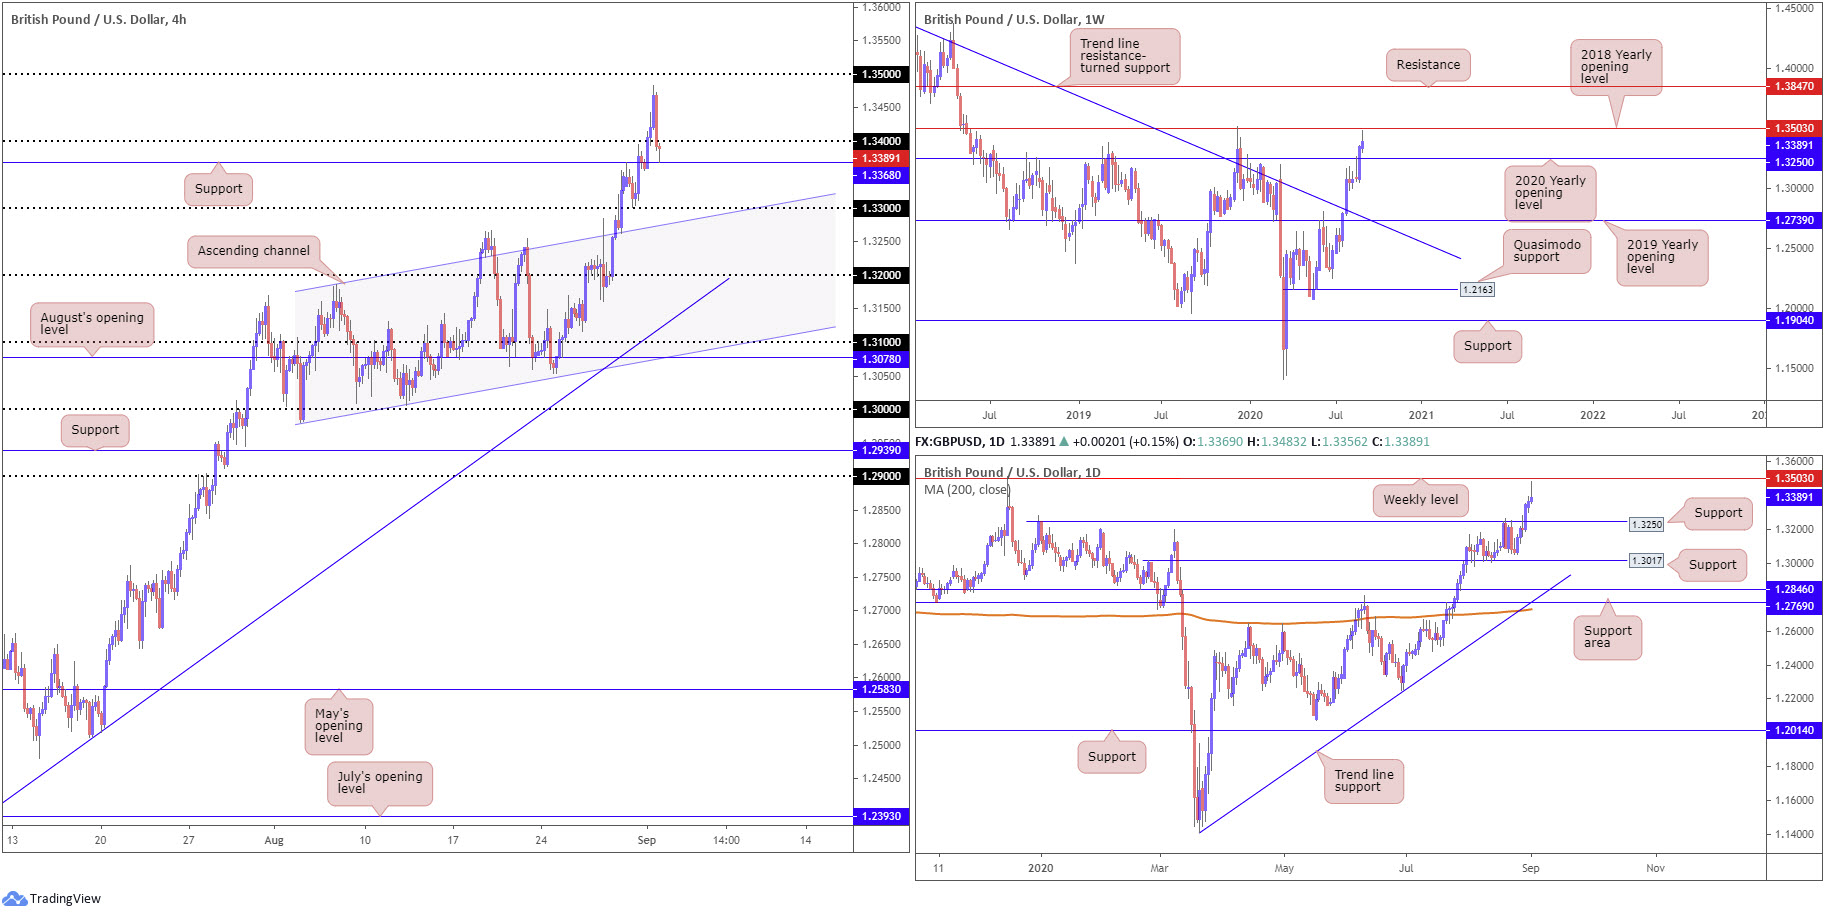
Sterling extended to a fresh year-to-date peak at 1.3483 against the buck Tuesday, though sharply retreated going into US hours as the DXY recovered off worst levels to modestly positive territory.
Leaving 1.35 unchallenged, shadowed by weekly resistance at 1.3503 (the 2018 yearly opening level), H4 burrowed through 1.34 to cross swords with support at 1.3368 yesterday. With the higher timeframe picture indicating we’re absent of support until reaching 1.3250, the 2020 yearly opening level, this leaves a question mark on H4 support mentioned above at 1.3368. A break of this level could shine the spotlight on the 1.33 handle, closely followed by channel resistance-turned support (1.3185).
Areas of consideration:
A H4 close south of H4 support at 1.3368 today reveals higher timeframe sellers may be targeting 1.3250 support, seen on both the weekly and daily chart. As a result, a H4 close under 1.3368 could serve as a bearish cue towards at least the 1.33 psychological level.
Alternatively, a H4 close back above 1.34, implies bulls may have higher levels in mind, perhaps 1.35, which, as already mentioned, converges with weekly resistance at 1.3503 (2018 yearly opening level).
AUD/USD:
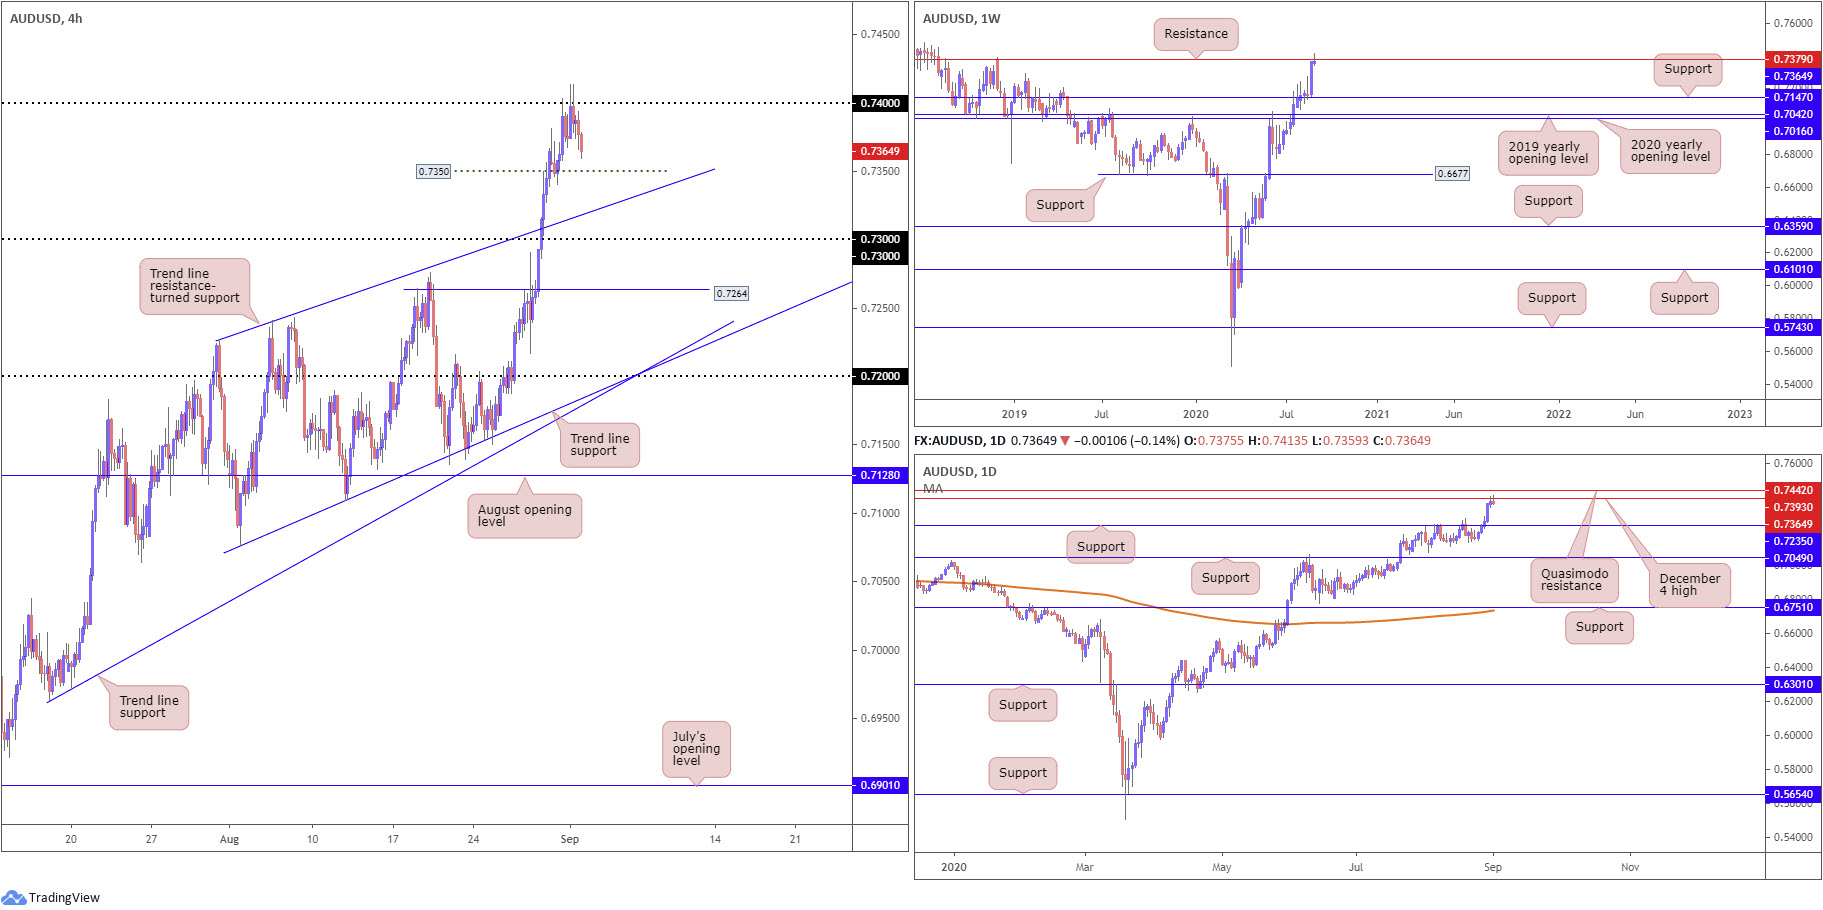
Following two back-to-back whipsaws above 0.74 on the H4, AUD/USD fell into negative territory during US hours on Tuesday, positioning 0.7350 back in the firing range as viable support today. A break to deeper waters, on the other hand, could throw a trend line resistance-turned support, taken from the high 0.7227, in the pot, followed by the 0.73 handle.
Further afield, longer-term activity is seen getting to know resistance at 0.7379 on the weekly timeframe, with price currently representing a shooting star candlestick configuration. By the same token, daily movement is kissing the underside of the 0.7393 December 4 high, on course to snap a five-day bullish phase. With reference to prospective support, the daily timeframe presents structure at 0.7235, a prior Quasimodo resistance level. It might also interest some traders to note the trend in this market has faced a northerly trajectory since bottoming mid-March.
Areas of consideration:
The fact we’re fading higher timeframe resistances right now, 0.7350 on the H4 timeframe is likely to make an appearance today. Whether this barrier holds, however, is difficult to judge since the bigger picture suggests moves as far south as 0.7235 could come to fruition before buyers look to re-join the current trend. Therefore, bullish themes could appear off the noted H4 trendline support, the 0.73 handle of even H4 support at 0.7264.
Conservative buyers, therefore, will likely be watching for buying pressure to form off the aforementioned supports today, likely in the form of candlestick signals, such as hammer and engulfing patterns.
USD/JPY:
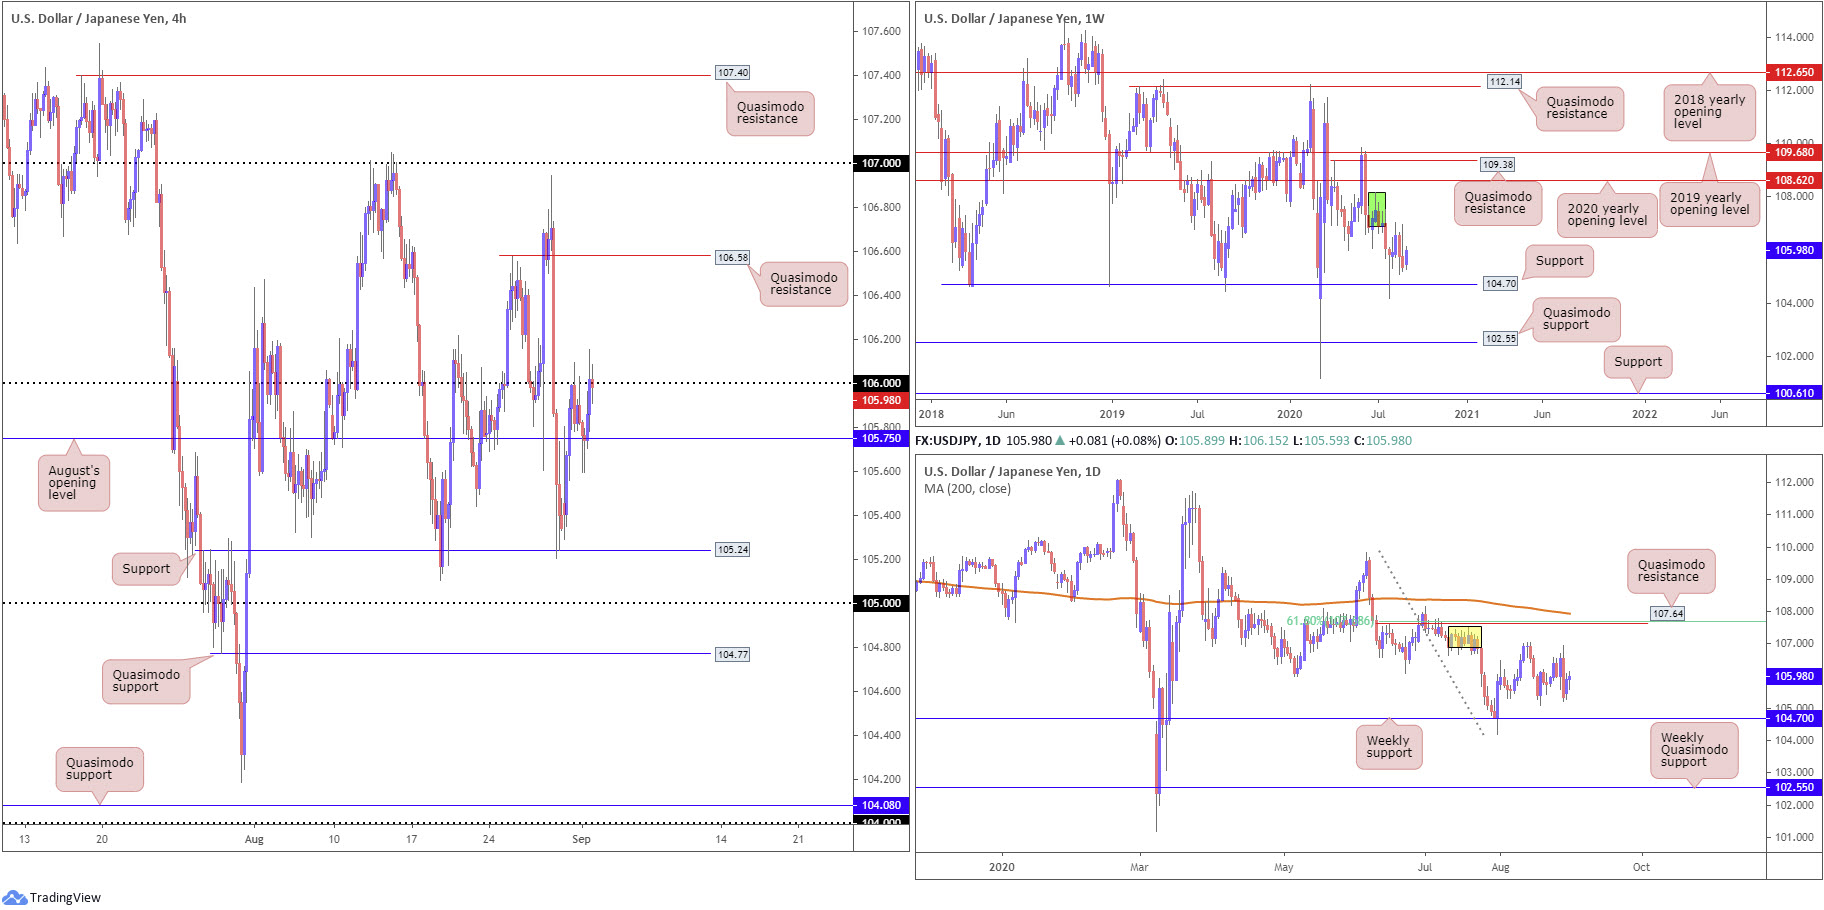
Despite an earnest attempt to move through August’s opening level at 105.75 on the H4, sellers found thin air around the 105.60ish region on Tuesday. This, alongside a DXY recovery off YTD lows at 91.75, lifted H4 candles back to the 106 level, jabbing to session peaks at 106.15. As underlined in Tuesday’s piece, traders are likely to show interest in bullish scenarios today in the event a H4 close above 106 takes form, targeting Quasimodo resistance at 106.58.
Although H4 is threatening moves back above 106, we can see supply remains prominent on the weekly timeframe at 108.16-106.88 (dark green) after price made its way off support at 104.70 at the end of July. Last week’s movement ended in the form of a strong selling wick, positioning the aforementioned support back in the fold. Should buyers hold onto recent upside, the 2020 yearly opening level at 108.62 may eventually enter view, closely followed by Quasimodo resistance at 109.38.
From the daily timeframe, supply at 107.55/106.89 (yellow), an area housed within the lower boundary of weekly supply mentioned above at 108.16-106.88, is also proving a tough nut to crack, with further downside to also potentially target the weekly support underlined above at 104.70. In the event buyers make a comeback, Quasimodo resistance at 107.64 might enter play, reinforced by a 61.8% Fibonacci retracement ratio at 107.68 and the 200-day SMA (orange – 107.93).
Areas of consideration:
August’s opening level holding firm on the H4 timeframe at 105.75, with price recently attacking 106, signals a potential continuation higher today, to take aim at 106.58. Conservative traders may wait and see if a 106 retest occurs before taking action; more aggressive traders, however, may opt to enter the breakout candle’s close.
USD/CAD:
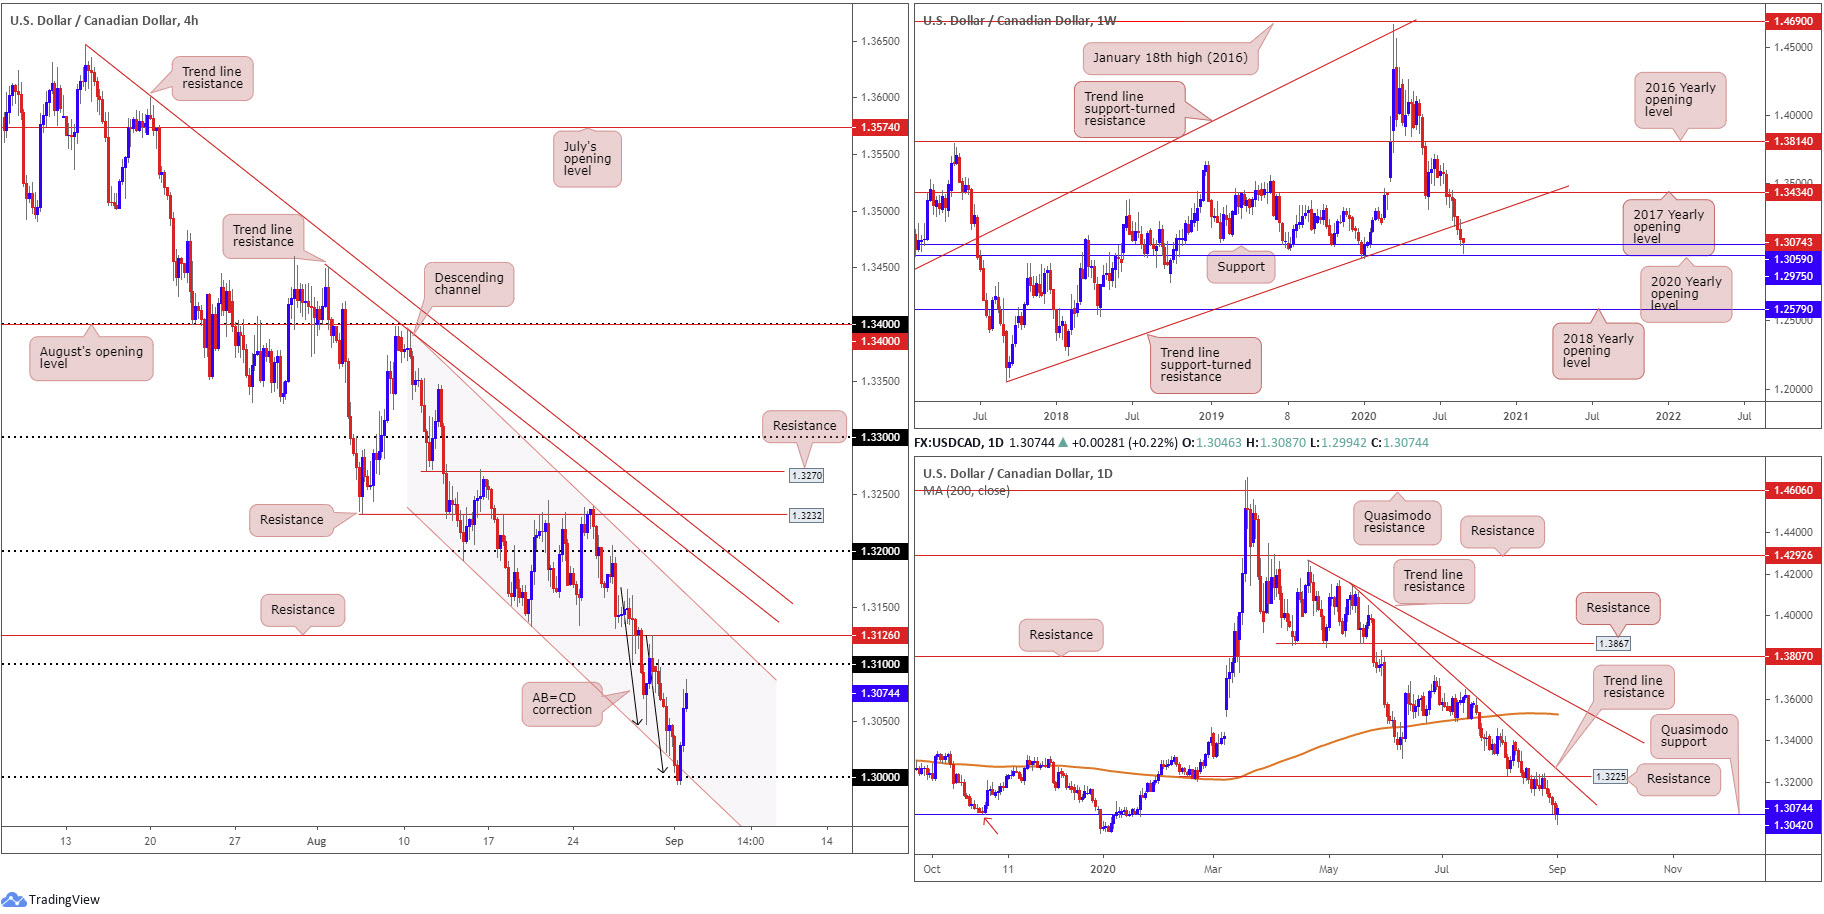
USD/CAD, elevated on the back of a DXY rebound and WTI settling off best levels, staged a decisive recovery on Tuesday after nudging marginally under the 1.30 key figure on the H4 timeframe.
For those who read Tuesday’s technical briefing you may recall the following (italics):
With daily Quasimodo support in the frame (with its pattern low set at 1.2951) at 1.3042, along with H4 structure (channel support, extended from the low 1.3133, an AB=CD correction [black arrows] at 1.3004 and the key figure 1.30), and weekly support seen at 1.2975 (the 2020 yearly opening level), this sends across a potential reversal zone between 1.2975/1.3042. While a reasonably large area, it is likely most countertrend traders will be targeting 1.30. However, ensure to have protective stop-loss orders suitably placed as a whipsaw through 1.30 into weekly support at 1.2975 is a possible scenario.
As evident from the H4 chart, we rebounded from 1.30 yesterday, almost to-the-pip, with price action now poised to approach the 1.31 region, sited just under H4 resistance at 1.3126.
Areas of consideration:
Those long 1.30 have likely reduced risk to breakeven, with the majority perhaps targeting the 1.31 handle as an initial take-profit zone. We could, according to the higher timeframes, move beyond 1.31 and tackle additional resistances, including H4 resistance at 1.3126 and H4 channel resistance from 1.3394. Therefore, additional bullish scenarios could be seen going forward.
USD/CHF:
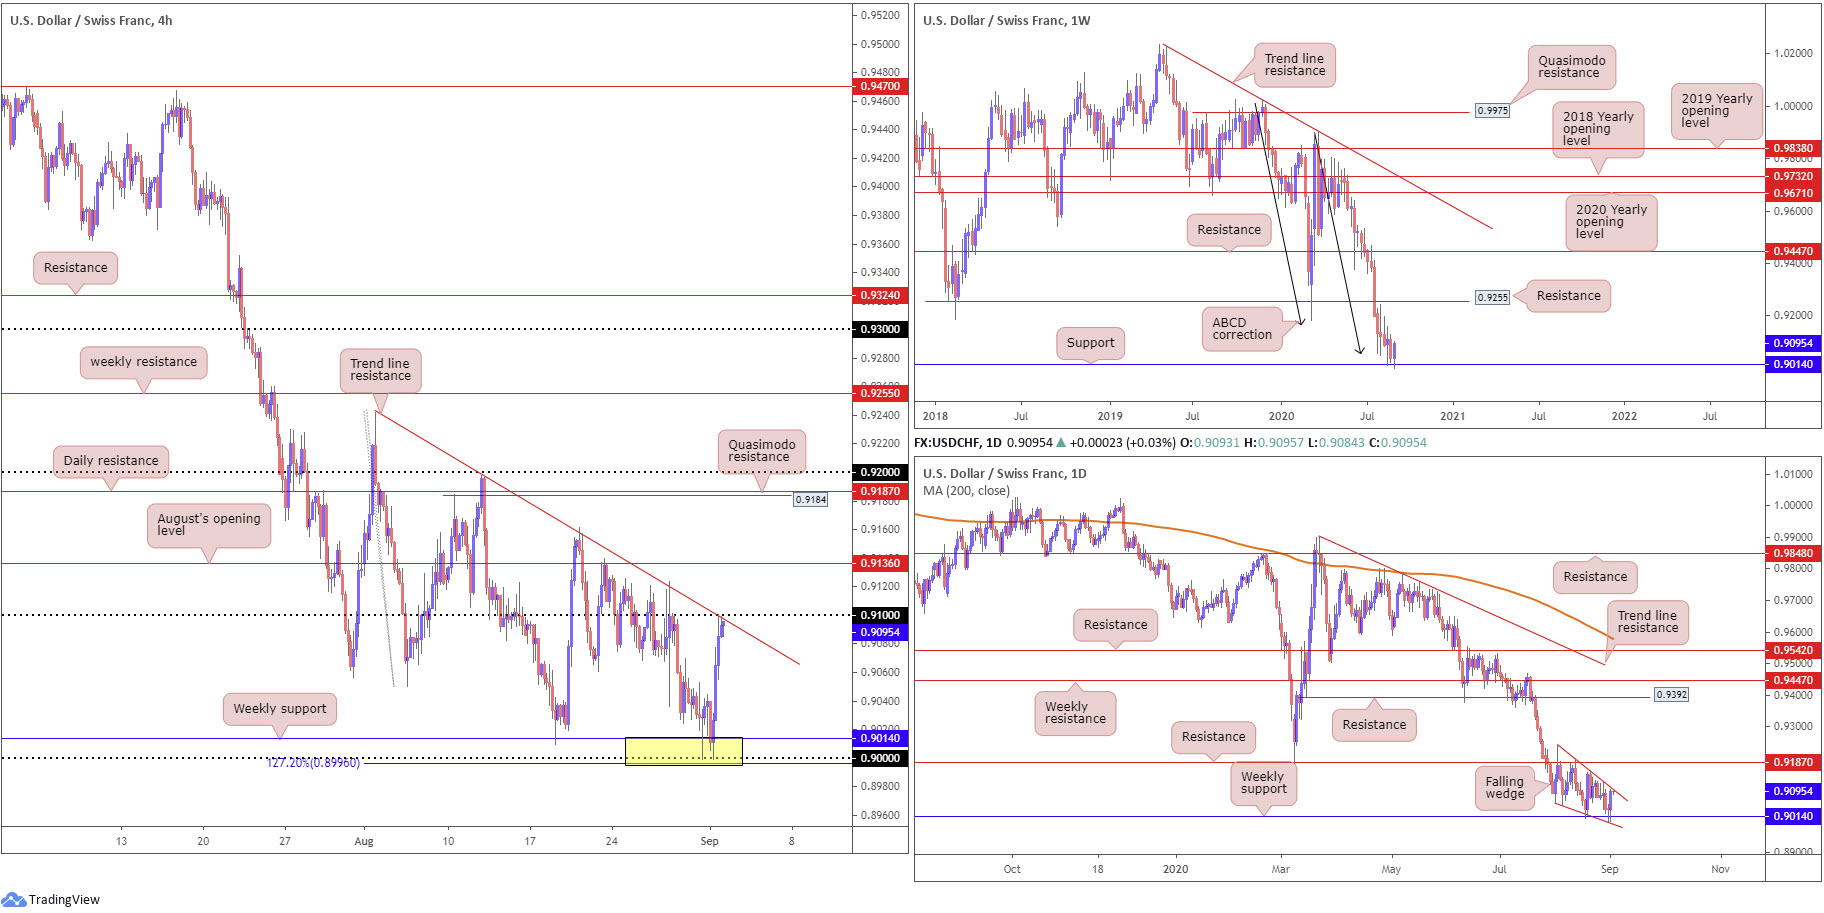
For those who read recent technical reports you may recall the charts pencilled in a bullish reversal zone between 0.8996/0.9014, made up of a weekly support at 0.9014, a H4 127.2% Fibonacci extension point at 0.8996 and the 0.90 handle.
What’s also interesting is the weekly ABCD bullish formation at 0.9051 (black arrows) and the falling wedge pattern on the daily timeframe pencilled in from the high 0.9241 and a low of 0.9056.
As evident from the H4 chart, price rebounded from 0.8996/0.9014 and formed a dragonfly doji pattern on Monday, and extended higher on Tuesday, bolstered on the back of the DXY’s recovery from YTD lows.
As you can see, recent upside has brought candle action to the upper boundary of the daily falling wedge (essentially the trend line resistance shown on the H4 chart from 0.9241), which is positioned nearby the 0.91 handle on the H4.
Areas of consideration:
Those long from 0.8996/0.9014 have likely reduced risk to breakeven and liquidated partial profits at current price.
Should we breakout above the upper boundary of the daily falling wedge (a reversal signal), daily action may look to extend recent gains to approach resistance plotted at 0.9187 (closely tied to a H4 Quasimodo resistance at 0.9184), assuming, of course, August’s opening level at 0.9136 on the H4 timeframe is taken out.
Dow Jones Industrial Average:
Tuesday’s rally in technology stocks had major US equity benchmarks finish higher across the board. The Dow Jones Industrial Average rallied 215.61 points, or 0.76%; the S&P 500 advanced 26.34 points, or 0.75% and the tech-heavy Nasdaq 100 traded higher by 182.16 points, or 1.50%.
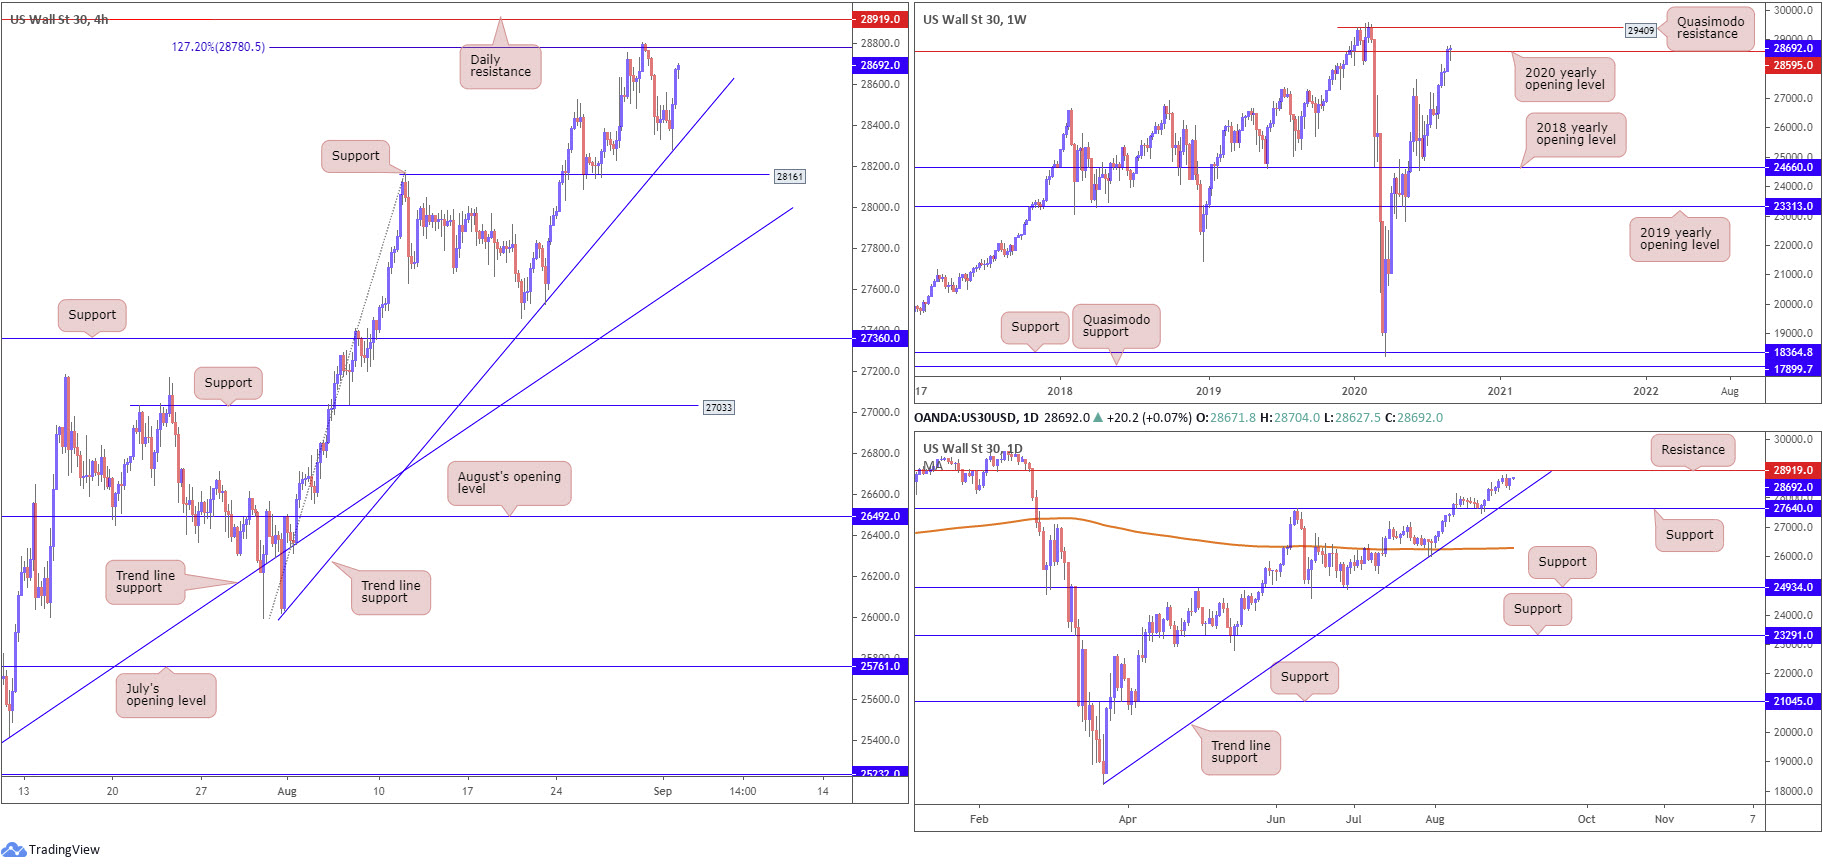
Technically, weekly price is attempting to secure position north of the 2020 yearly opening value at 28595, which could entice additional bullish sentiment towards Quasimodo resistance at 29409. Viewing price action from the H4 timeframe, the unit rebounded to-the-point off trend line support, taken from the low 26017, and is on track to revisit the 127.2% Fibonacci extension point at 28785, sited south of daily resistance at 28919.
Areas of consideration:
The H4 trend line support, taken from the low 26017, was a noted base to watch for possible bullish themes in Tuesday’s technical briefing. Buyers from here will be monitoring the 127.2% Fibonacci extension point at 28780 closely today, in addition to daily resistance plotted at 28919.
Conquering daily resistance 28919 will likely throw up another wave of buying, targeting the weekly Quasimodo resistance at 29409. Beyond here, we’re then looking forward to all-time peaks at 29595.
XAU/USD (GOLD):
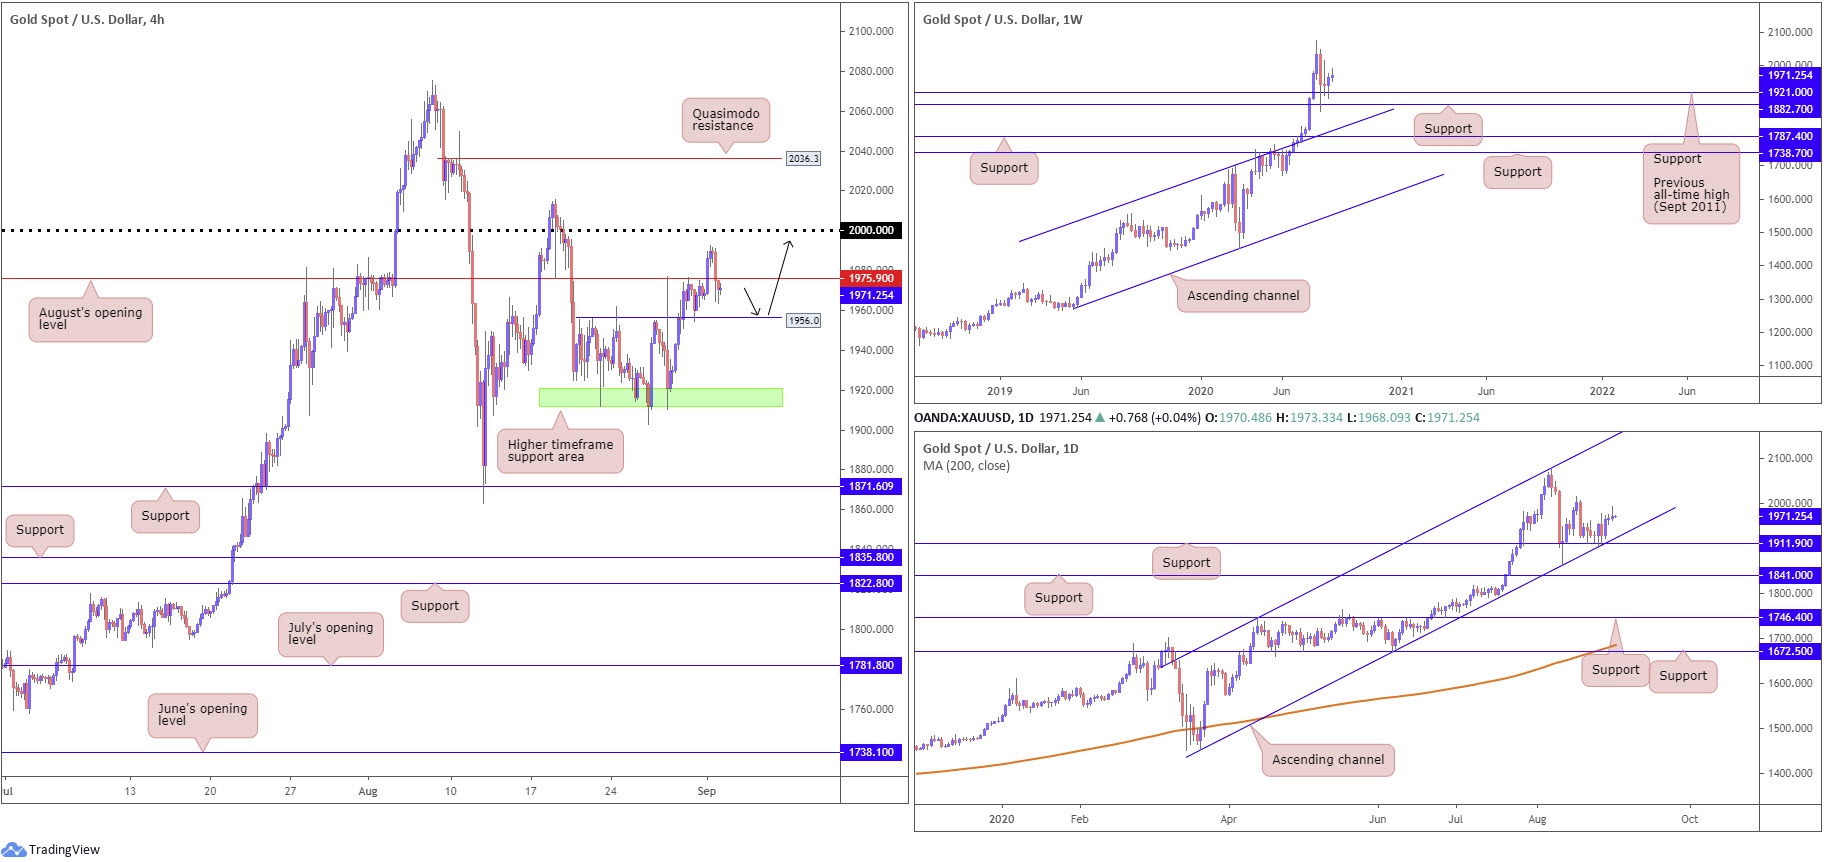
Kicking things off from the top this morning, we can see price action on the weekly timeframe remains hesitant to extend recovery gains from $1,921.00 support, the previous major all-time high (September 2011), sited ahead of another support at $1,882.70. With the current trend trekking north since 2016, the combination of $1,882.70 and $1,921.00 may still be enough to encourage additional buying, with most targeting all-time peaks at $2,075.28 as the initial point. Failure to hold gains, we could see channel resistance-turned support, etched from the high $1,703.28, enter play.
A closer reading of price movement on the daily timeframe reveals the precious metal recently rebounded from channel support, taken from the low $1,455.32, coupled with support at $1,911.90. The $2,015.72 August 18 high represents the next possible resistance area, should we continue to climb. Note yesterday’s activity finished off best levels, forming a shooting star candlestick formation.
Across the page on the H4 timeframe, the yellow metal surged above August’s opening level at $1,975.90, yet was unable to sustain gains to reach $2,000.00, consequently dropping back under $1,975.90 into the closing stages of Tuesday’s session. This refocuses attention to support at $1,956.00 today.
Areas of consideration:
The reaction from higher timeframe supports at $1,911.90-$1,921.00 (green), together with the current uptrend firmly intact, implies buyers still have a strong hand in this fight. H4 support at $1,956.00, therefore, may welcome another test today to retake August’s opening level at $1,975.90 and possibly approach $2,000.00.
The accuracy, completeness and timeliness of the information contained on this site cannot be guaranteed. IC Markets does not warranty, guarantee or make any representations, or assume any liability regarding financial results based on the use of the information in the site.
News, views, opinions, recommendations and other information obtained from sources outside of www.icmarkets.com.au, used in this site are believed to be reliable, but we cannot guarantee their accuracy or completeness. All such information is subject to change at any time without notice. IC Markets assumes no responsibility for the content of any linked site.
The fact that such links may exist does not indicate approval or endorsement of any material contained on any linked site. IC Markets is not liable for any harm caused by the transmission, through accessing the services or information on this site, of a computer virus, or other computer code or programming device that might be used to access, delete, damage, disable, disrupt or otherwise impede in any manner, the operation of the site or of any user’s software, hardware, data or property.


