
A note on lower timeframe confirming price action…
Waiting for lower timeframe confirmation is our main tool to confirm strength within higher timeframe zones, andhas really been the key to our trading success. It takes a little time to understand the subtle nuances, however, as each trade is never the same, but once you master the rhythm so to speak, you will be saved from countless unnecessary losing trades. The following is a list of what we look for:
- A break/retest of supply or demand dependent on which way you’re trading.
- A trendline break/retest.
- Buying/selling tails – essentially we look for a cluster of very obvious spikes off of lower timeframe support and resistance levels within the higher timeframe zone.
- Candlestick patterns. We tend to only stick with pin bars and engulfing bars as these have proven to be the most effective.
For us, lower timeframe confirmation starts on the M15 and finishes up on the H1, since most of our higher timeframe areas begin with the H4.
EUR/USD:
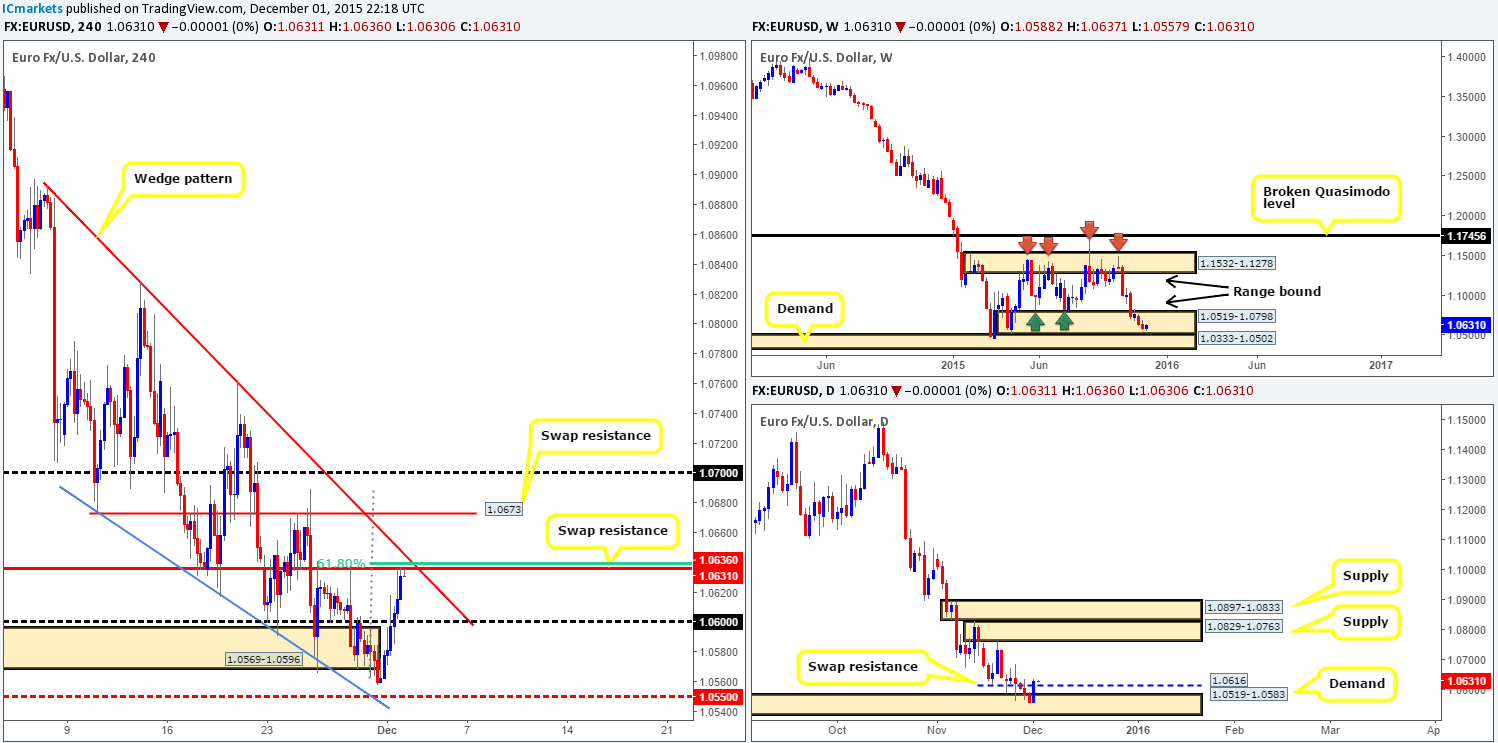
Following the clear break of demand at 1.0569-1.0596, the single currency catapulted itself north yesterday aided by weaker than expected U.S. manufacturing data. As can be seen from the H4 chart, price reached highs of 1.0637 consequently forcing the EUR to shake hands with a swap resistance barrier coming in at 1.0636. Not only does this level converge with the widely respected 61.8% Fibonacci level at 1.0639, it also trades adjacent to trendline resistance extended from the high 1.0893 (upper limit of current wedge pattern). With the confluence this level boasts, and also the clear downtrend this pair is in right now, selling from this level is very tempting. However, caution is still advised, due to weekly action lurking deep within a range demand zone seen at 1.0519-1.0798, and movement on the daily timeframe recently closing above swap resistance drawn from 1.0616.
Does this mean we should ignore selling from the H4 swap (resistance) level today? Not necessarily. We feel this level is worthy of consideration if only for a small (preferably confirmed with lower timeframe price action) intraday short, targeting psychological support 1.0600. In the event of a break above this current barrier, however, we’ll then be watching for a confirmed retest here to trade long (in-line with higher timeframe structures – see above) up to at least the swap resistance 1.0673, followed closely by psychological resistance 1.0700.
Levels to watch/live orders:
- Buys:Watch for offers to be consumed around 1.0636 and then look to trade any retest seen at this level (confirmation required).
- Sells: 1.0636 [Tentative – confirmation required] (Stop loss: dependent on where one confirms this level).
GBP/USD:
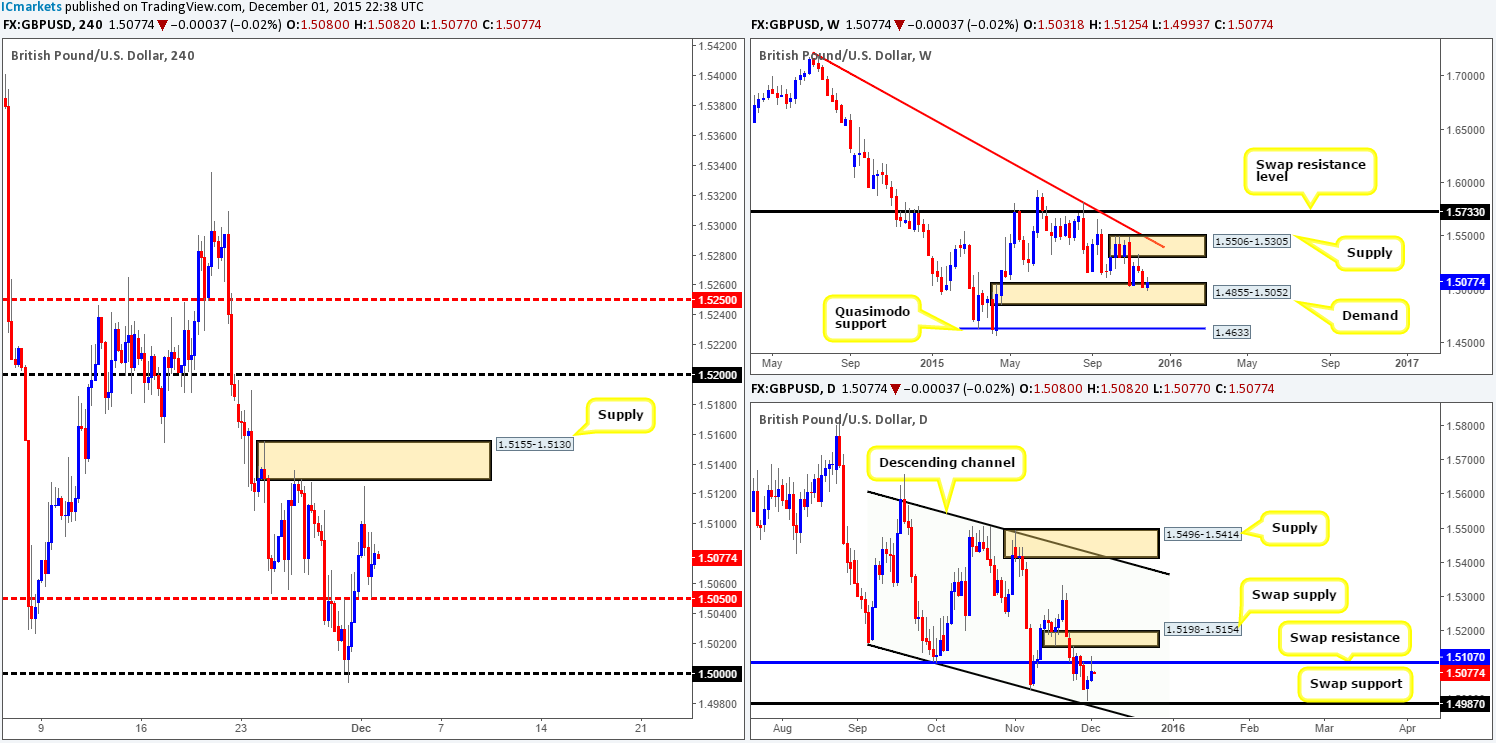
In our previous report (http://www.icmarkets.com/blog/tuesday-1st-december-daily-technical-outlook-and-review/), it was mentioned that we took a long position on Monday from just above psychological support 1.5000 at 1.50025. We also mentioned that we’d already liquidated 50% of our position at 1.5050, and were looking to bank the rest at the H4 supply seen above at 1.5155-1.5130. As you can see, Cable just missed hitting this area, and annoyingly missed our take-profit level by two pips! We ended closing the position a little lower at 1.50967, which in turn saw prices continue to decline down to around mid-level support 1.5050.
Ok, so let’s see what we have here… Weekly bulls are beginning to show interest at the top-side of demand drawn from 1.4855-1.5052, whilst price on the daily timeframe has shown selling interest from the underside of a swap resistance barrier at 1.5107. This – coupled with high-impacting GBP data (construction PMI) being released later on today makes this a rather tricky pair to trade for now.
To that end, the best, and in our opinion, most logical path to take today would be to remain flat until the GBP news has had its turn in the spotlight later on this morning at 9.30am GMT, and then reassess.
Levels to watch/ live orders:
- Buys: Flat (Stop loss: N/A).
- Sells: Flat (Stop loss: N/A).
AUD/USD:
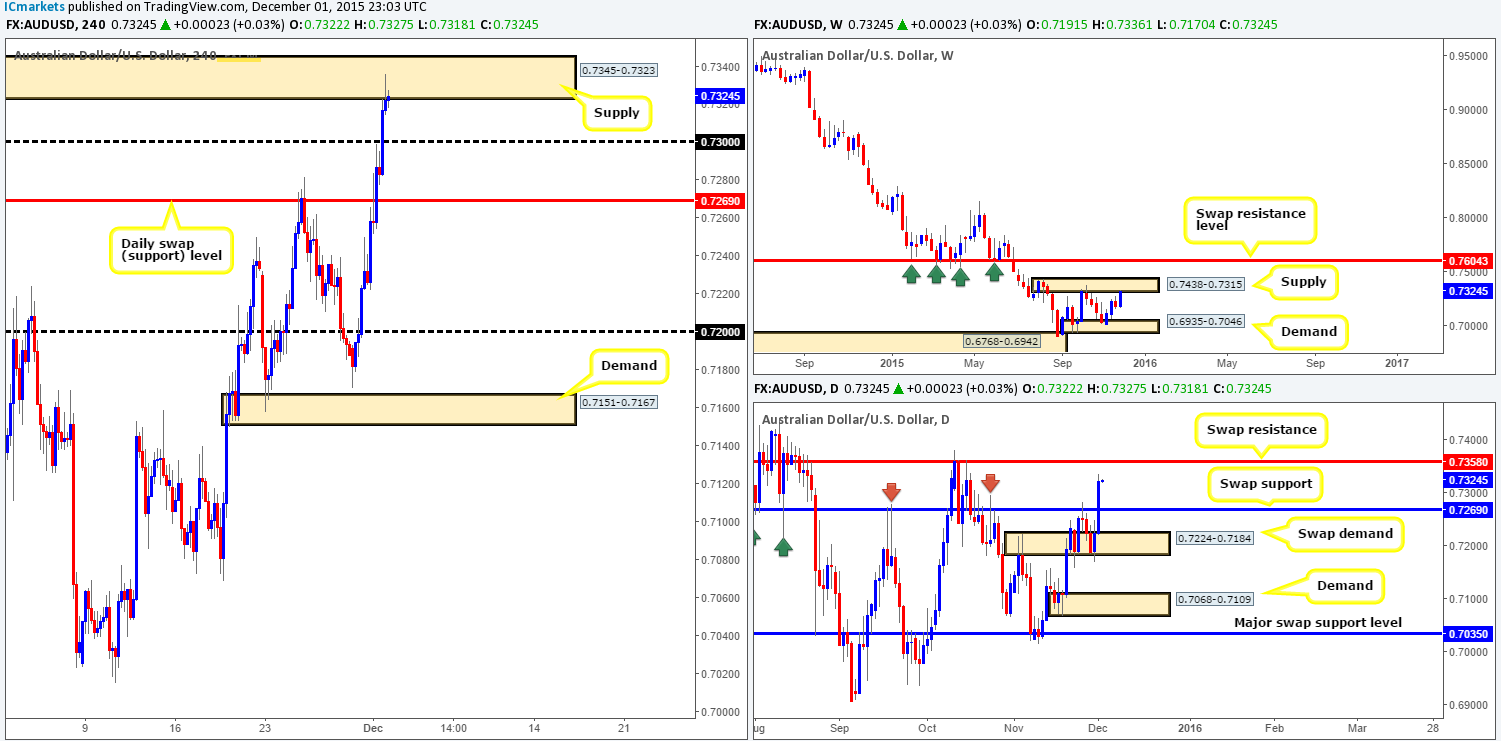
It was clearly a bad day for anyone trying to short the commodity currency yesterday! The Aussie was on fire. Both the daily swap (resistance now support) level at 0.7269 and psychological resistance 0.7300 were taken out during this onslaught, allowing prices to tag in offers around supply at 0.7345-0.7323 by the day’s end.
Interestingly, this recent advance also pushed this pair up into the jaws of weekly supply drawn from 0.7438-0.7315, which, in our book, adds a lot of weight to current H4 supply zone. Despite this, daily action shows there is potential for further upside yet towards the swap resistance level coming in at 0.7358. Therefore, if one is considering shorting from the H4 supply today, be prepared for a possible fake above here.
Given the points made above, our team has come to a general consensus that instead of jumping in short at this supply right now, we’re going to wait and see if the fakeout happens beforehand. Reason being is this could allow us to enter at better (higher) prices, thus giving a better risk/reward to the first take-profit target – 0.7300. It will be interesting to see how this plays out.
Levels to watch/ live orders:
- Buys: Flat (Stop loss: N/A).
- Sells: Watch for price to fake above H4 supply at 0.7345-0.7323 up to the 0.7358 daily resistance level before looking to short this pair (waiting for confirmation here is still advised).
USD/JPY:
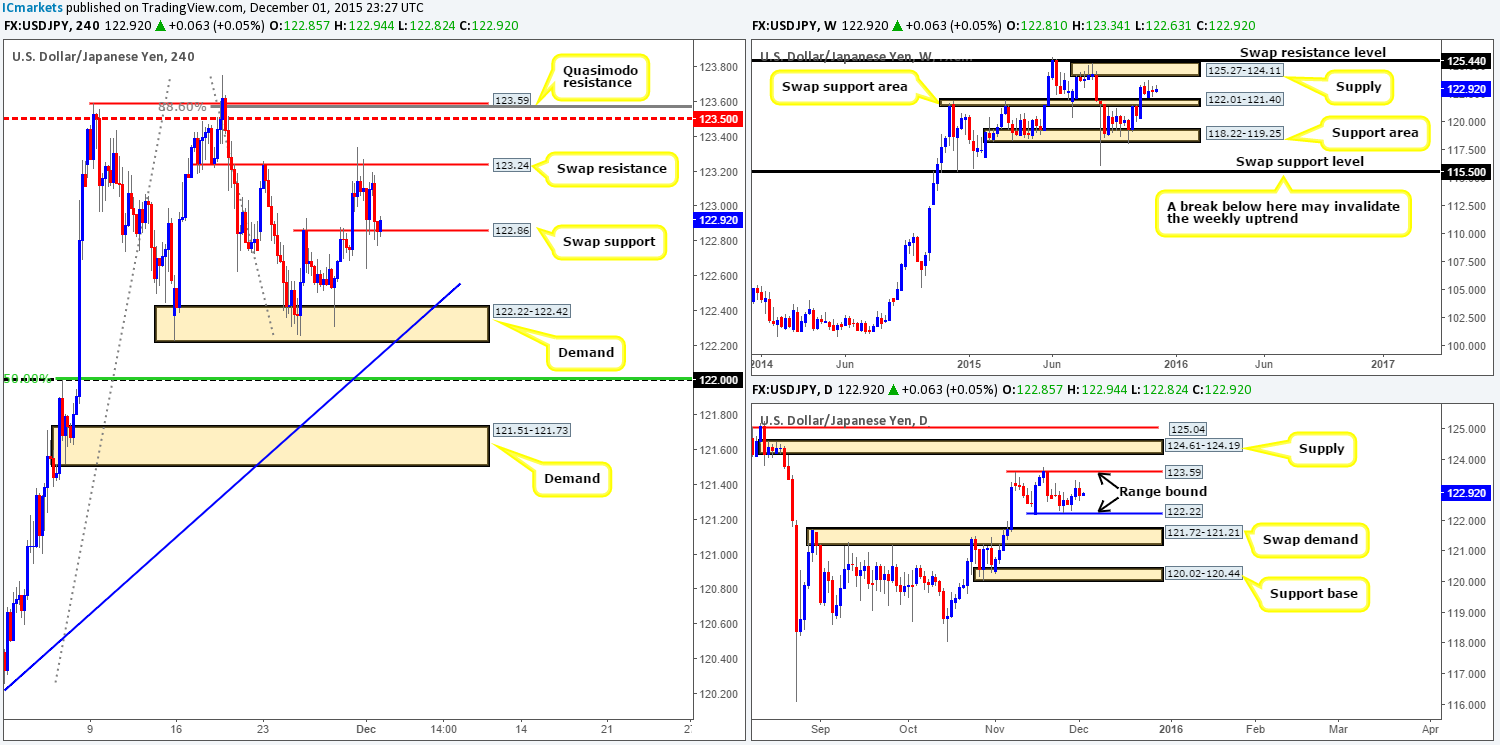
With not only the weekly timeframe ranging between a swap support area at 122.01-121.40 and a supply area seen at 125.27-124.11, but also the daily action loitering mid-range between 123.59/122.22, trading this pair is proving difficult.
Yesterday’s H4 activity was, as you can see, held higher by a swap support hurdle coming in at 122.86. In spite of this, our team has no interest trading from here, or the swap resistance level above at 123.24. Instead we’re looking beyond these barriers to more confluent areas.
Below current prices sits a demand zone drawn from 122.22-122.42, which essentially forms the lower band of the aforementioned daily range. In addition to this, there is also trendline support confluence seen here extended from the low 119.61. However, we would only advise trading this area should one spot attractive lower timeframe confirming price action, since directly below sits psychological support 122.00. This is no ordinary psychological number here traders! It boasts 50.0% Fibonacci support at 122.01 and sits on top of the weekly swap (support) area mentioned above at 122.01-121.40, so do keep a close eye on this level for a possible trade today/this week.
Above the H4 swap resistance at 123.24, we’re eyeing the Quasimodo resistance level at 123.59. This, as you can probably see also marks the upper band of the current daily range, converges nicely with the 88.6% Fibonacci level at 123.56 and is positioned just above the mid-level number 123.50. A short from here is high probability in our opinion, and depending on the time of day and what news is due to be released, we may consider entering at market here.
Levels to watch/ live orders:
- Buys: 122.22-122.42[Tentative – confirmation required] (Stop loss: dependent on where one confirms this area). 122.00 [Confirmation required here due to likelihood of a fakeout] (Stop loss: dependent on where one confirms this level).
- Sells: 123.59 [Dependent on news and the time of day, a short at market could be possible from here] (Stop loss: 123.77).
USD/CAD:
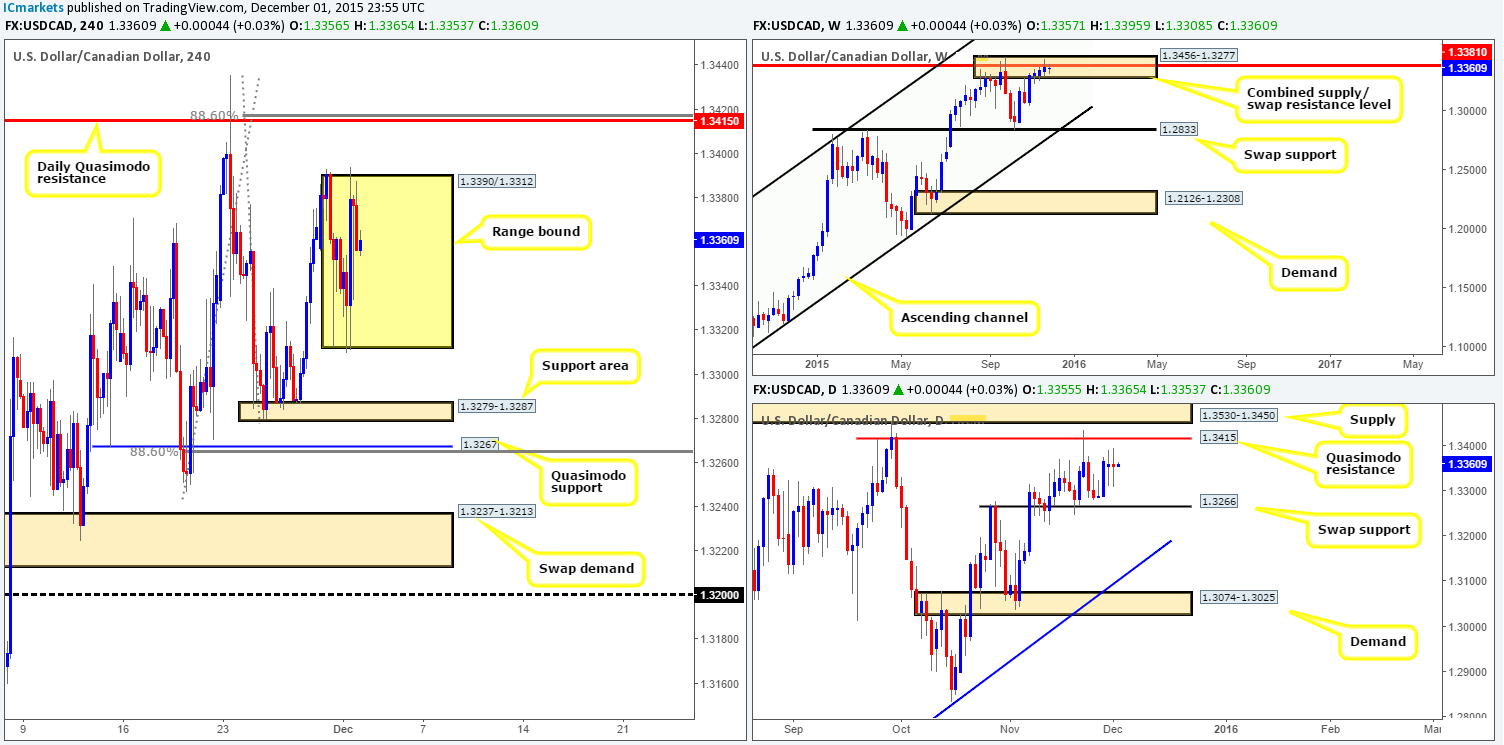
Consequent to the USD/CAD’s recent volatility (yesterday’s CAD GDP release), H4 action appears to be carving out a consolidation zone between 1.3390/1.3312 right now. Alongside this, price continues to loiter within the weekly combined supply/ swap resistance area at 1.3456-1.3277/1.3381, and daily action printed its second consecutive indecision candle whilst also loitering between Quasimodo resistance at 1.3415 and a swap support barrier at 1.3266.
Given the points above, what levels is our team looking at today? Although the current H4 range is large enough to profit trading the extremes, we’ll humbly pass and look beyond to the more confluent zones to trade. Here’s why:
Above the H4 range lurks a daily Quasimodo resistance level mentioned above at 1.3415. Not only has this barrier proven itself already by holding this market lower on the 23/11/15, it also coincides nicely with both the aforementioned combined weekly supply/ swap resistance area and the 88.6% Fibonacci level at 1.3416 (waiting for lower timeframe confirmation is recommended before selling here to avoid a fakeout). Therefore, this will be our base for sells today.
Beneath the H4 range, nonetheless, there is a clear H4 support area at 1.3279-1.3287, which despite how well it has held price recently, this support areais also not somewhere we’d consider safe to buy from due to the Quasimodo support below it at 1.3267. Reason being is this Quasimodo level converges with the 88.6% Fibonacci level at 1.3265 and also the daily swap (support) at 1.3266. As such, this is the zone we’d feel most comfortable to buy from (confirmation still advised due to where price is positioned on the weekly timeframe – see above) during today’s trade.
Levels to watch/ live orders:
- Buys:1.3267 [Tentative – confirmation required] (Stop loss: dependent on where one confirms this level).
- Sells:1.3415 [Tentative – confirmation required] (Stop loss: dependent on where one confirms this level).
USD/CHF:
Following last week’s close above weekly supply at 1.0239-1.0131, price has begun to reverse, which in turn could see the Swissy retest this recently broken area as demand this week. By the same token, daily action is also hovering above the recently broken daily supply (now demand) at 1.0239-1.0185.
A quick recap of yesterday’s session on the H4 timeframe shows that price rallied higher during the early hours of yesterday’s trade, tagging in offers around psychological resistance 1.0300 at the beginning of the American session. This, as you can see, forcefully pushed this pair south, closing the day out around the 1.0258 mark.
Considering where price is positioned on the higher timeframe picture (see above) right now, our team remains biased to the bid-side of this market for the time being. On that account, today’s spotlight will be focused on the following areas for possible trades:
- Mid-level support at 1.0250 coupled with demand just below it at 1.0225-1.0241. With this demand sitting within both the weekly and daily swap demand (1.0239-1.0131/1.0239-1.0185), we may, dependent on the time of day and news being released at the time, look for a market long here.
- Watch for offers to be consumed at psychological resistance 1.0300 and look to trade any (confirmed) retest seen from here, targeting the mid-level resistance 1.0350 as a first take-profit target, followed by the underside of weekly supply at 1.0376.

Levels to watch/ live orders:
- Buys: 1.0250/1.0225-1.0241 (Stop loss: 1.0221). Watch for offers to be consumed around 1.0300 and then look to trade any retest seen at this level (confirmation required).
- Sells: Flat (Stop loss: N/A).
DOW 30:
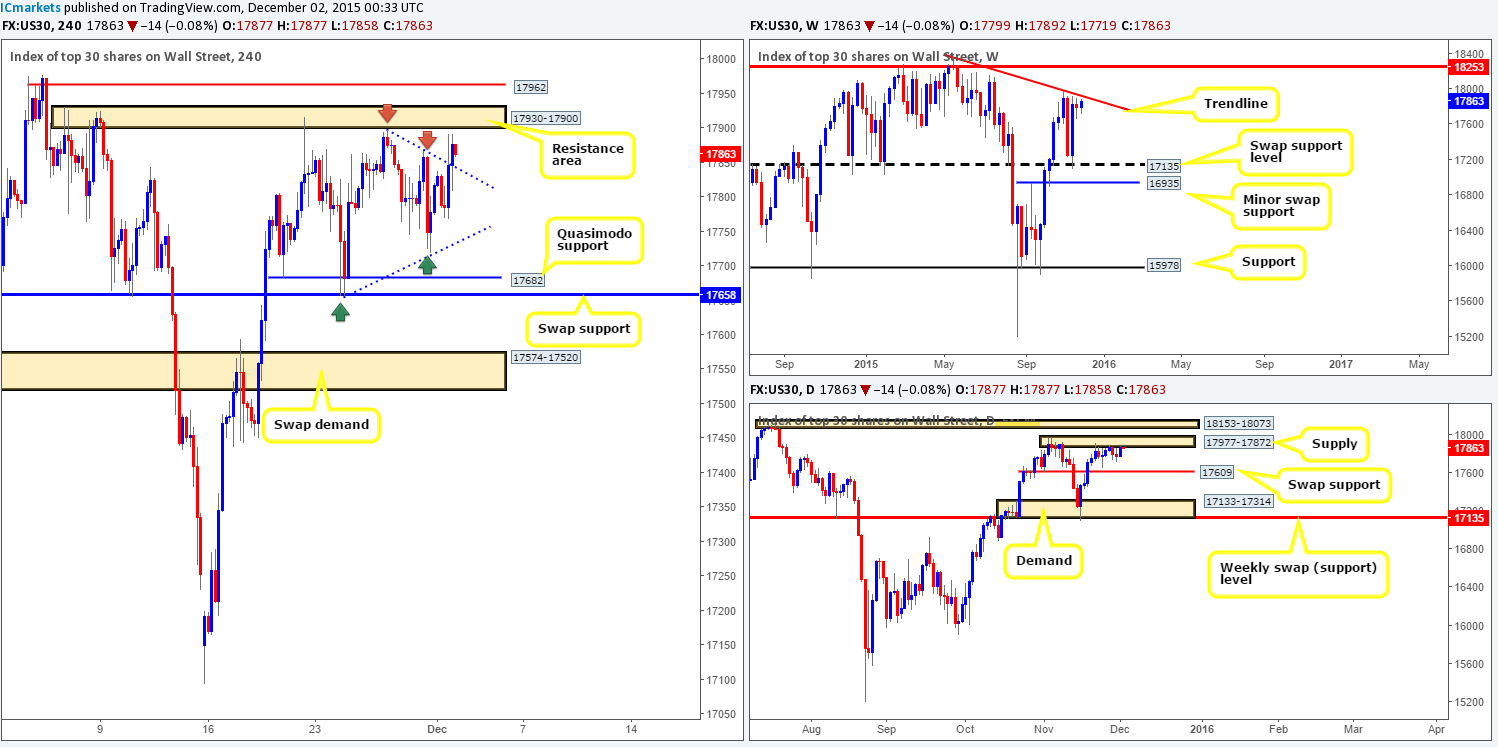
Recent action on the DOW shows that a relatively heavy wave of bids came into this market going into the American open. This, as shown on the H4 chart, broke above the current wedge pattern (17898/17655) reaching highs of 17892 on the day. For those who read our previous report (http://www.icmarkets.com/blog/tuesday-1st-december-daily-technical-outlook-and-review/), you may recall that we had no interest in buying the break or even entering long following any retest of this wedge, due to a clear resistance area at 17930-17900 clouding this pattern. Not only this, but also the fact that this H4 area is bolstered by both a weekly trendline resistance (18365) and a daily supply at 17977-17872.
Therefore, in the same manner as yesterday’s analysis, we are planning to sell (with confirmation to avoid a fakeout)from the above said H4 resistance area today.
Levels to watch/ live orders:
- Buys: Flat (Stop loss: N/A).
- Sells:17930-17900 [Tentative – confirmation required] (Stop loss: dependent on where one confirms this area).


