A note on lower timeframe confirming price action…
Waiting for lower timeframe confirmation is our main tool to confirm strength within higher timeframe zones, and has really been the key to our trading success. It takes a little time to understand the subtle nuances, however, as each trade is never the same, but once you master the rhythm so to speak, you will be saved from countless unnecessary losing trades. The following is a list of what we look for:
- A break/retest of supply or demand dependent on which way you’re trading.
- A trendline break/retest.
- Buying/selling tails – essentially we look for a cluster of very obvious spikes off of lower timeframe support and resistance levels within the higher timeframe zone.
- Candlestick patterns. We tend to only stick with pin bars and engulfing bars as these have proven to be the most effective.
For us, lower timeframe confirmation starts on the M15 and finishes up on the H1, since most of our higher timeframe areas begin with the H4.
EUR/USD:
Following Sunday’s open 1.0588 the EUR ended the day closing below the H4 demand (now supply) zone at 1.0569-1.0596, potentially freeing the path south for price to challenge mid-level support 1.0550.
Consequent to this, our team has come to a general consensus that 1.0550 is where we going to focus our attention today due to the following converging structures:
- Price is trading within both a weekly range demand zone at 1.0519-1.0798 and its partner demand on the daily timeframe at 1.0519-1.0583.
- 1.0550 has relatively significant history (17/03/15/13/04/15).
- Coincides nicely with the lower limit of the current wedge pattern taken from the low 1.0674.
The reason for requiring lower timeframe confirmation to buy at 1.0550 simply comes from the clear downtrend this market is in at the moment.
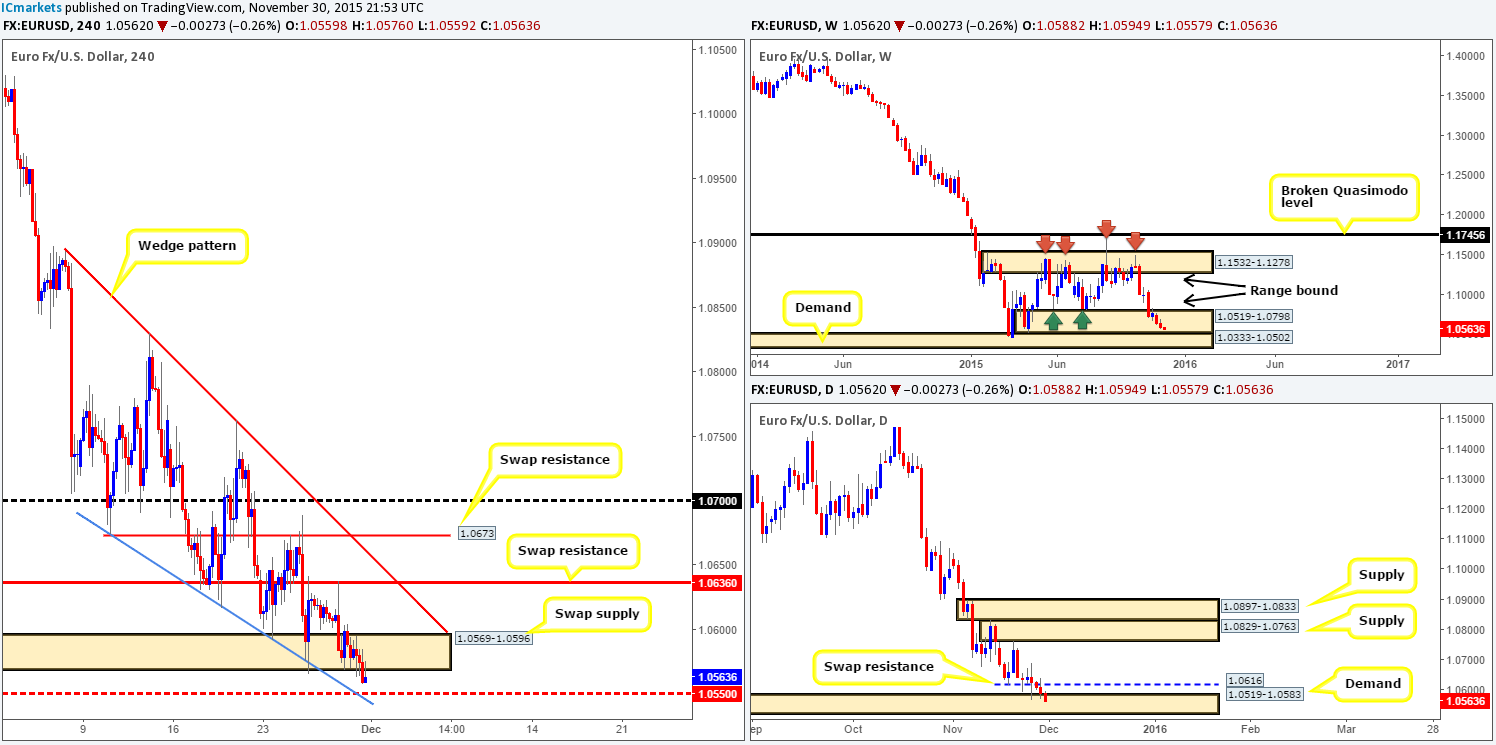
Levels to watch/live orders:
- Buys: 1.0550 [Tentative – confirmation required] (Stop loss: dependent on where one confirms this level).
- Sells: Flat (Stop loss: N/A).
GBP/USD:
For those who read our previous report on Cable (http://www.icmarkets.com/blog/monday-30th-november-weekly-technical-outlook-and-review/) you may recall us mentioning that we were very interested in buying from psychological support 1.5000 at market. As can be seen from the H4 chart, price reacted nicely to this barrier, filling our buy order at 1.50025. This move should not really come as a surprise considering the additional support this number had. Not only was it located within weekly demand at 1.4855-1.5052, it also converged with a daily swap (support) level at 1.4987 and a daily channel support extended from the low 1.5162.
At the time of writing, 50% of our position has been closed at mid-level resistance 1.5050 and the stop-loss order moved to breakeven. Ultimately, what we’re looking for now is 1.5050 to hold as support and price to break above swap resistance coming in at 1.5071. Reason being is there appears to be little resistance beyond this level until the daily swap resistance at 1.5107, followed closely by H4 supply seen at 1.5155-1.5130.
In the event that 1.5050 fails to hold, we see little to stop this pair dropping back down to our entry level. Therefore, we will close the position should a sustained break lower be seen.
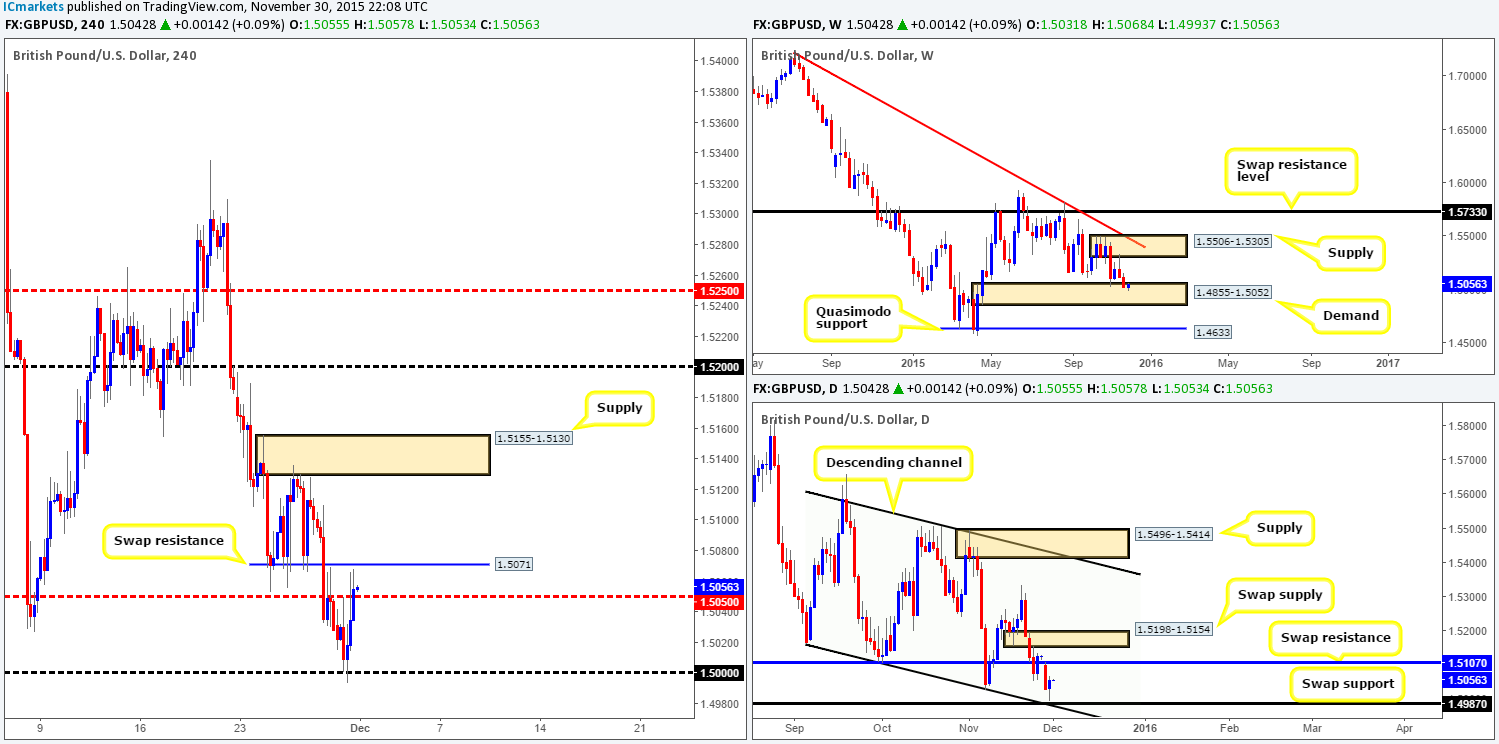
Levels to watch/ live orders:
- Buys: 1.50025 [LIVE] (Stop loss: Breakeven).
- Sells: Flat (Stop loss: N/A).
AUD/USD:
The AUD/USD remained well-bid throughout the majority of yesterday’s trade. Offers at psychological resistance 0.7200 were consumed allowing price to aggressively stab above a swap resistance level at 0.7237, and trigger sell orders from supply circled in pink at 0.7262-0.7249.
Trading this pair is certainly a tricky one this morning! Purely from the H4 chart, there’s really very little stopping price from dropping down to psychological support 0.7200 today. However, when we scan across to the daily chart, we can see that yesterday’s action printed a healthy-looking bullish engulfing candle from a swap demand base at 0.7224-0.7184. That being the case, price could very well continue advancing today to connect with the daily swap (resistance) level at 0.7269.
Therefore, in the absence of clearer price action, our team has decided to remain flat during today’s upcoming trade.
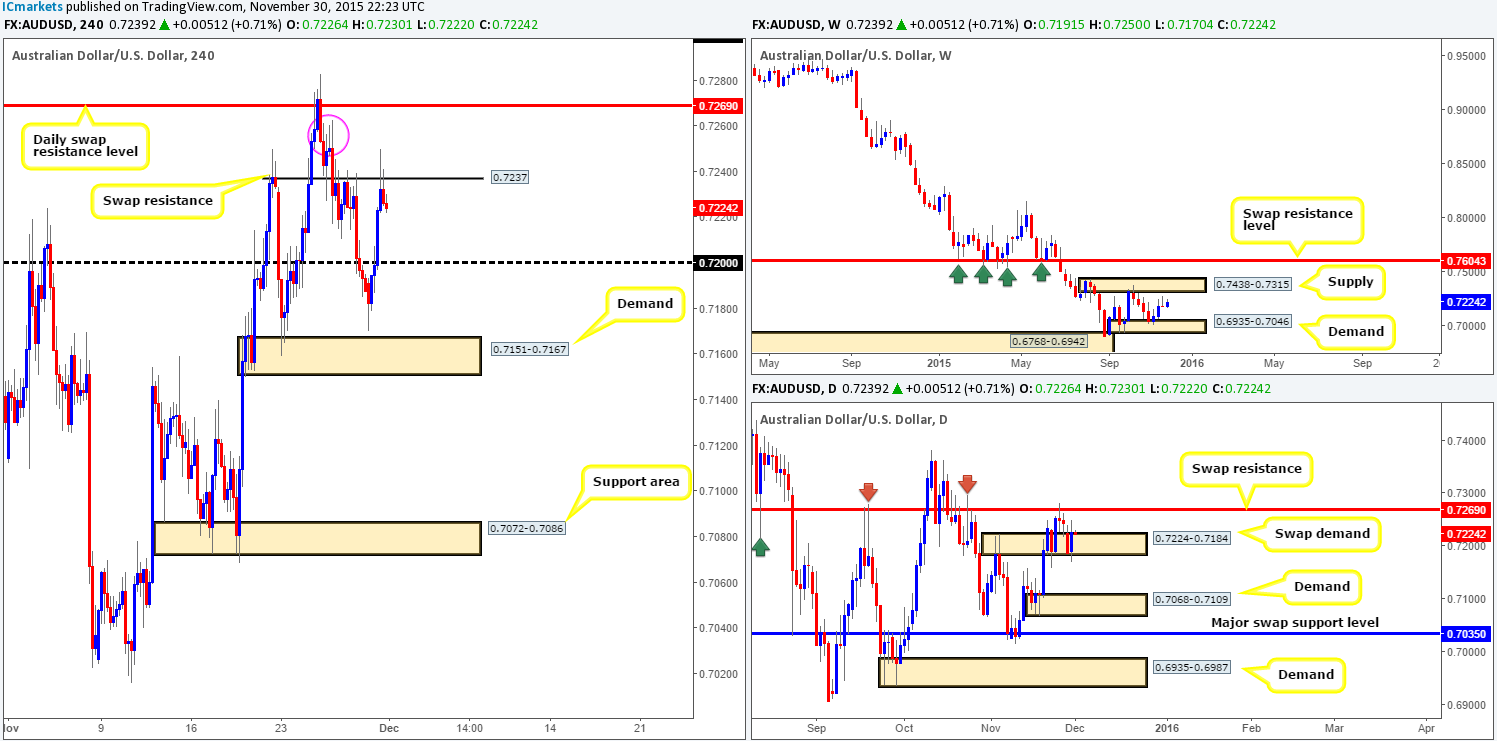
Levels to watch/ live orders:
- Buys: Flat (Stop loss: N/A).
- Sells: Flat (Stop loss: N/A).
USD/JPY:
Despite H4 resistance at 122.86 holding steady around the open 122.81 yesterday, a heavy round of bids flowed into this market as we entered into London trade. This, as can be seen from the H4 chart, took out psychological resistance 123.00 and tagged in offers sitting at a swap resistance level drawn from 123.24.
With price now effectively loitering between 123.00 and 123.24, where does our team stand in the bigger picture? Well, weekly action is offering little in our opinion other than price trading between a swap support area coming in at 122.01-121.40 and a supply area seen at 125.27-124.11. Moving down to the daily timeframe, however, we can see market action has begun to carve out a consolidation zone between 123.59/122.22, and at the time of writing, appears to be heading towards the upper limit of this range.
With the above in mind, we are interested in the following levels today:
- Watch for offers to be consumed at the swap resistance level 123.24 and look to trade any retest seen here for a small intraday long up to 123.50/123.59 (confirmation required).
- Assuming point one comes to fruition, this will lead price nicely to the Quasimodo resistance level at 123.59. This, as you can probably see also marks the upper band of the current daily range. It also converges nicely with the 88.6% Fibonacci level at 123.56 and is positioned just above the mid-level number 123.50. A short from here is high probability in our opinion, and depending on the time of day and what news is due to be released, we may consider entering at market here.
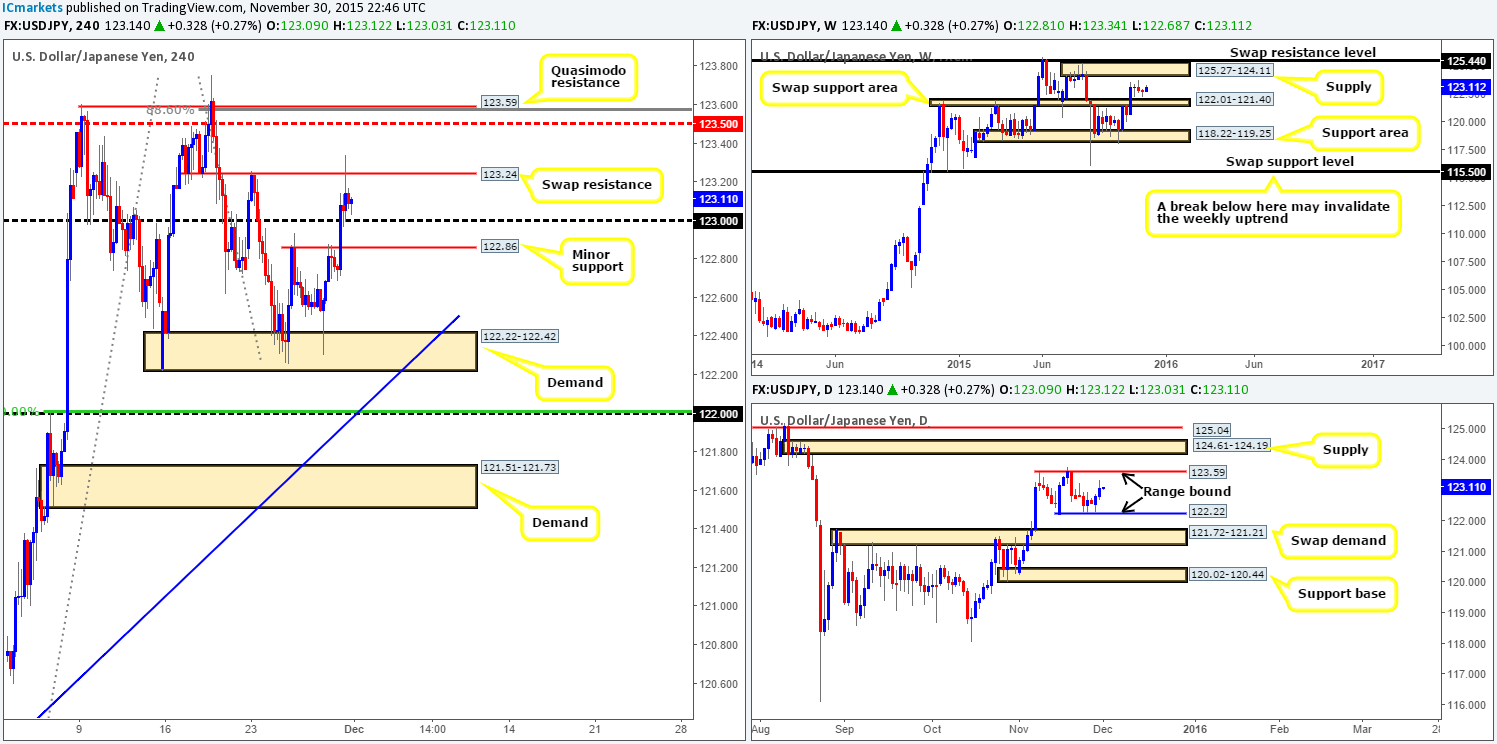
Levels to watch/ live orders:
- Buys: Watch for offers to be consumed around 123.24 and then look to trade any retest seen at this level (confirmation required).
- Sells: 123.59 [Tentative – confirmation required] (Stop loss: dependent on where one confirms this level).
USD/CAD:
Starting from the top this morning, we can see that weekly action remains consolidating within a combined supply/ swap resistance area at 1.3456-1.3277/1.3381. Down in the pits of the daily timeframe, however, a clear-cut indecision candle was painted during yesterday’s trade as price loiters between a Quasimodo resistance level at 1.3415 and a swap support barrier at 1.3266.
Turning our attention to the H4 timeframe, immediately after the markets opened at 1.3357 a strong wave of bids hit the line. Consequent to this, supply at 1.3377-1.3355 was taken out with price reaching highs of 1.3392, before aggressively collapsing down to lows of 1.3312.
Given the points made above, we’re even-handed going into today’s trade. Levels we have our eye on are as follows:
- The daily Quasimodo at 1.3415. Not only has this level proven itself already by holding this market lower on the 23/11/15, it also coincides nicely with both the aforementioned combined weekly supply/ swap resistance area and the 88.6% Fibonacci level at 1.3416 (waiting for lower timeframe confirmation is highly recommended before selling here).
- The support area at 1.3279-1.3287 on the other hand is still not likely somewhere we’d consider is a safe place to buy from due to the Quasimodo support level lurking just below it at 1.3267. Reason being is this Quasimodo level converges with the 88.6% Fibonacci level at 1.3265 and also the daily swap (support) at 1.3266. Therefore, this is an area to keep an eye on for confirmed buys.
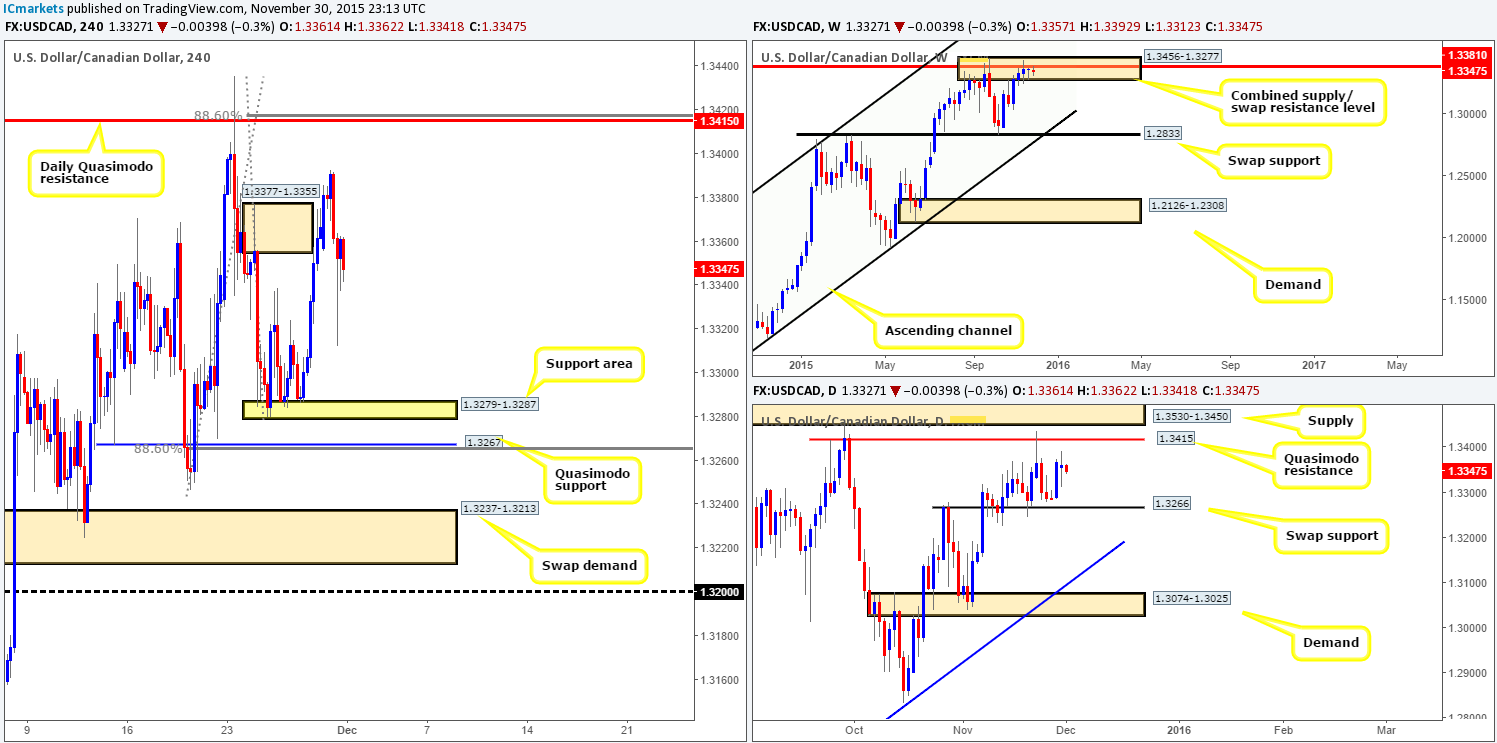
Levels to watch/ live orders:
- Buys: 1.3267 [Tentative – confirmation required] (Stop loss: dependent on where one confirms this level).
- Sells: 1.3415 [Tentative – confirmation required] (Stop loss: dependent on where one confirms this level).
USD/CHF:
This morning’s analysis will kick off with a look at the weekly chart, which shows supply (now demand) seen at 1.0239-1.0131 was consumed during last week’s rally, potentially opening the gates to further upside this week towards supply at 1.0626-1.0376. Zooming in down to the daily timeframe, we can see that following the consumption of the weekly’s partner supply (now demand) at 1.0239-1.0185, a daily indecision candle was printed during yesterday’s session. Irrespective of this, the trapdoor for prices to challenge the swap resistance level seen above at 1.0388 (located just within the weekly supply mentioned above at 1.0626-1.0376) has now very likely been opened.
In our previous report (http://www.icmarkets.com/blog/monday-30th-november-weekly-technical-outlook-and-review/), we mentioned that we’d like to see is a forceful close above psychological resistance 1.0300 and subsequent retest as support, which, as you can see did happen. What we also said was that if we were able to find a lower timeframe buy setup here, then we would very likely enter long. Well, we did find a setup, but fortunately for our sake, we were already long the GBP/USD, so we passed. Good thing really as price crashed below this number going into U.S trade reaching lows of 1.0258 on the day.
Due to the where price is positioned on the higher timeframe picture (see above) right now, our team is still biased to the bid-side of this market for the time being. To that end, we’re looking at the following levels today:
- Mid-level support at 1.0250 coupled with demand just below it at 1.0225-1.0241. With this demand sitting within both the weekly and daily swap demand (1.0239-1.0131/ 1.0239-1.0185), we may, dependent on the time of day and news being released at the time, look for a market long here.
- Watch for offers to be consumed at psychological resistance 1.0300 and look to trade the retest from here, targeting the mid-level resistance 1.0350 as a first take-profit target, followed by the underside of weekly supply at 1.0376.
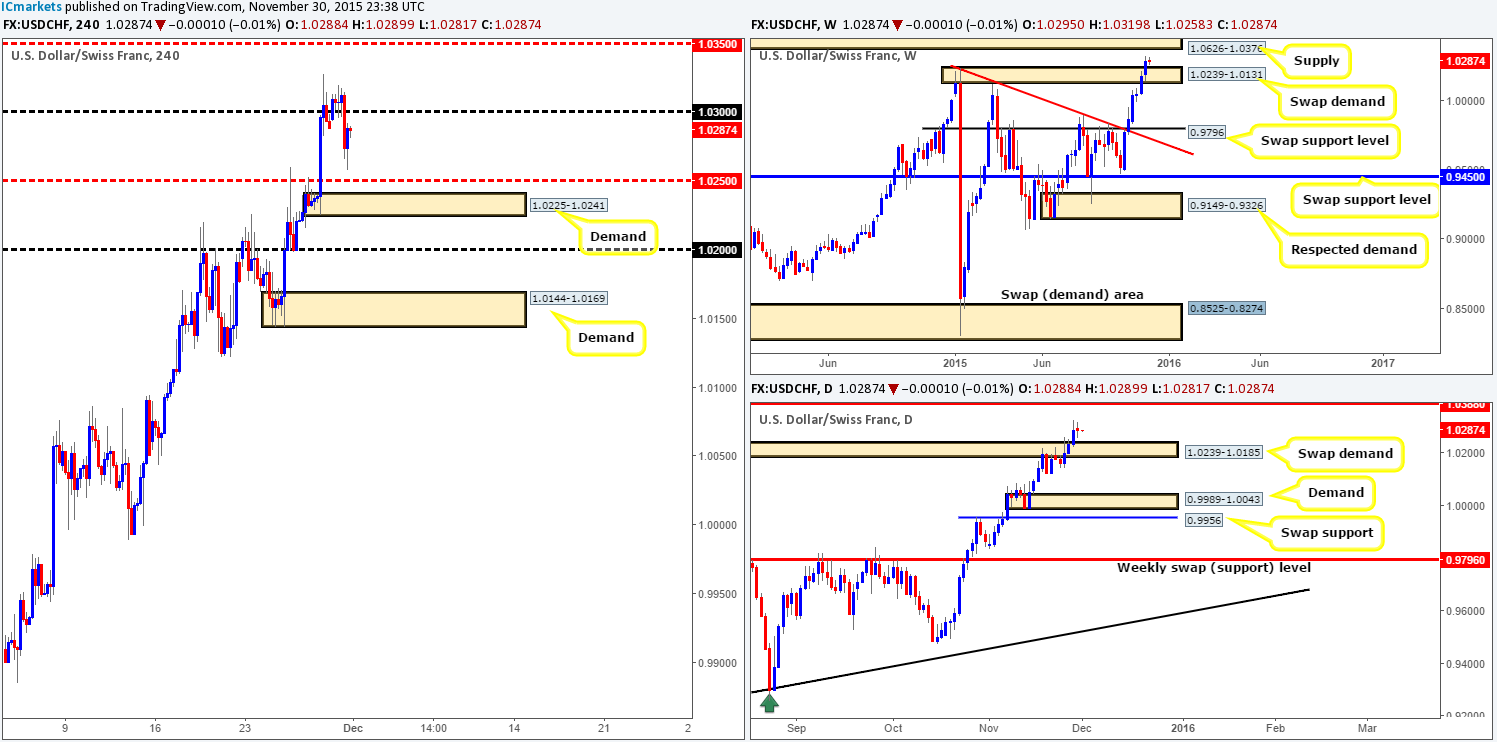
Levels to watch/ live orders:
- Buys: 1.0250/ 1.0225-1.0241 (Stop loss: 1.0221) watch for offers to be consumed around 1.0300 and then look to trade any retest seen at this level (confirmation required).
- Sells: Flat (Stop loss: N/A).
DOW 30 (Slightly revised H4 chart)
As can be seen on the H4 chart, price is currently forming a nice-looking wedge pattern (17898/17655) drawn with blue-dashed lines. As we all know, wedge patterns such as these are generally considered continuation setups. However, since there is a clear resistance area at 17930-17900 clouding this pattern above that is bolstered by not only a weekly trendline resistance (18365), but also a daily supply at 17977-17872, be VERY careful if you’re looking to buy any break above the H4 pennant!
Due to this, we are planning to sell (with confirmation to avoid a fakeout) any break north of this current pennant formation from the above said H4 resistance area today.
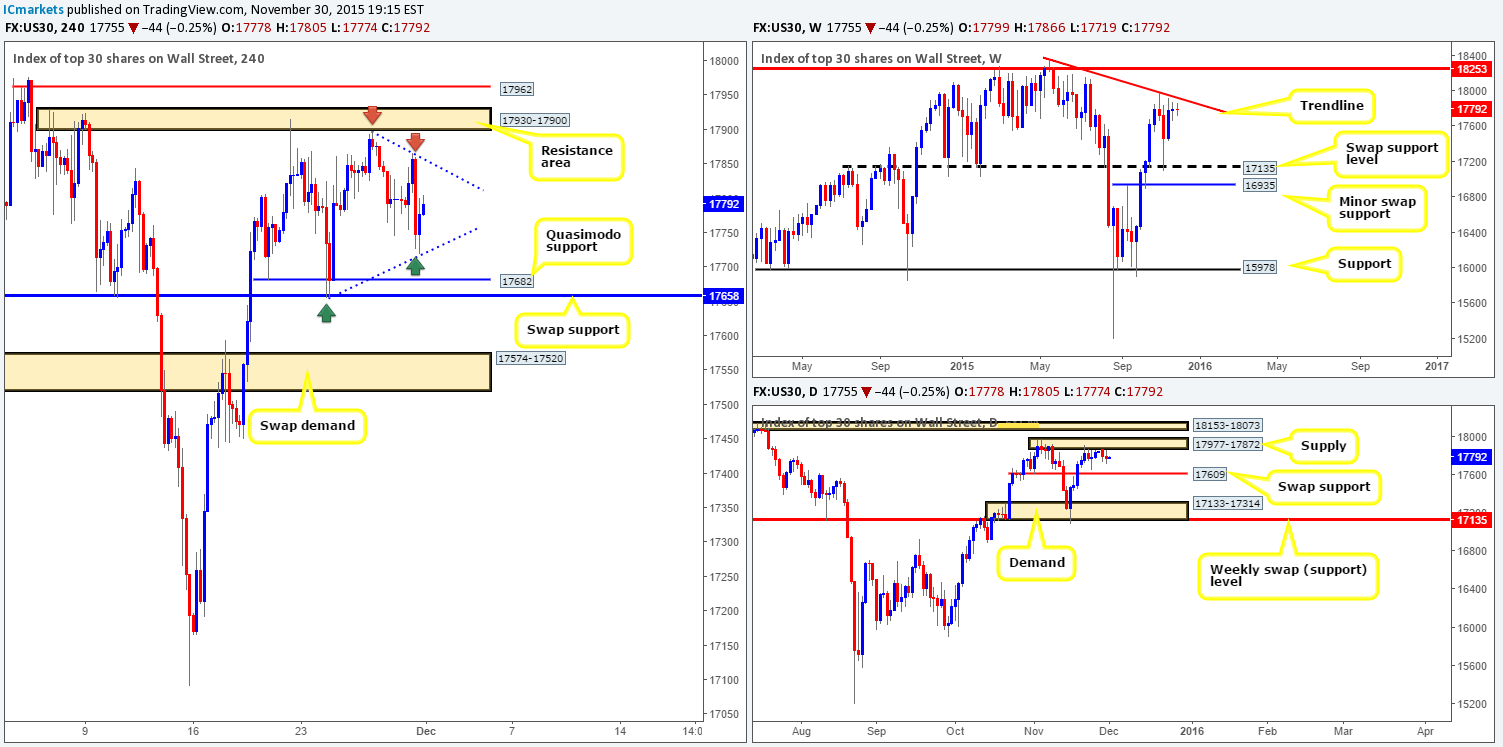
Levels to watch/ live orders:
- Buys: Flat (Stop loss: N/A).
- Sells: 17930-17900 [Tentative – confirmation required] (Stop loss: dependent on where one confirms this area).
XAU/USD (Gold):
Early on in U.S. trade yesterday, Gold came alive. Price rallied north breaking above the daily swap (resistance) level at 1063.4 and connected with a H4 swap supply zone at 1066.0-1070.4, which, as you can see, merges nicely with channel resistance taken from the high 1097.99.
We mentioned in Monday’s report (http://www.icmarkets.com/blog/monday-30th-november-weekly-technical-outlook-and-review/) that we would be watching for confirmed shorts around both of the above said areas. With the daily level slightly broken now however, our focus will be directed towards the above said swap supply zone today. The reason for requiring confirmation here simply comes from seeing room for Gold to pullback further on the weekly timeframe up to the recently broken Quasimodo line at 1074.6.
Should all go to plan here and we manage to spot a lower timeframe sell setup, we would look to hold on to this trade at least until the H4 channel support taken from the low 1074.0, and possibly even down to the daily demand area mentioned above.
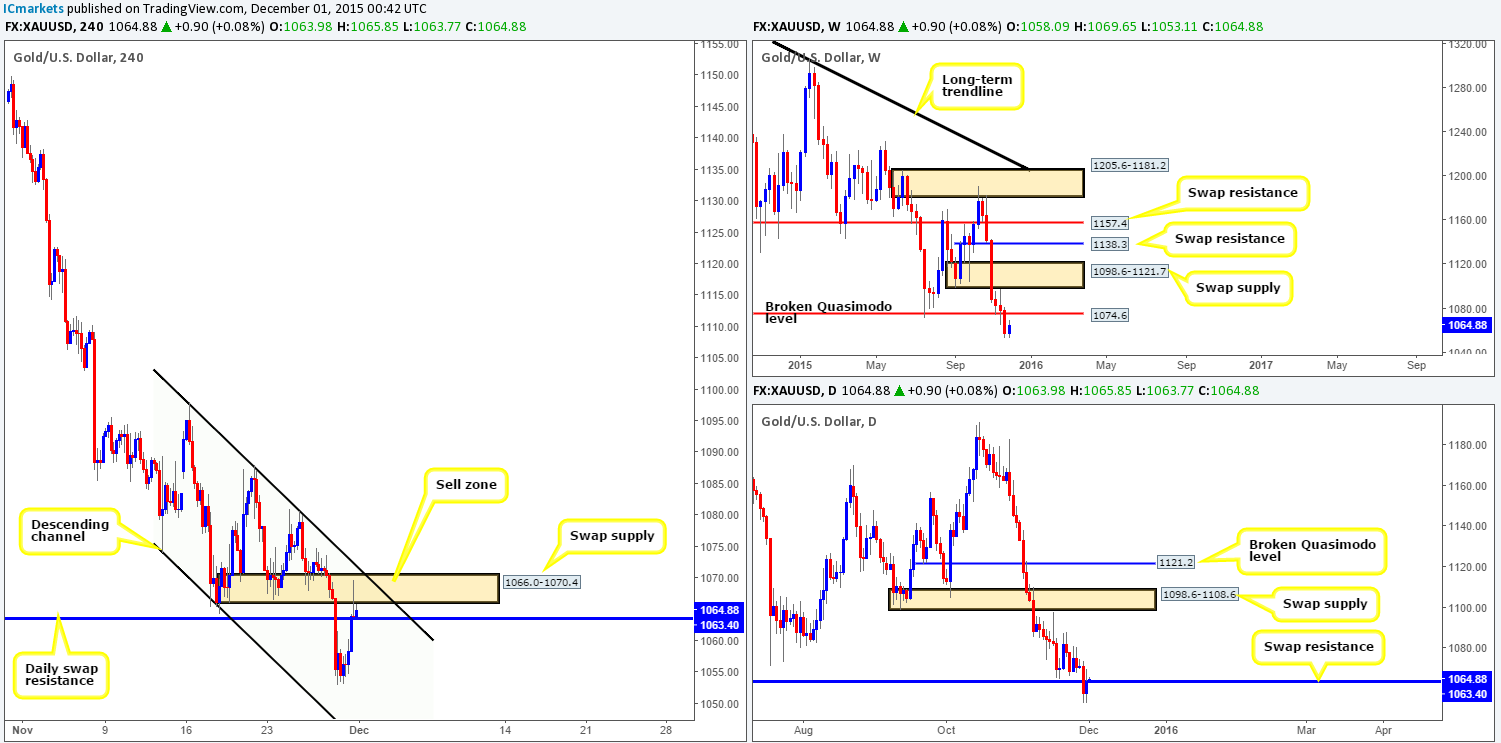
Levels to watch/live orders:
- Buys: Flat (Stop loss: N/A).
- Sells: 1066.0-1070.4 [Tentative – confirmation required] (Stop loss: dependent on where one confirms this area).


