
DXY:
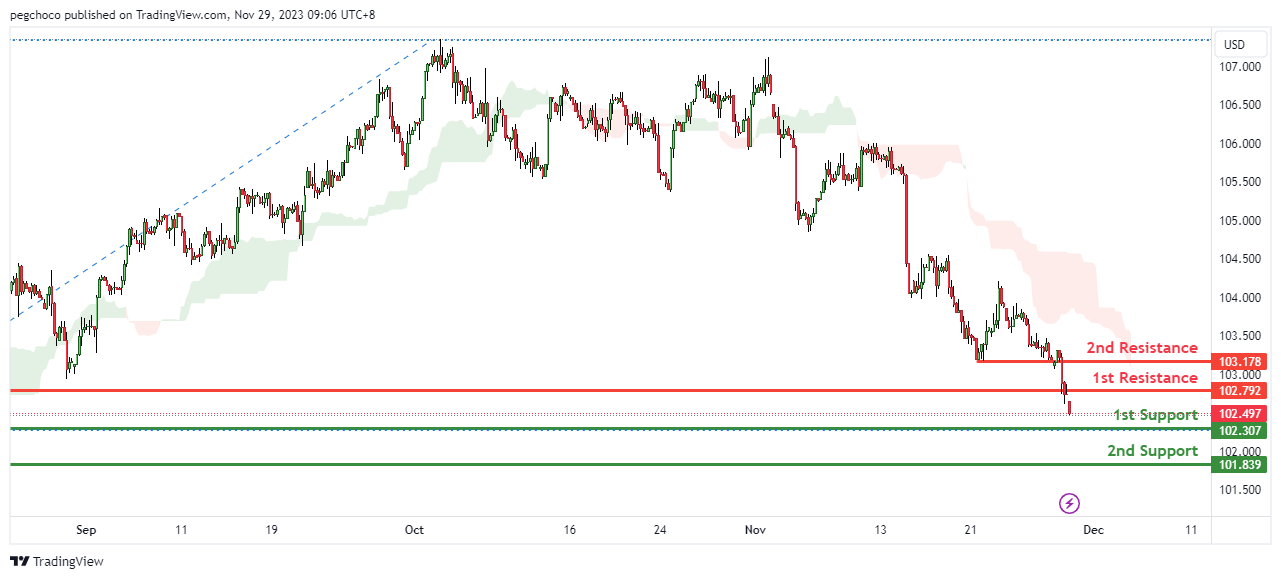
The DXY (US Dollar Index) could potentially make a Bearish continuation towards the 1st support.
The 1st support at 102.30 is identified as a pullback support. This suggests that it’s a significant level where buying interest may emerge, providing support for the DXY.
The 2nd support at 101.83 is another overlap support level. This adds further significance to this support level, indicating it as a potential area where buyers might become active.
On the resistance side, The 1st resistance at 102.79 is categorized as a pullback resistance, implying that it’s a level where selling pressure may increase, acting as a potential barrier to further upward price movement.
The 2nd resistance at 103.17 is also noted as a pullback resistance, adding to the potential resistance factors for the DXY.
EUR/USD:
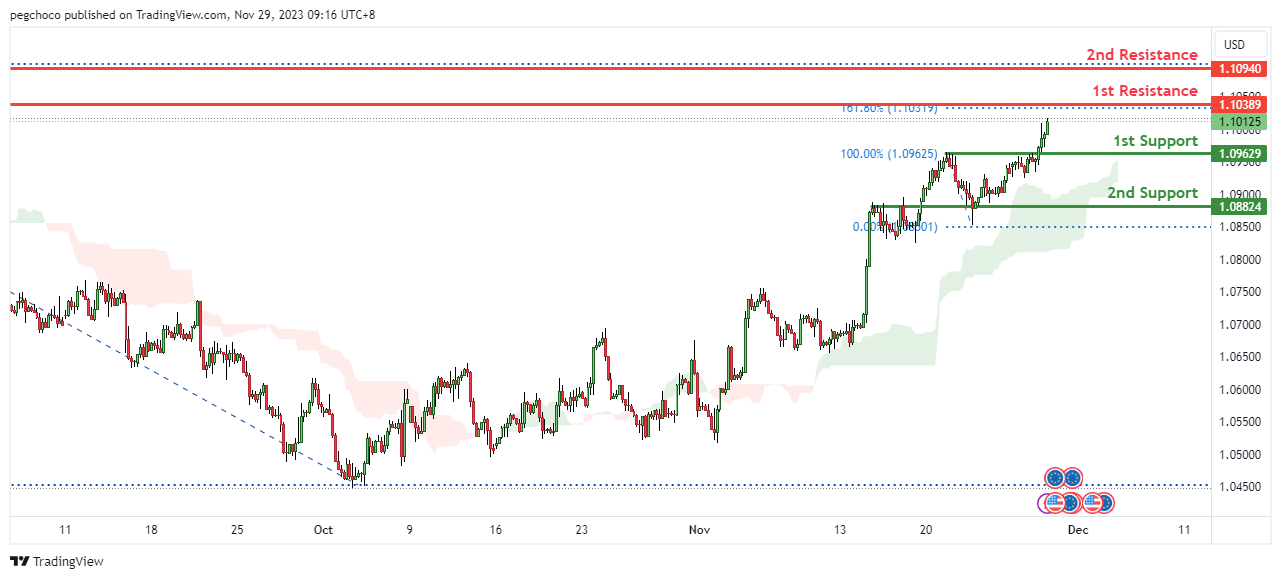
The EUR/USD could potentially make a Bullish continuation towards the 1st resistance.
The 1st support at 1.0962 is identified as a pullback support. This suggests that it’s a significant level where buying interest may emerge, providing support for the EUR/USD currency pair.
The 2nd support at 1.08824 is another overlap support level. This adds further significance to this support level, indicating it as a potential area where buyers might become active.
On the resistance side,
The 1st resistance at 1.1038 is categorized as an overlap resistance and is also associated with the 161.80% Fibonacci Extension level. This dual significance suggests that it’s a significant barrier where selling interest could intensify, potentially halting further upward movement for the EUR/USD.
The 2nd resistance at 1.1094 is noted as a pullback resistance, indicating that it’s a level where selling pressure may increase, acting as another potential obstacle to the currency pair’s upward price movement.
EUR/JPY:
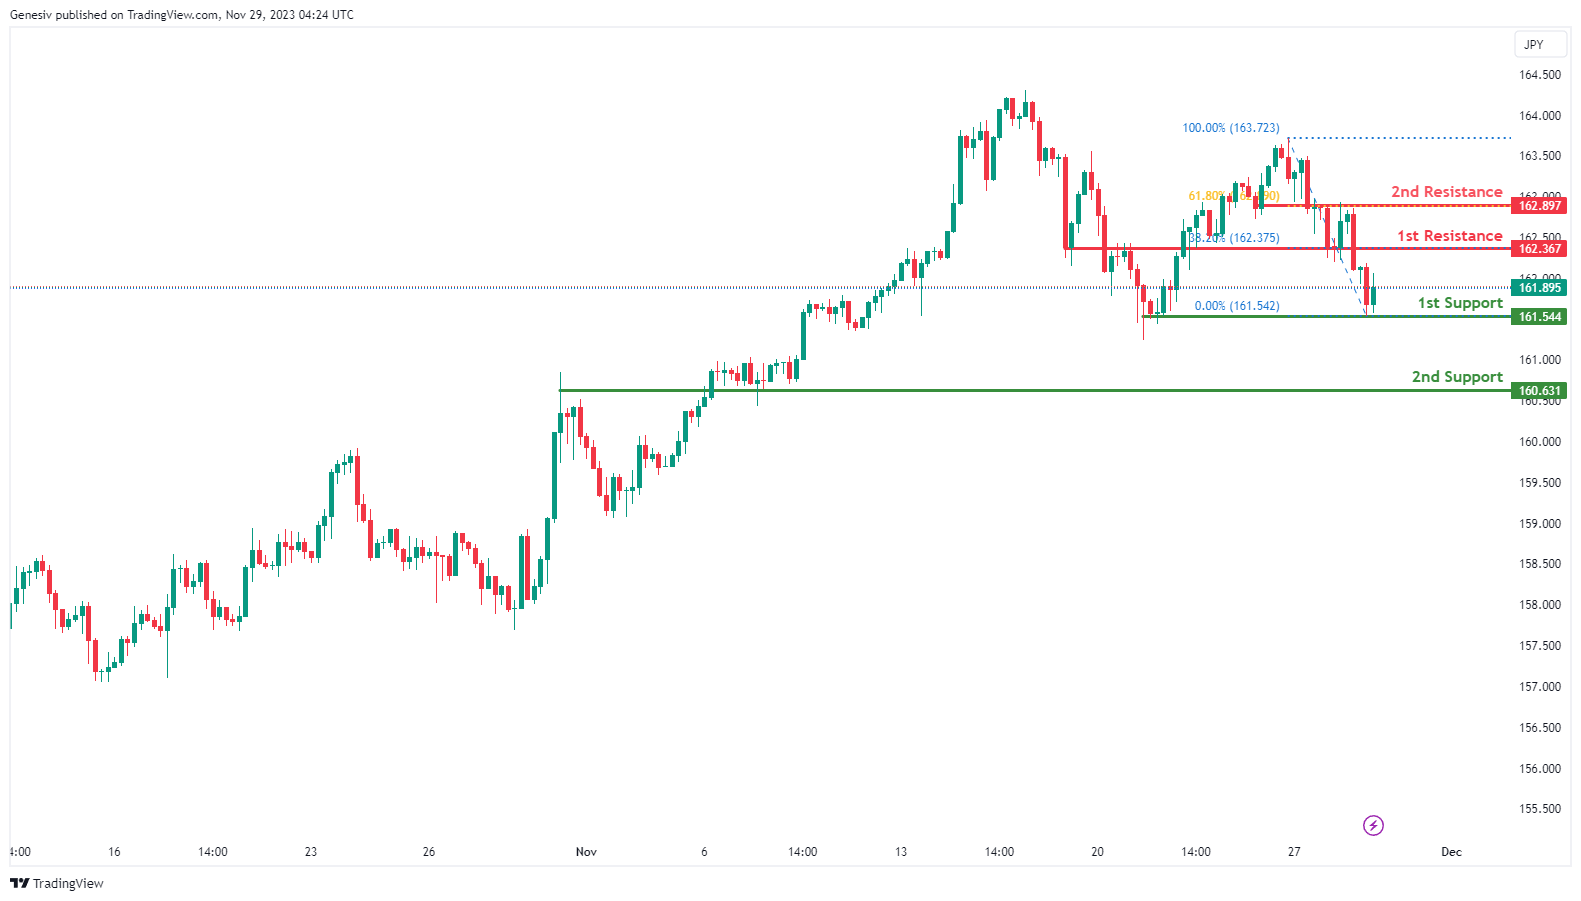
The analyzed instrument is EUR/JPY, and the overall momentum of the chart is currently bullish.
There is a potential for the price to make a bullish continuation towards the 1st resistance.
The 1st support level is identified at 161.54, and its favorable characteristic is attributed to being a multi-swing low support.
The 2nd support level is situated at 160.63, and its favorable aspect is derived from being an overlap support.
On the resistance side, the 1st resistance is positioned at 162.36, and it is considered significant due to being a pullback resistance and coinciding with the 38.20% Fibonacci Retracement.
The 2nd resistance is located at 162.89, and its significance is derived from being an overlap resistance, aligning with the 61.80% Fibonacci Retracement.
EUR/GBP:
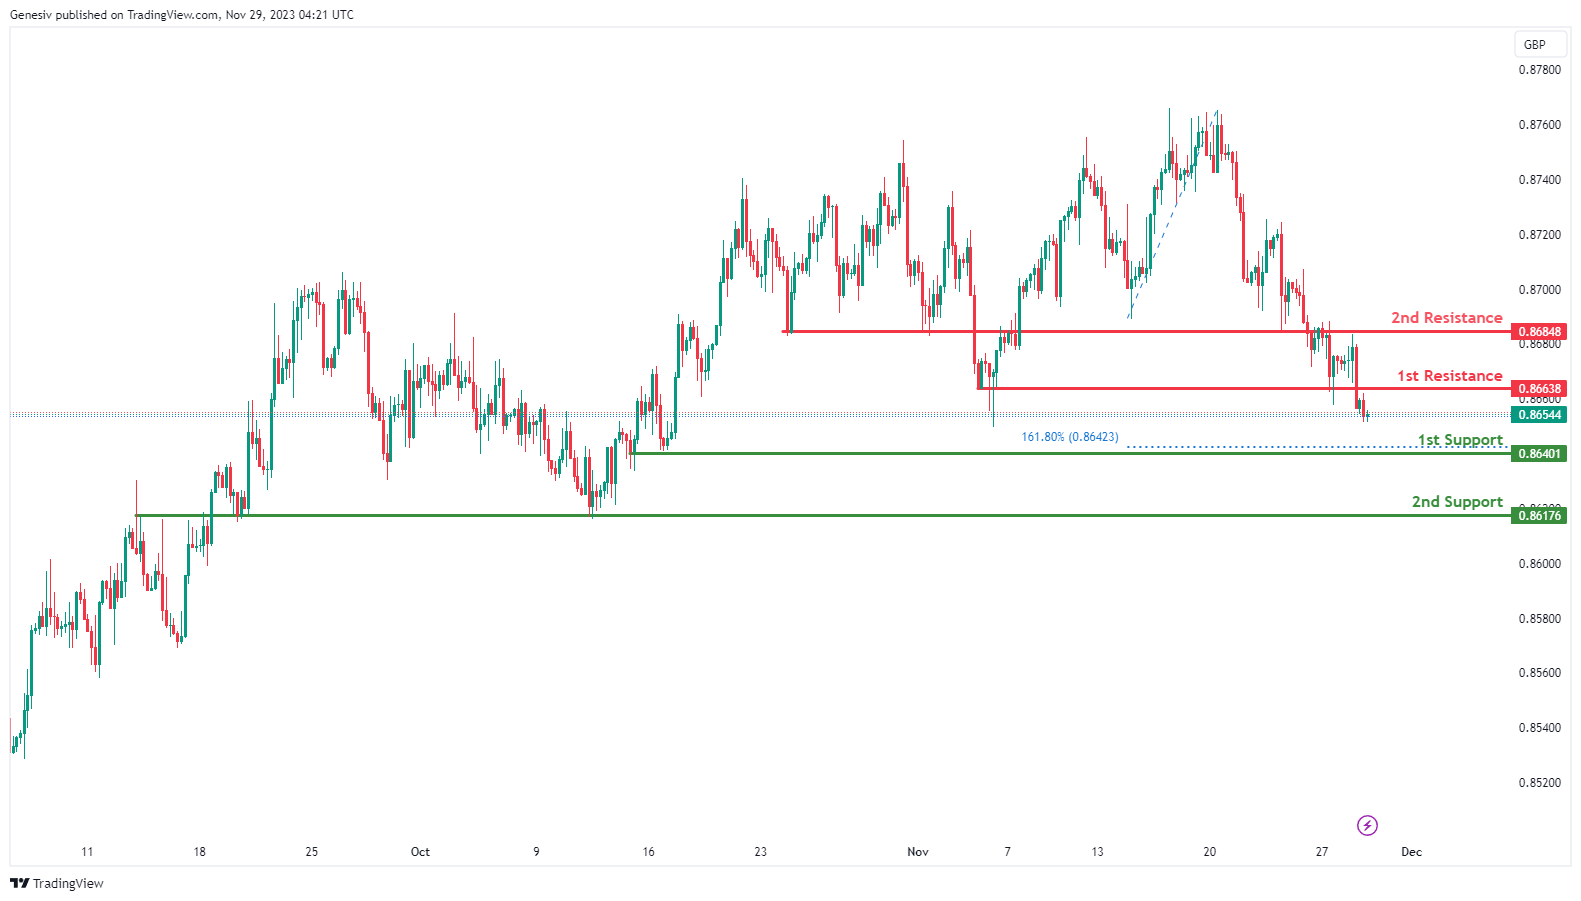
The analyzed instrument is EUR/GBP, and the overall momentum of the chart is currently bearish.
There is a potential for the price to make a bearish continuation towards the 1st support.
The 1st support level is identified at 0.8640, and its favorable characteristics include being a multi-swing low support and coinciding with the 161.80% Fibonacci Extension.
The 2nd support level is situated at 0.8617, and its favorable aspect is derived from being an overlap support.
On the resistance side, the 1st resistance is positioned at 0.8663, and it is considered significant due to being a pullback resistance.
The 2nd resistance is located at 0.8684, and its significance is derived from being an overlap resistance.
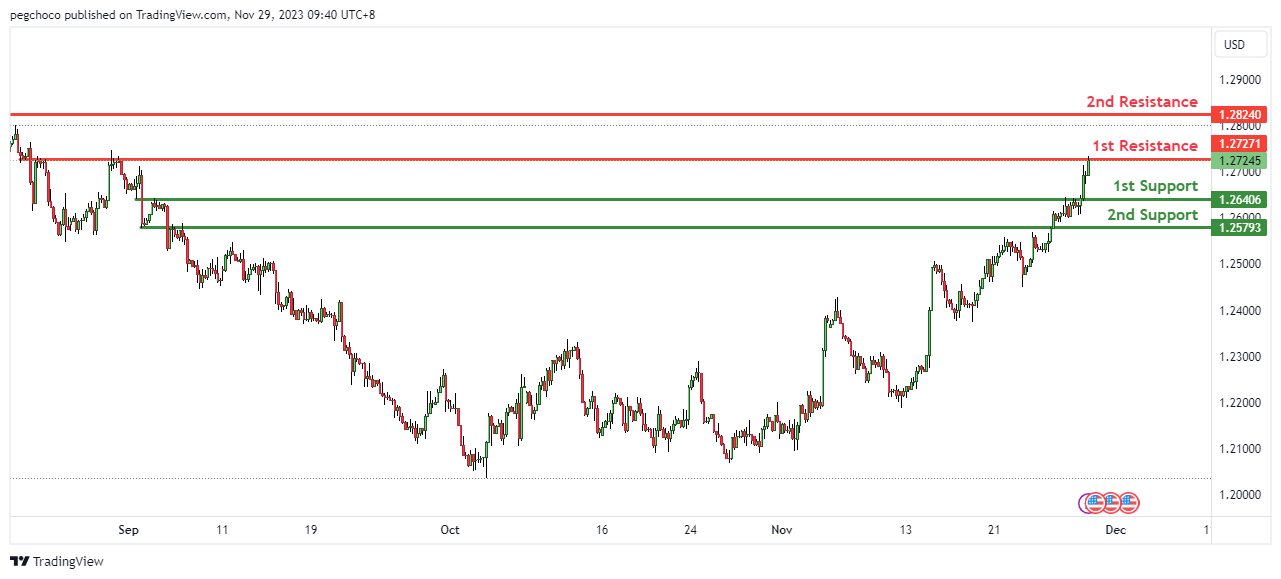
GBP/USD:
The GBP/USD, the overall momentum of the chart is bullish, suggesting a potential upward movement in price. In this scenario, there is a possibility that the price could potentially make a drop further to the 1st support in the short term before bouncing from there and rising to the 1st resistance.
The 1st support at 1.264 is identified as a pullback support. This suggests that it’s a significant level where buying interest may emerge, providing support for the GBP/USD currency pair.
The 2nd support at 1.2579 is another overlap support level. This adds further significance to this support level, indicating it as a potential area where buyers might become active.
On the resistance side,
The 1st resistance at 1.2727 is categorized as an overlap resistance. This suggests that it’s a significant barrier where selling interest could intensify, potentially slowing down the GBP/USD’s upward price movement.
The 2nd resistance at 1.2824 is also noted as an overlap resistance, adding to the potential resistance factors for the currency pair.
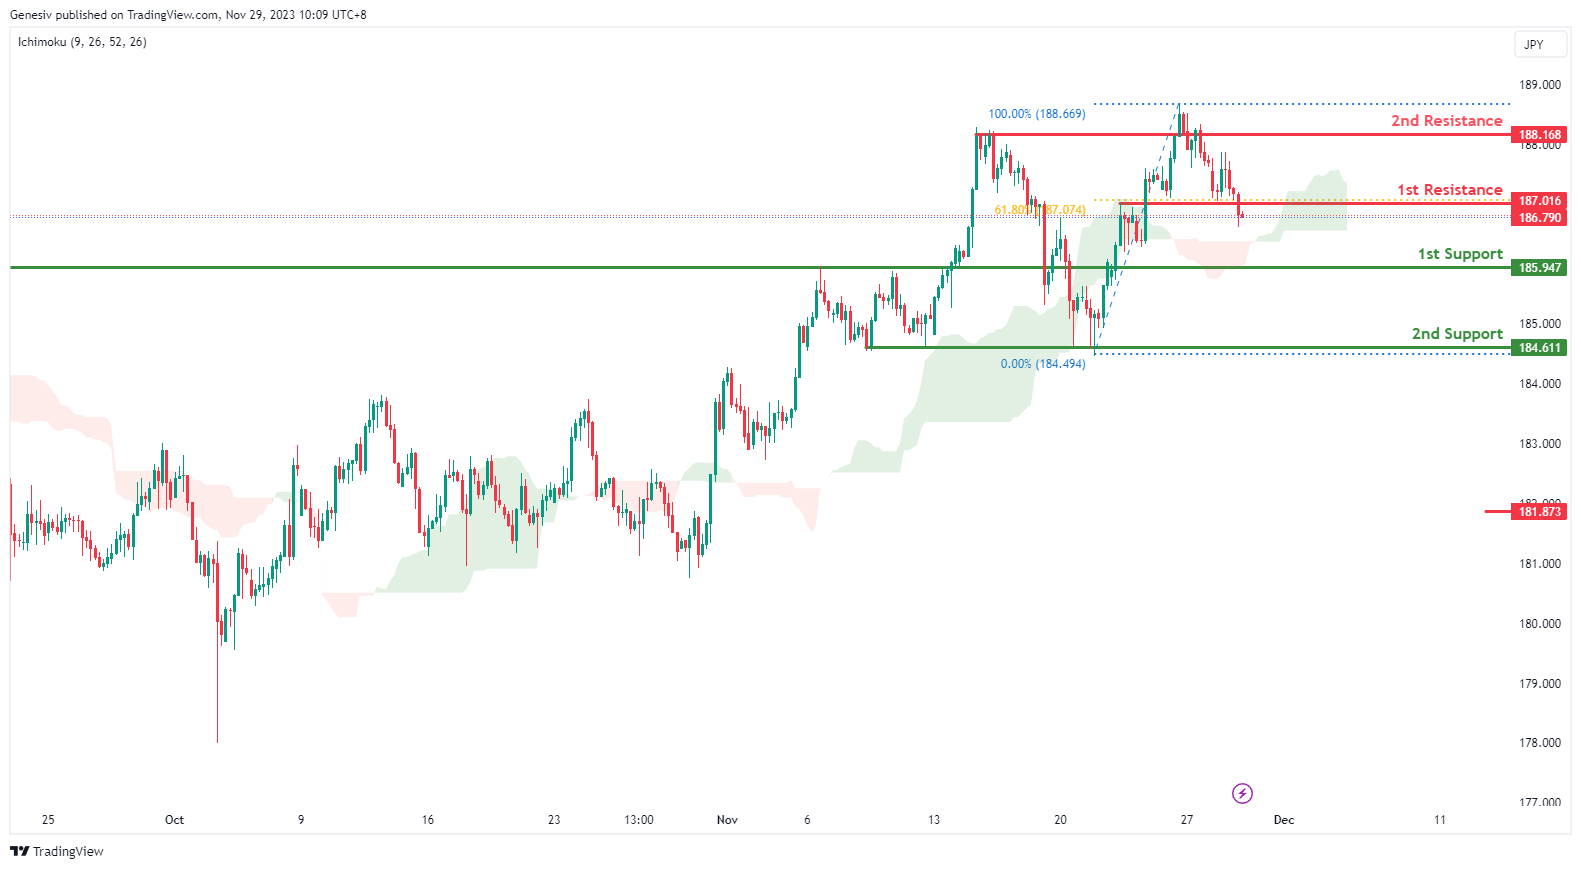
GBP/JPY:
The overall momentum of GBP/JPY is.bearish, indicating a potential continuation of the downward movement in price. There is a possibility that the price could continue its bearish trend towards the 1st support level.
1st support at 185.95: This level is identified as a pullback support, indicating it has the potential to provide a temporary halt to the downward movement as traders may see it as a value area to buy. It’s a level to watch for potential bullish reactions.
2nd support at 184.61: The 2nd support level is another critical area, marked as a multi-swing low support. This suggests that it has previously acted as a significant price level where buyers have shown interest. It’s a stronger support level.
1st resistance at 187.02: The 1st resistance is characterized as a pullback resistance, indicating a point where selling pressure may increase, potentially leading to a reversal or a pause in the downward movement. Additionally, it coincides with the 61.80% Fibonacci retracement level, adding to its significance.
2nd resistance at 188.17: The 2nd resistance is also noted as a pullback resistance, suggesting a level where sellers might be more active in defending their positions.
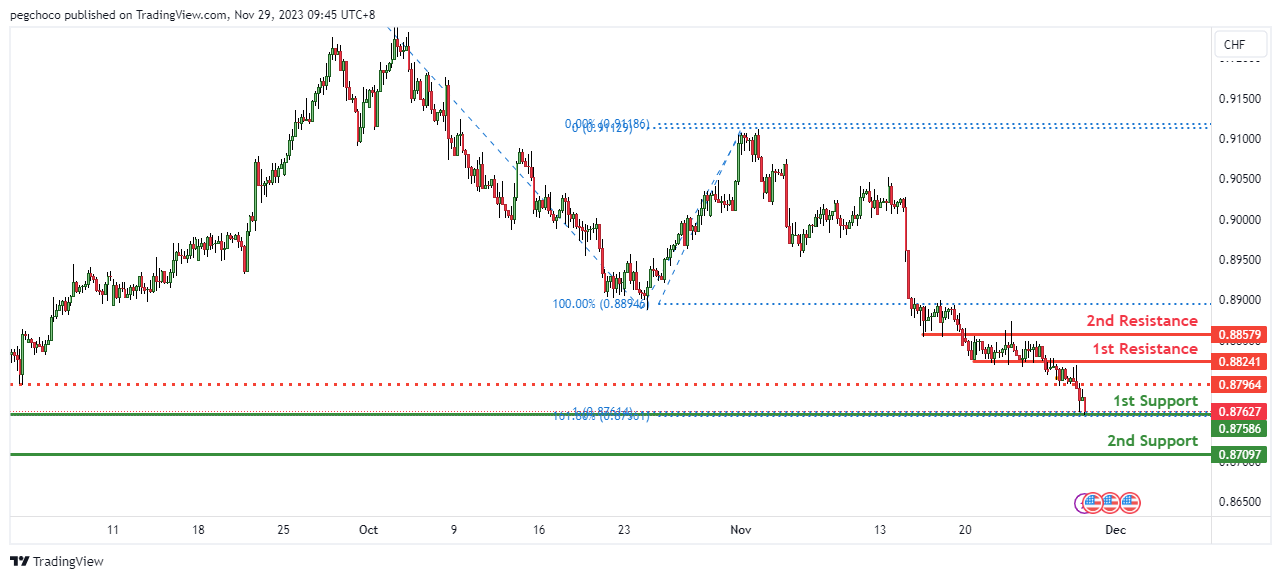
USD/CHF:
USD/CHF, the overall momentum of the chart is bearish, indicating a downward tren, suggesting a potential downward movement in price. In this scenario, there is a possibility that Price could potentially make a rise towards the 1st resistance in the short term before reversing off it and dropping towards the 1st support.
The 1st support at 0.8758 is identified as a multi-swing low support. This suggests that it’s a significant level where buying interest may emerge, supported by the presence of the 161.80% Fibonacci Extension and 100% Fibonacci Projection, indicating Fibonacci confluence.
The 2nd support at 0.8709 is another multi-swing low support level. This adds further significance to this support level, indicating it as a potential area where buyers might become active.
On the resistance side, The 1st resistance at 0.8824 is categorized as an overlap resistance. This suggests that it’s a significant barrier where selling interest could intensify, potentially causing a reversal in the USD/CHF’s upward price movement.
The 2nd resistance at 0.8857 is also noted as an overlap resistance, adding to the potential resistance factors for the currency pair.
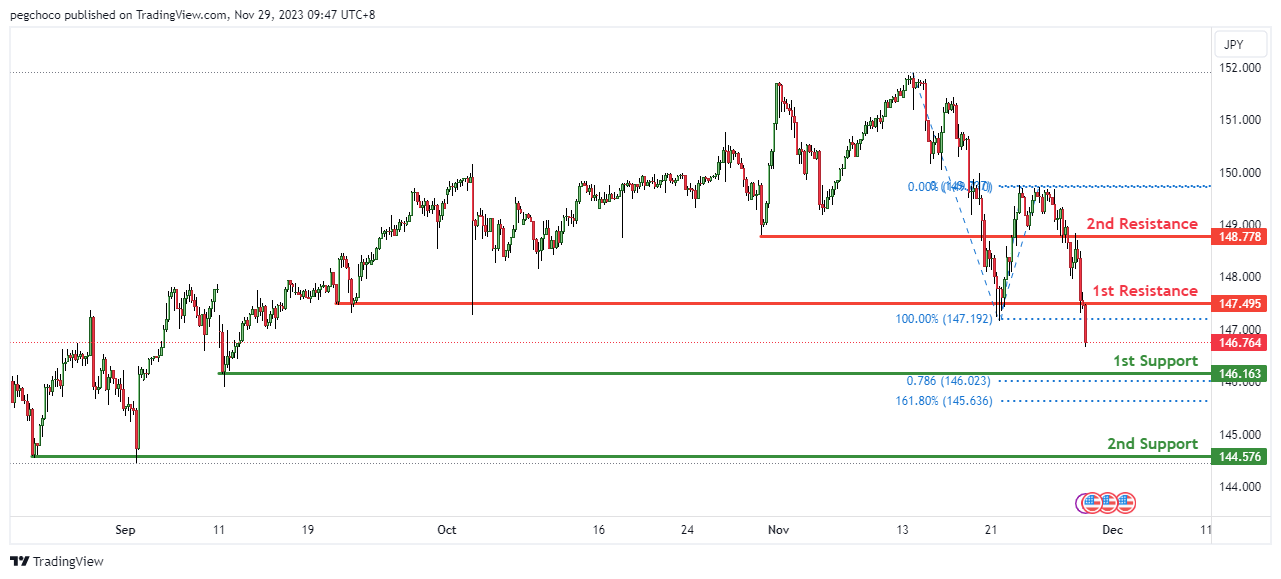
USD/JPY:
The USD/JPY, the overall momentum of the chart is bearish, indicating a downward trend, suggesting a potential downward movement in price. In this scenario, there is a possibility that the price could potentially make a bearish continuation towards the 1st support.
The 1st support at 146.16 is identified as a swing low support, indicating that it’s a significant level where buying interest may emerge. Additionally, the presence of the 78.60% Fibonacci Projection adds further significance to this support level.
The 2nd support at 144.57 is another swing low support level. This adds to the significance of this support, indicating it as a potential area where buyers might become active.
On the resistance side,
The 1st resistance at 147.49 is categorized as a pullback resistance. This implies that it’s a level where selling pressure may increase, potentially acting as a barrier to further upward price movement for USD/JPY.
The 2nd resistance at 148.77 is noted as an overlap resistance. This suggests that it’s another significant level where selling interest could intensify.
USD/CAD:
The USD/CAD, the overall momentum of the chart is currently bearish, suggesting a potential downward movement in price. In this scenario, there is a possibility that the price could potentially make a rise towards the 1st resistance in the short term before reversing off it and dropping towards the 1st support.
The 1st support at 1.3527 is identified as a pullback support. This suggests that it’s a significant level where buying interest may emerge, providing support for the USD/CAD currency pair.
The 2nd support at 1.3426 is another swing low support level. This adds further significance to this support level, indicating it as a potential area where buyers might become active.
On the resistance side, The 1st resistance at 1.3607 is categorized as a pullback resistance. This implies that it’s a level where selling pressure may increase, acting as a potential barrier to further upward price movement for USD/CAD.
The 2nd resistance at 1.3663 is noted as an overlap resistance, suggesting it’s another significant level where selling interest could intensify.
Additionally, there is an intermediate resistance at 1.3536, which is also identified as a pullback resistance, reinforcing the potential resistance factors for the currency pair.

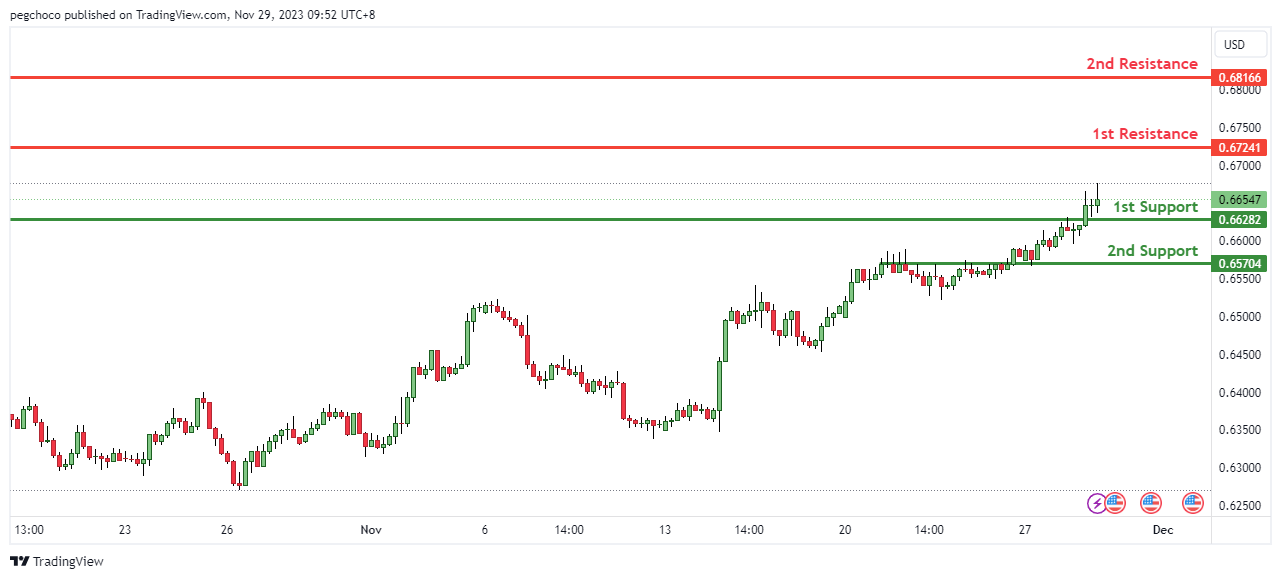
AUD/USD:
AUD/USD, the overall momentum of the chart is currently bullish, suggesting a potential upward movement in price. In this scenario, there is a possibility that the price could potentially make a bullish continuation towards the 1st resistance.
The 1st support at 0.6628 is identified as an overlap support. This suggests that it’s a significant level where buying interest may emerge, providing support for the AUD/USD currency pair.
The 2nd support at 0.6570 is another overlap support level. This adds further significance to this support level, indicating it as a potential area where buyers might become active.
On the resistance side, The 1st resistance at 0.6724 is categorized as an overlap resistance. This suggests that it’s a significant barrier where selling interest could intensify, potentially limiting the upward movement for AUD/USD.
The 2nd resistance at 0.6816 is noted as a swing high resistance. This adds to the potential resistance factors for the currency pair.
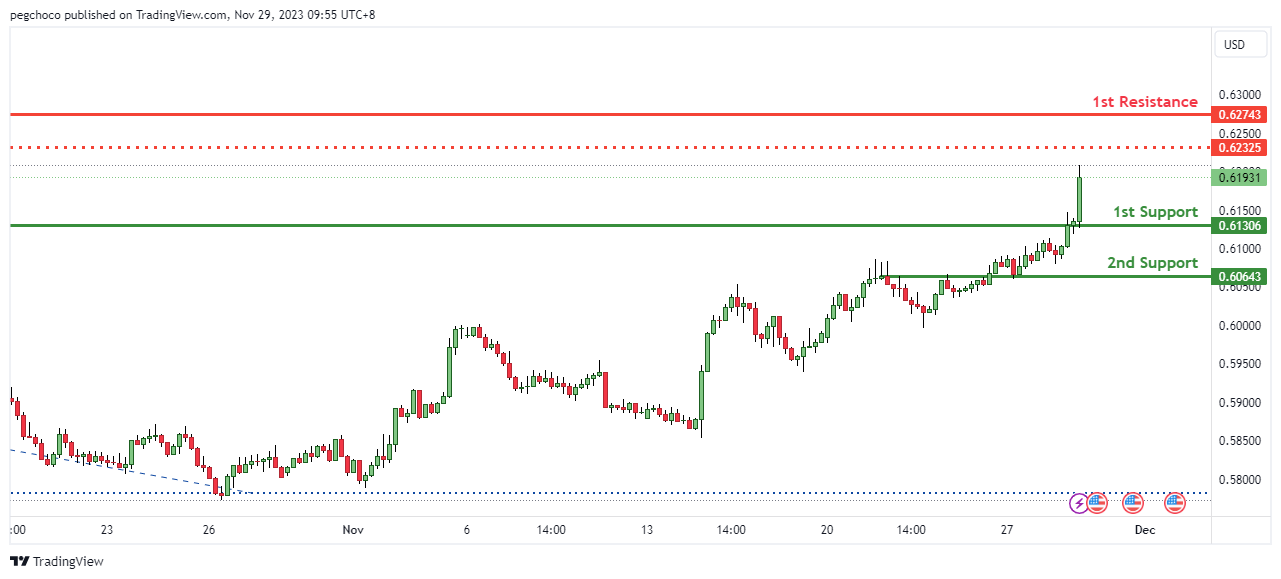
NZD/USD
The NZD/USD, the overall momentum of the chart is currently bullish, indicating a potential upward movement in the price. In this scenario, there is a possibility that price could potentially make a bullish continuation towards the 1st resistance.
The 1st support at 0.6130 is identified as a pullback support. This suggests that it’s a significant level where buying interest may emerge, providing support for the NZD/USD currency pair.
The 2nd support at 0.6064 is another overlap support level. This adds further significance to this support level, indicating it as a potential area where buyers might become active.
On the resistance side, The 1st resistance at 0.6274 is categorized as a swing high resistance, and it also coincides with the 78.60% Fibonacci Retracement level. This dual significance suggests that it’s a significant barrier where selling interest could intensify, potentially limiting the upward movement for NZD/USD.
Additionally, there is an intermediate resistance at 0.6232, which is an overlap resistance, further reinforcing the potential resistance factors for the currency pair.
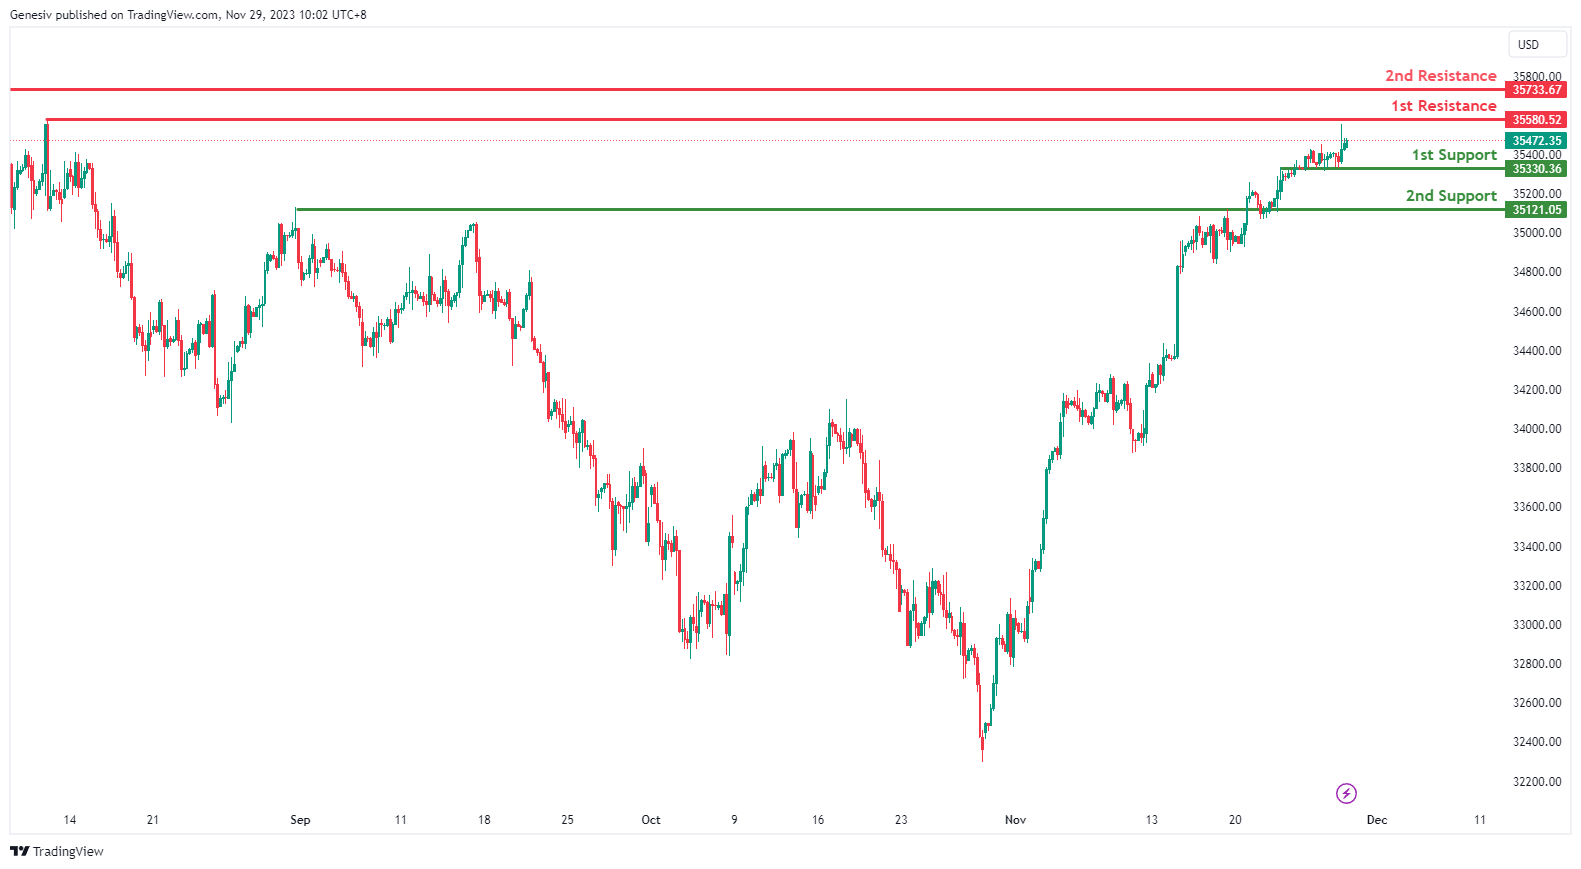
DJ30:
The DJ30,the momentum of the chart is bullish, indicating a potential continuation of the upward movement in price. In this scenario, there is a possibility that the price could experience a bullish bounce off the 1st support level and head towards the 1st resistance.
1st support at 35330.36: This level is identified as an overlap support, suggesting that it has previously acted as a significant price level where buyers have shown interest. It’s a level to watch for potential bullish reactions and a potential bounce.
2nd support at 35121.05: The 2nd support level is marked as pullback support, indicating that it may provide support during retracements. It’s another level where buyers might be interested.
Intermediate resistance at 35580.52: This level is characterized as pullback resistance, suggesting that it could be a point where selling pressure may increase, potentially leading to a temporary halt or retracement in the upward movement.
2nd resistance at 35733.67: The 2nd resistance is also noted as pullback resistance, indicating that it’s a level where sellers might be more active in defending their positions.
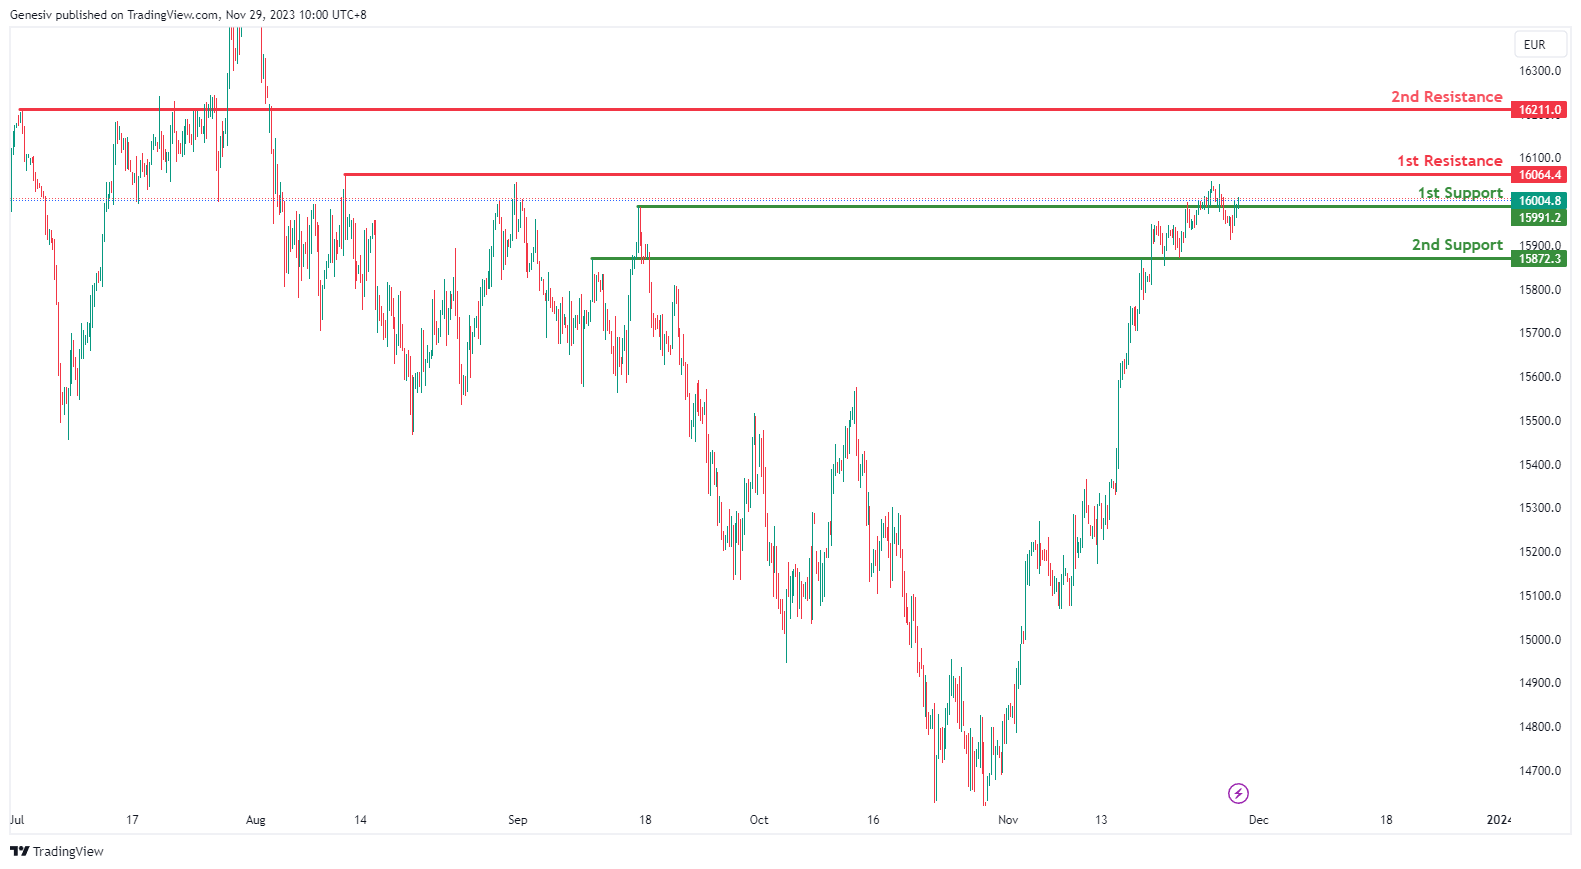
GER40:
The GER40 overall momentum is overall bearish, indicating a potential continuation of the downward movement in price. There is a possibility that the price could experience a bearish continuation towards the 1st support.
1st support at 15991.2: This level is identified as an overlap support, suggesting that it has previously acted as a significant price level where buyers have shown interest. It’s a level to watch for potential bearish reactions and a potential continuation of the downtrend.
2nd support at 15872.3: The 2nd support level is marked as an overlap support as well, indicating its importance as a potential area of buying interest. Traders may anticipate potential support around this level.
1st resistance at 16064.4: This level is characterized as pullback resistance, suggesting that it could be a point where selling pressure may increase, potentially leading to a halt or retracement in the downward movement.
2nd resistance at 16211.0: The 2nd resistance is also noted as pullback resistance, indicating that it’s a level where sellers might be more active in defending their positions.
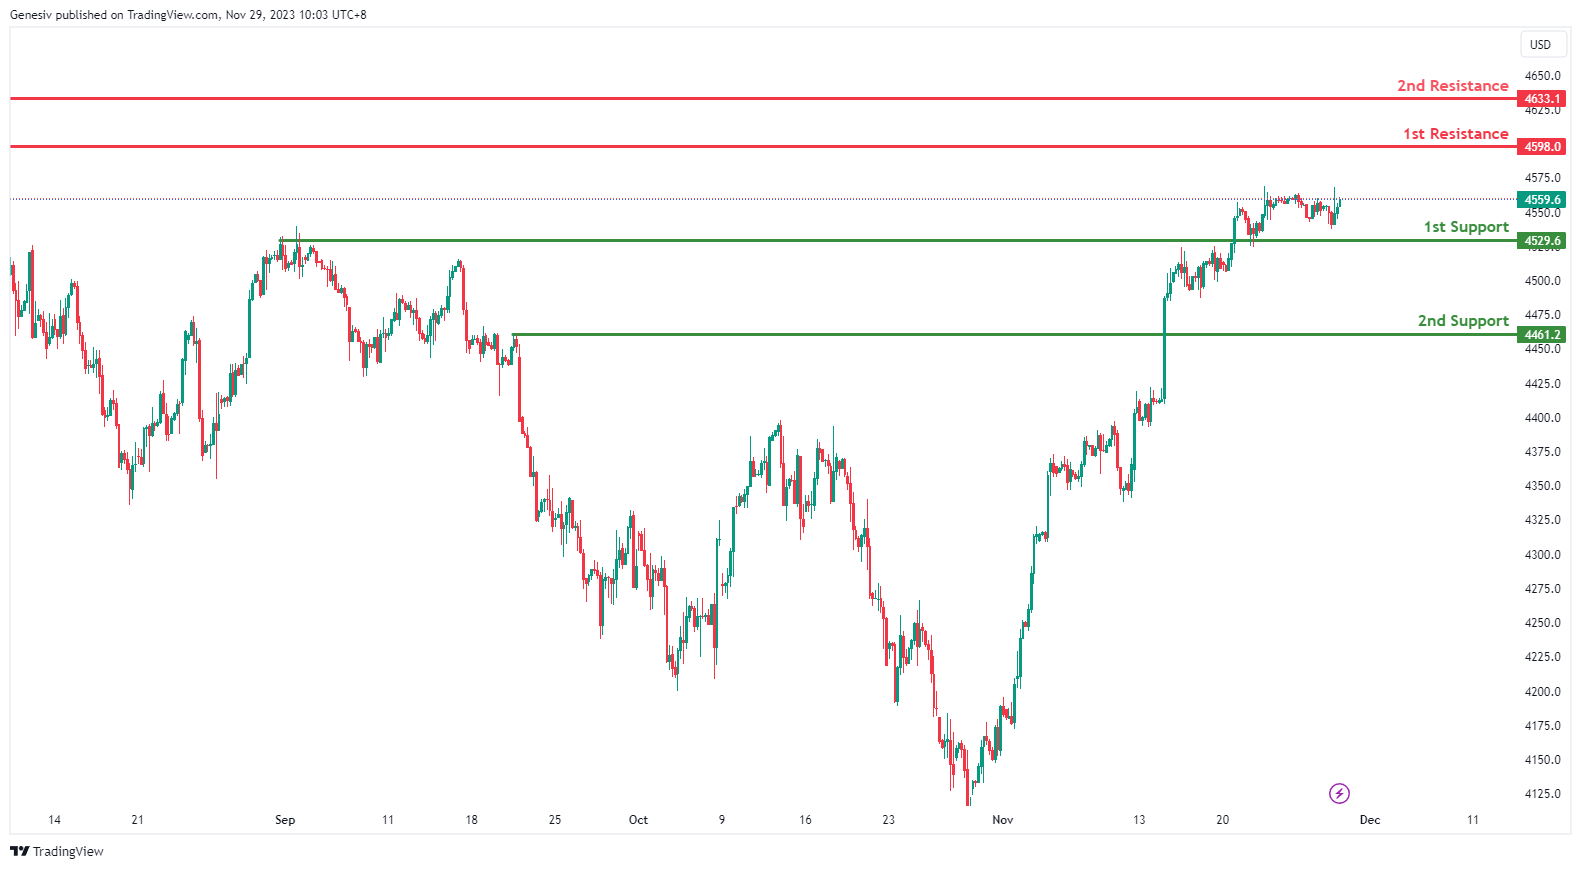
`US500:
The overall momentum of US500 is bullish. The price could potentially continue its bullish movement towards the 1st resistance level.
1st support at 4529.6: This level is identified as an overlap support, suggesting that it has previously acted as a significant price level where buyers have shown interest. It’s a level to watch for potential bullish reactions and a potential continuation of the uptrend.
2nd support at 4461.2: The 2nd support level is marked as a pullback support, indicating its importance as a potential area of buying interest. Traders may anticipate potential support around this level.
1st resistance at 4598.0: This level is characterized as pullback resistance, suggesting that it could be a point where selling pressure may increase, potentially leading to a pause or retracement in the upward movement.
2nd resistance at 4633.1: The 2nd resistance is also noted as pullback resistance, indicating that it’s a level where sellers might be more active in defending their positions.
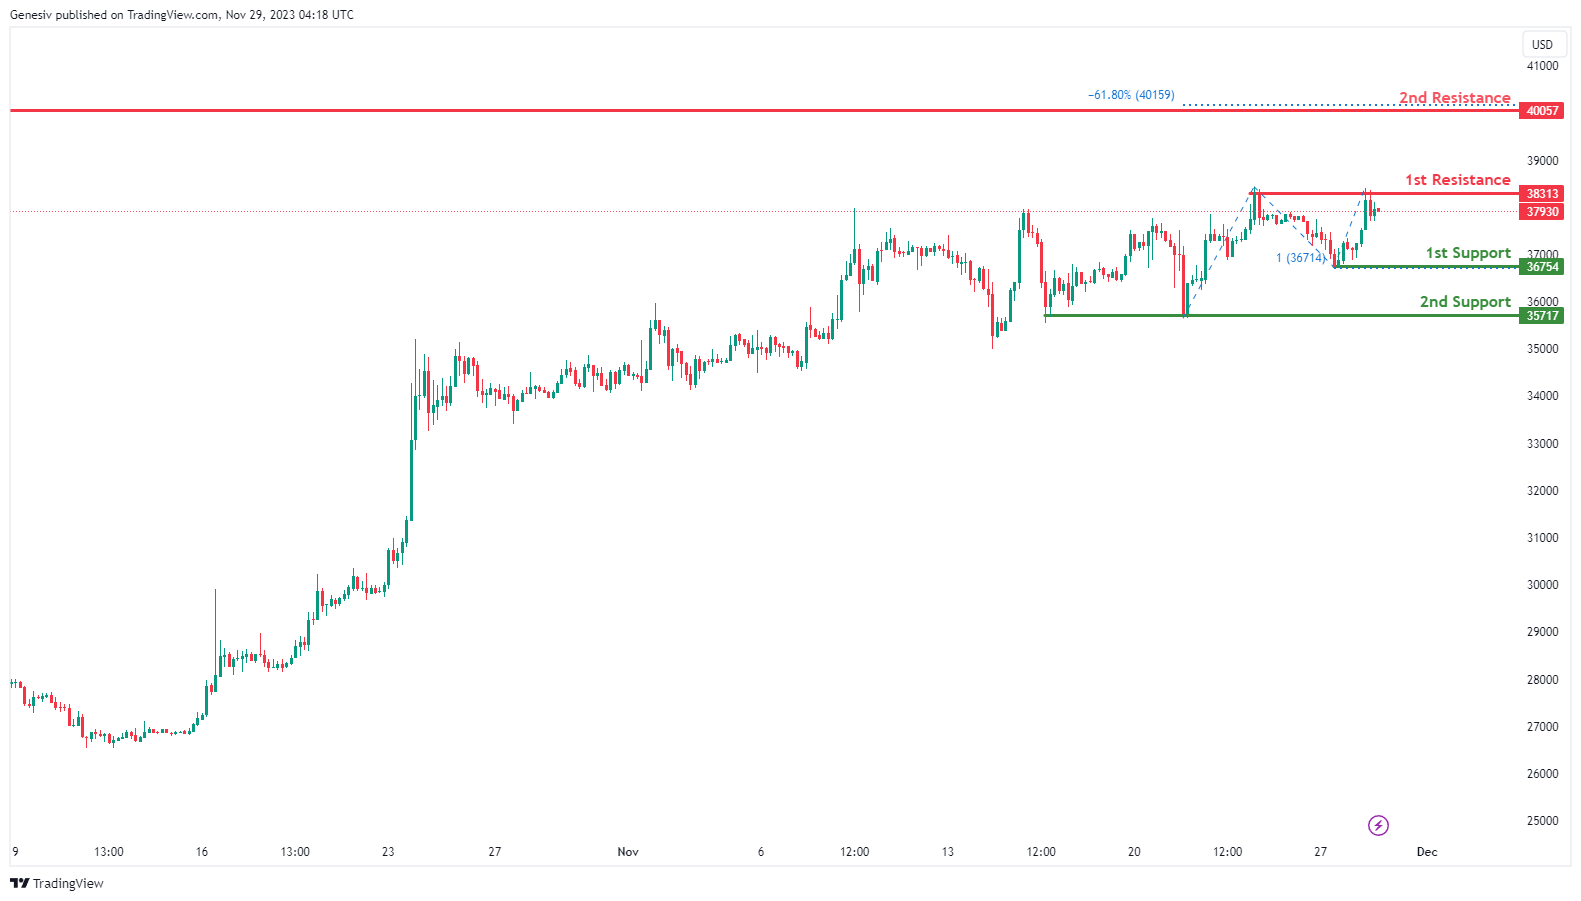
BTC/USD:
The analyzed instrument is BTC/USD, and the overall momentum of the chart is currently bearish.
There is a potential for the price to make a bearish reaction off the 1st resistance and drop to the 1st support.
The 1st support level is identified at 36754, and its favorable characteristic is attributed to being a swing low support, coinciding with the 100% Fibonacci Projection.
The 2nd support level is situated at 35717, and its favorable aspect is derived from being a multi-swing low support.
On the resistance side, the 1st resistance is positioned at 38313, and it is considered significant due to being a multi-swing high resistance.
The 2nd resistance is located at 39878, and its significance is derived from being a swing high resistance, aligning with the -61.8% Fibonacci Expansion.
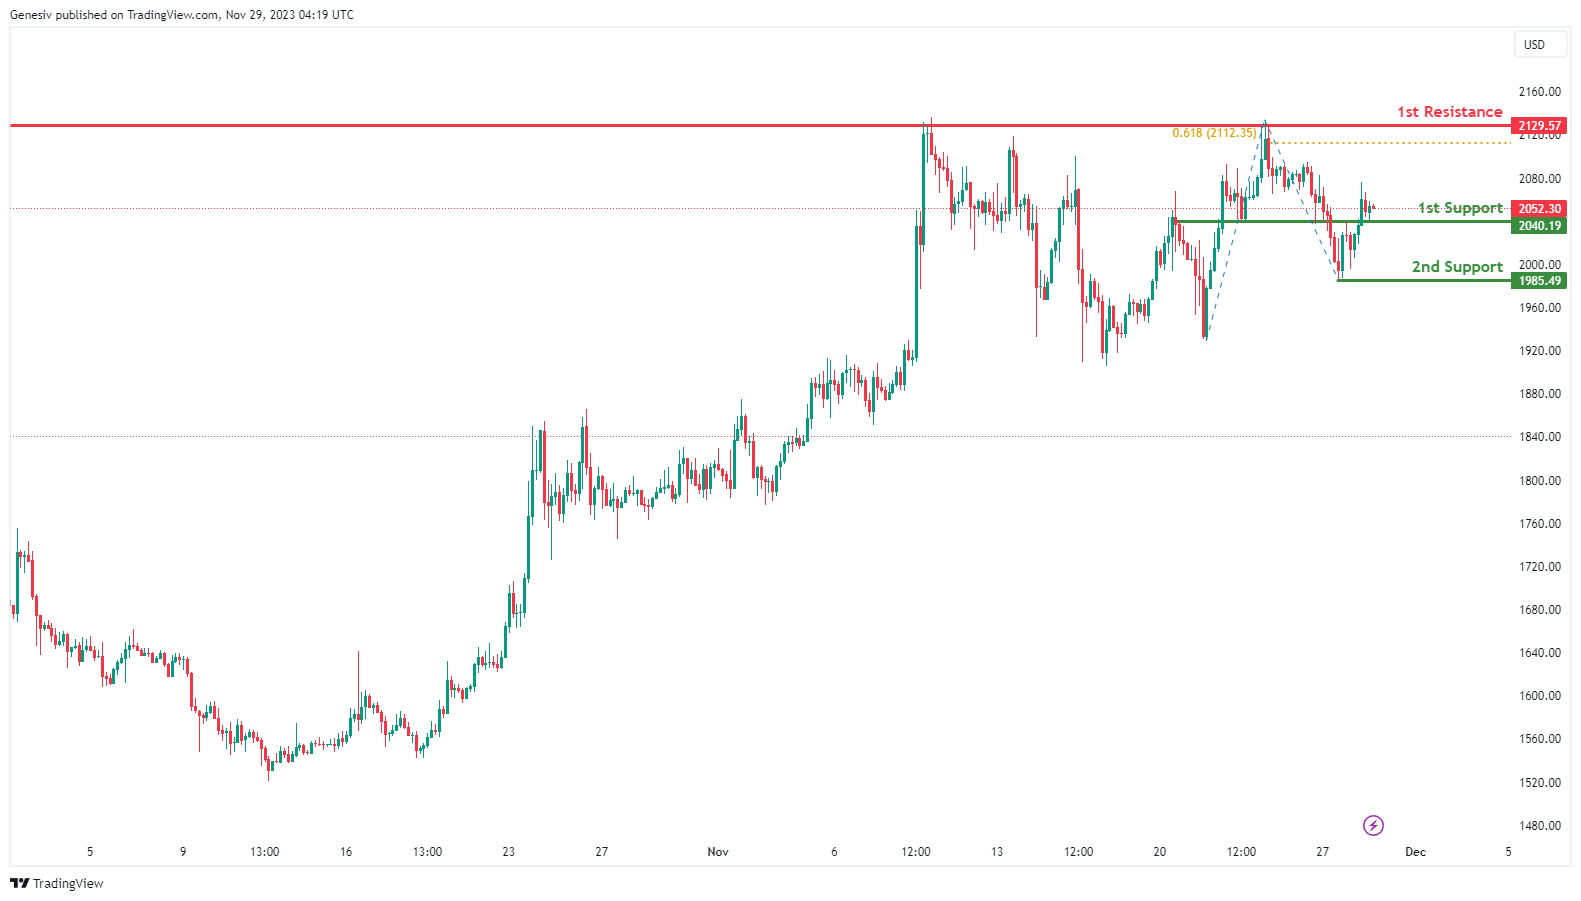
ETH/USD:
The analyzed instrument is ETH/USD, and the overall momentum of the chart is currently bullish.
There is a potential for the price to make a bullish bounce off the 1st support and head towards the 1st resistance.
The 1st support level is identified at 2040.19, and its favorable characteristic is attributed to being an overlap support.
The 2nd support level is situated at 1985.49, and its favorable aspect is derived from being a swing low support.
On the resistance side, the 1st resistance is positioned at 2129.57, and it is considered significant due to being a multi-swing high resistance, coinciding with the 61.80% Fibonacci Projection.
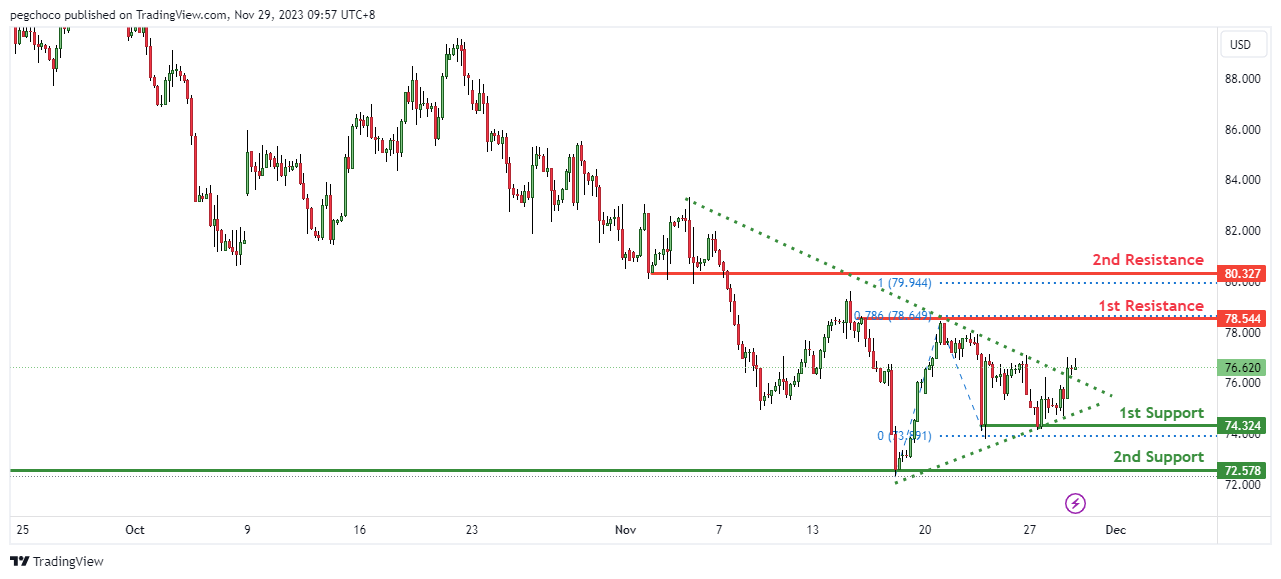
WTI/USD:
The WTI (West Texas Intermediate) crude oil, the overall momentum of the chart is bullishl, price broke above a descending resistance line, triggering a potential bullish move. Price could potentially make a bullish continuation towards the 1st resistance.
The 1st support at 74.32 is identified as a multi-swing low support. This suggests that it’s a significant level where buying interest may emerge, providing support for WTI crude oil.
The 2nd support at 72.57 is another overlap support level. This adds further significance to this support level, indicating it as a potential area where buyers might become active.
On the resistance side, The 1st resistance at 78.54 is categorized as a swing high resistance, and it also coincides with the 78.60% Fibonacci Projection. This dual significance suggests that it’s a significant barrier where selling interest could intensify, potentially limiting the upward movement for WTI crude oil.
The 2nd resistance at 80.32 is noted as a pullback resistance, and it is associated with the 100% Fibonacci Projection. This adds to the potential resistance factors for the commodity.
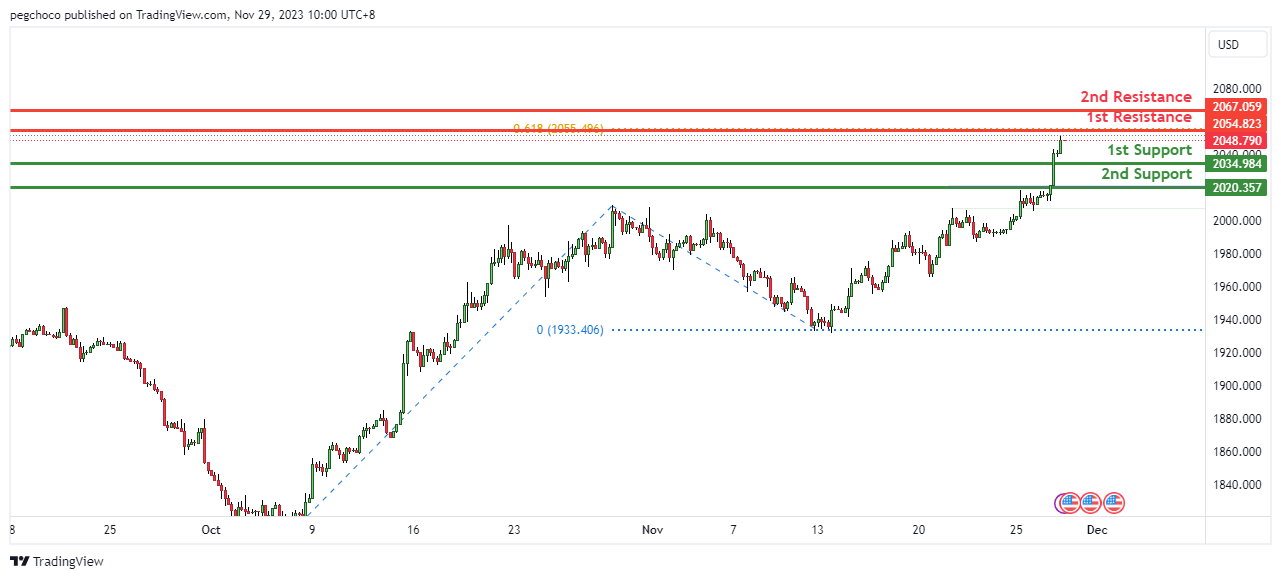
XAU/USD (GOLD):
The XAU/USD, the overall momentum of the chart is bullishl,Price could potentially make a bullish bounce off the 1st support and head towards the 1st resistance.
The 1st support at 2034.98 is identified as a pullback support. This suggests that it’s a significant level where buying interest may emerge, potentially leading to a bullish bounce for XAUUSD.
The 2nd support at 2020.35 is another pullback support level. This adds further significance to this support level, indicating it as another potential area where buyers might become active.
On the resistance side, The 1st resistance at 2054.82 is categorized as a swing high resistance, and it also coincides with the 61.80% Fibonacci Projection. This dual significance suggests that it’s a significant barrier where selling interest could intensify, potentially limiting the upward movement for XAUUSD.
The 2nd resistance at 2067.05 is noted as a multi-swing high resistance, indicating another potential obstacle for the precious metal’s upward price movement.
The accuracy, completeness and timeliness of the information contained on this site cannot be guaranteed. IC Markets does not warranty, guarantee or make any representations, or assume any liability regarding financial results based on the use of the information in the site.
News, views, opinions, recommendations and other information obtained from sources outside of www.icmarkets.com, used in this site are believed to be reliable, but we cannot guarantee their accuracy or completeness. All such information is subject to change at any time without notice. IC Markets assumes no responsibility for the content of any linked site.
The fact that such links may exist does not indicate approval or endorsement of any material contained on any linked site. IC Markets is not liable for any harm caused by the transmission, through accessing the services or information on this site, of a computer virus, or other computer code or programming device that might be used to access, delete, damage, disable, disrupt or otherwise impede in any manner, the operation of the site or of any user’s software, hardware, data or property.


