
EUR/USD:
In recent sessions, the market witnessed the euro cede further ground to the dollar, down 0.28% on the day. Better-than-expected consumer confidence numbers out of the US provided fresh impetus, with the greenback now eyeing 98.00 once again (DXY).
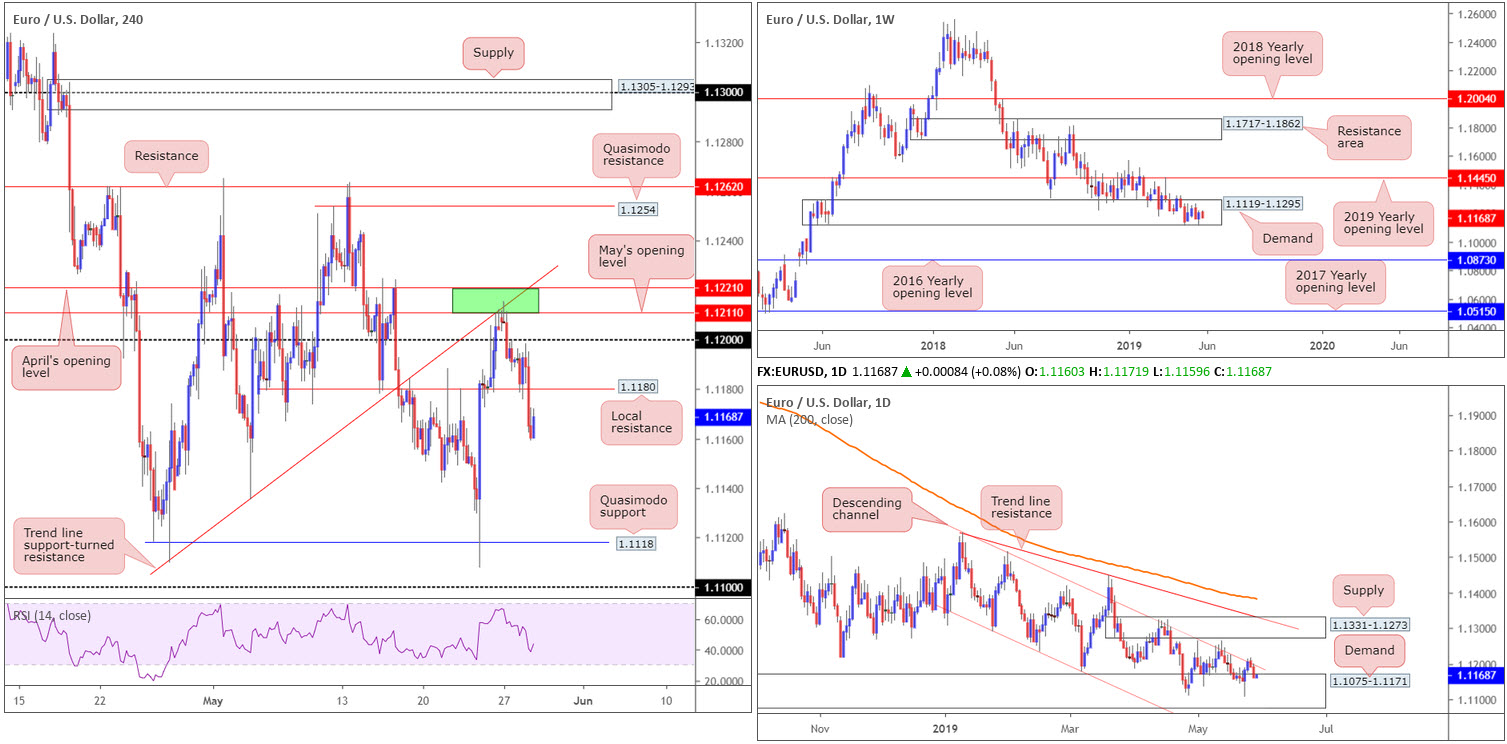
The recent EUR/USD decline had the H4 candles penetrate local support at 1.1180 (now acting resistance), potentially unlocking downside in the direction of Quasimodo support at 1.1118. Well done to any of our readers who managed to hold their short position from 1.1221/1.1211 (green) – superb risk/reward trade.
While H4 players may be gearing up for another wave of selling, higher-timeframe structure suggests buyers still have a hand in this fight, despite the overall trend facing a southerly bearing.
In terms of the weekly timeframe’s setting, the buyers and sellers remain warring for position within the lower limits of a long-standing demand at 1.1119-1.1295. Upside from this point shows room for extension to as far north as the 2019 yearly opening level at 1.1445, whereas a move lower has the 2016 yearly opening level at 1.0873 in the firing range. A closer reading of price action on the daily timeframe also reveals demand at 1.1075-1.1171 (the next downside target on the daily scale).
Areas of consideration:
Although a sell from the underside of 1.1180 is appealing on the H4 timeframe, the threat of higher-timeframe buyers entering the fray may be too much for many traders to handle.
Those who remain interested in 1.1180, however, may want to consider waiting for some form of additional confirmation to take shape before pulling the trigger. This could be anything from a simple bearish candlestick formation – think shooting star pattern – an MA crossover or even drilling down to the lower timeframes and attempting to base a sell on local structure.
Today’s data points: German Buba President Weidmann Speaks.
GBP/USD:
Outlook unchanged.
GBP/USD movement concluded Tuesday in negative territory, down 0.21%. According to research, downside was capped as UK Chancellor Hammond reminded us a no-deal outcome remains unlikely.
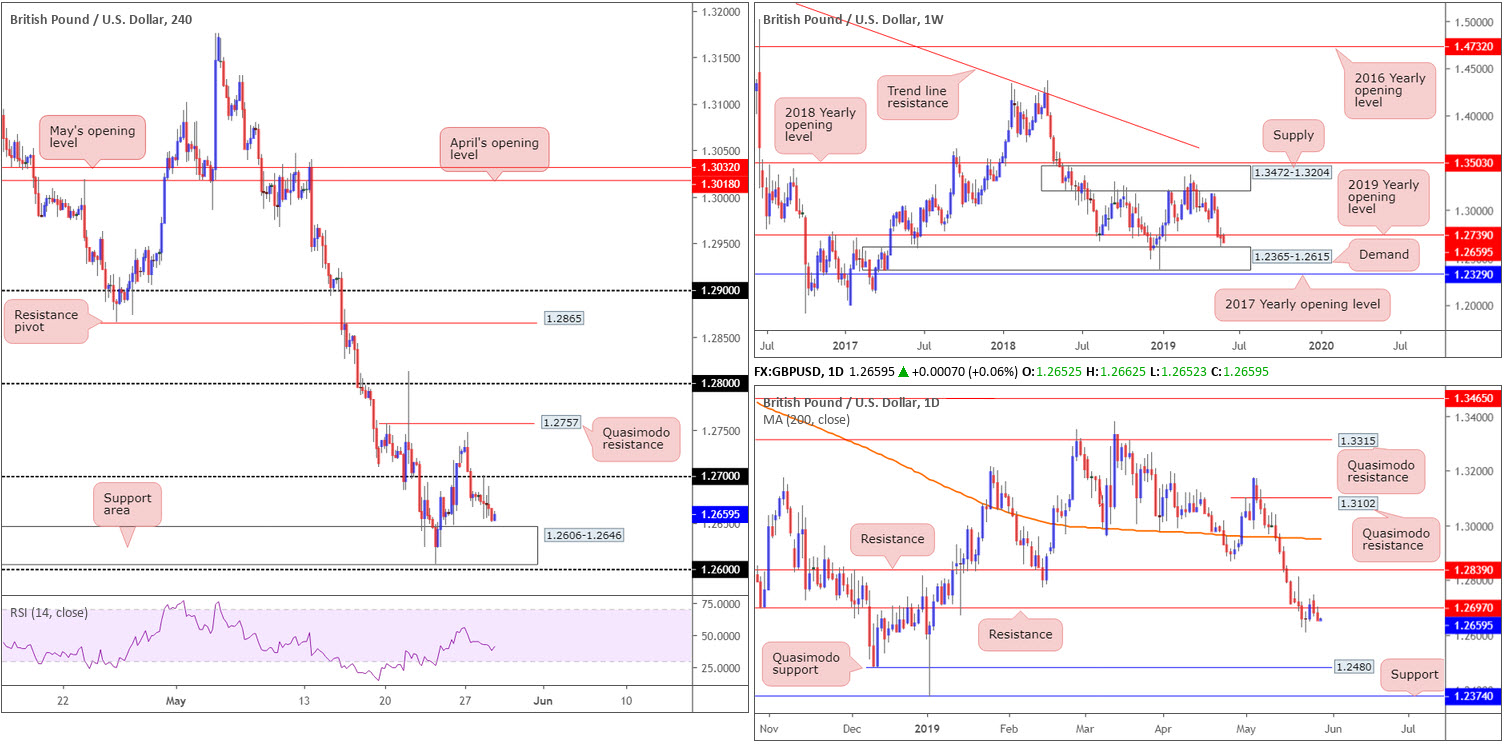
Having seen the 1.27 handle serve as resistance in recent trading on the H4 chart, the next downside objective remains nearby at a support area coming in from 1.2606-1.2646, shadowed closely by the 1.26 handle.
On a wider setting, weekly price is holding firm beneath its 2019 yearly opening level at 1.2739 and has eyes on demand seen close by at 1.2365-1.2615. Daily flow, however, extended its position beneath support at 1.2697 (now acting resistance) and appears poised to make a run for Quasimodo support priced in at 1.2480.
Areas of consideration:
Although some traders are likely looking to buy the H4 support area mentioned above at 1.2606-1.2646, given it has a connection with the top edge of weekly demand at 1.2365-1.2615, a fakeout through this area to the nearby 1.26 handle is also a possibility. This is likely due to diminished buying power from 1.2606-1.2646 from last week’s attempt at an advance (23rd).
For that reason, conservative traders may wish to adopt a patient approach and see if the candles are drawn to 1.26 before pulling the trigger. An ideal scenario would be for H4 price to print a hammer formation off 1.26, thus confirming buyer intent and simultaneously providing traders a structure to base entry and risk levels from.
Today’s data points: Limited.
AUD/USD:
Outlook unchanged.
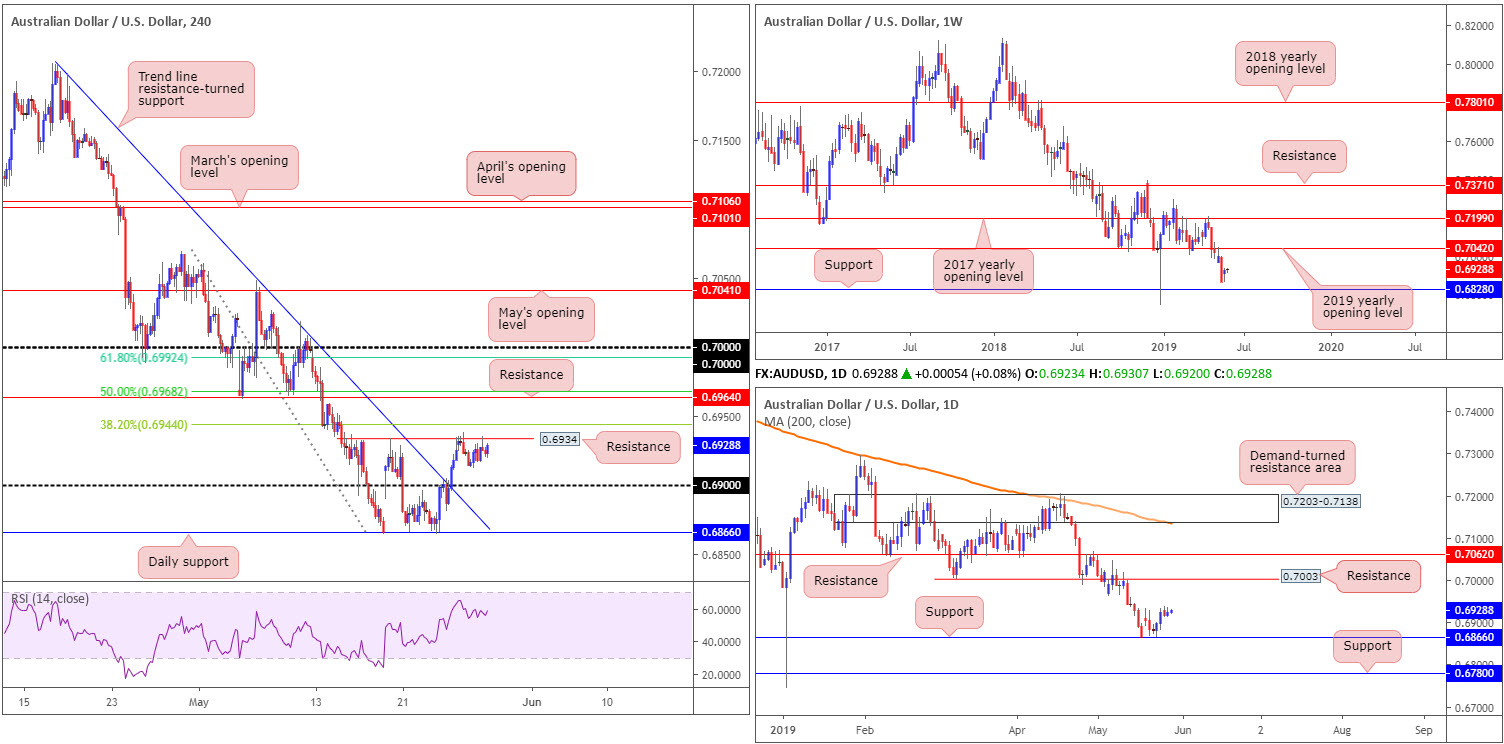
Despite the US dollar index making headway towards 98.00, the commodity-linked currency struggled to pin down short-term direction Tuesday, largely remaining within the confines of Monday’s range 0.6938/0.6913.
Technically, the H4 candles remain capped at a ceiling off resistance off 0.6934, with the next downside target on this scale set to emerge around the 0.69 handle. Above 0.6934, the H4 has a number of resistances still worthy of note:
- The 38.2% Fibonacci resistance at 0.6944.
- The 50.0% resistance value at 0.6968, which happens to align with resistance at 0.6964.
- The 61.8% Fibonacci resistance value at 0.6992 – lines up nicely with the key figure 0.70. Note also we have daily resistance offering a potential ceiling close by at 0.7003.
Structure on the higher timeframes show weekly price has eyes on 0.6828 as possible support, and resistance by way of the 2019 yearly opening level at 0.7042.
Focus on the daily timeframe has now shifted to support establishing from the 0.6866 neighbourhood, with little in the way of resistance seen until connecting with 0.7003 (highlighted above). Beyond the two said levels, we have another layer of support residing around 0.6780 and an additional film of resistance at 0.7062.
Areas of consideration:
On account of the overall technical picture, the key figure 0.70 on the H4 timeframe remains of interest as potential resistance. Due to its neighbouring confluence (see above), active sellers likely inhabit this region. However, waiting for additional confirmation (traders then have the option of using the selected confirmation technique to structure entry/risk levels) is recommended before pulling the trigger, since there’s a chance weekly action may attempt an approach towards the 2019 yearly opening level set 40 points above 0.70 at 0.7042.
Shorter-term traders, nonetheless, may find use in the 0.69 handle as support, owing to the clear run north visible on the bigger picture. Traders interested in 0.69 as a buy are advised not to overlook the noted H4 resistances. In fact, the levels can be used to trail market action towards 0.70. Similarly, it is also advisable to wait and see how H4 action behaves off 0.69 before entering long as round numbers are prone to fakeouts (a H4 or H1 bullish candlestick formation would likely suffice).
Today’s data points: Limited.
USD/JPY:
On similar footing to Monday’s segment, Tuesday observed limited price change, down 0.12%.
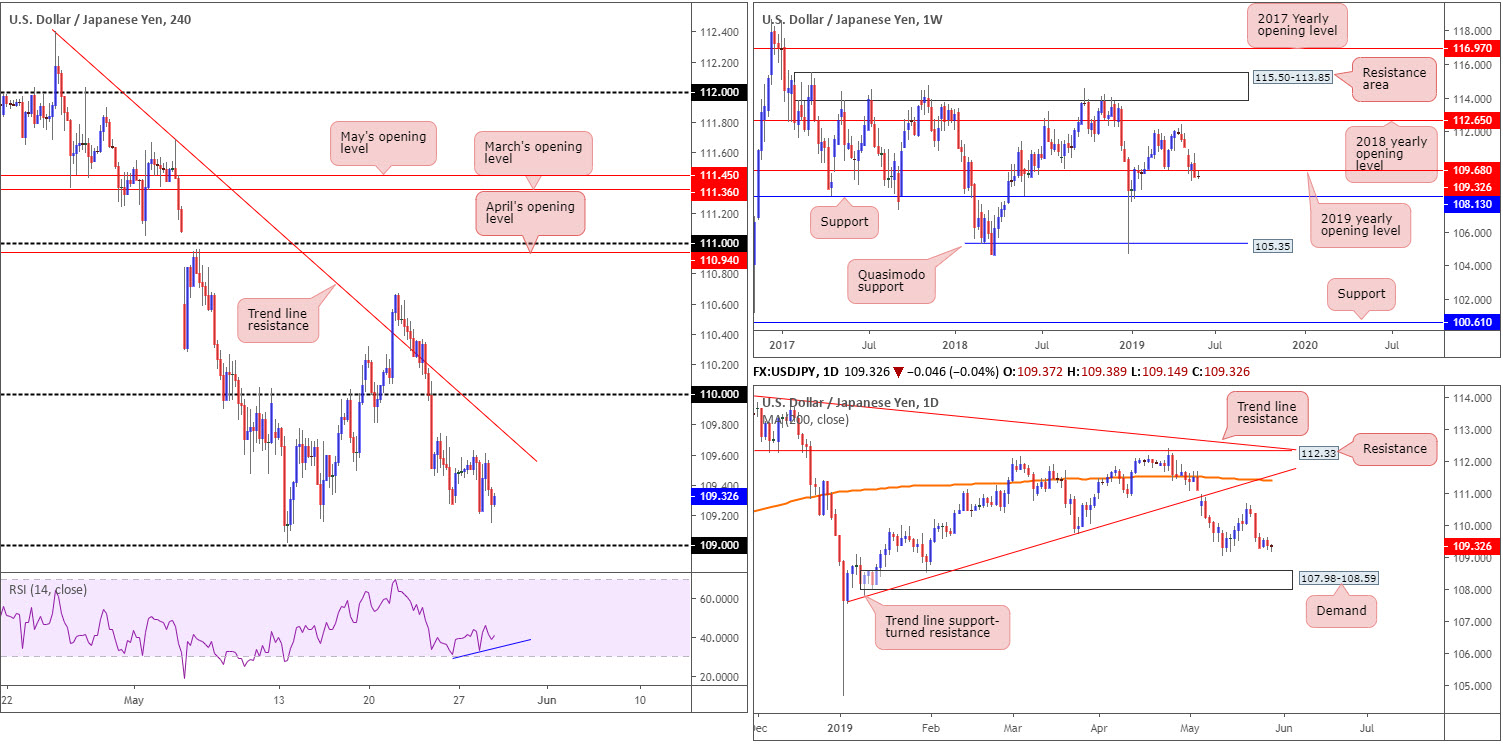
With 110 now a distant memory on the H4 timeframe, and also trend line resistance (extended from the high 112.40), the next calling in terms of downside targets falls in around the 109 handle. Interestingly, though, we can see the RSI printing mild positive divergence (blue line).
From the weekly timeframe, the 2019 yearly opening level at 109.68 suffered a break to the downside last week. This could, assuming sellers remain in the driving seat, drive interest towards support at 108.13. In terms of daily flow, price action appears poised to approach the 109.01 May 13 low, shadowed by a particularly interesting area of demand at 107.98-108.59. To the upside, nevertheless, traders may be interested in the trend line support-turned resistance (taken from the low 107.77) and closely merging 200-day SMA (orange). That is, of course, assuming the unit can overthrow last week’s high 110.67.
Areas of consideration:
109 based on the H4 timeframe may offer traders a floor to buy from today, likely to be supported by RSI oversold conditions and the 109.01 May 13 low mentioned above on the daily timeframe. However, with a daily support area seen at 107.98-108.59 likely acting as a magnet for traders on that timeframe, which holds weekly support at 108.13 within (the next downside target on the weekly timeframe), 109 is potentially a fragile support.
Shorts beneath 109, therefore, are certainly an option worth exploring should we travel this far south, targeting the top edge of the daily support area at 108.59 as the initial port of call. As always, though, a retest of the broken level (109) is considered the higher-probability move, given fakeouts are common around psychological numbers.
Today’s data points: Limited.
USD/CAD:
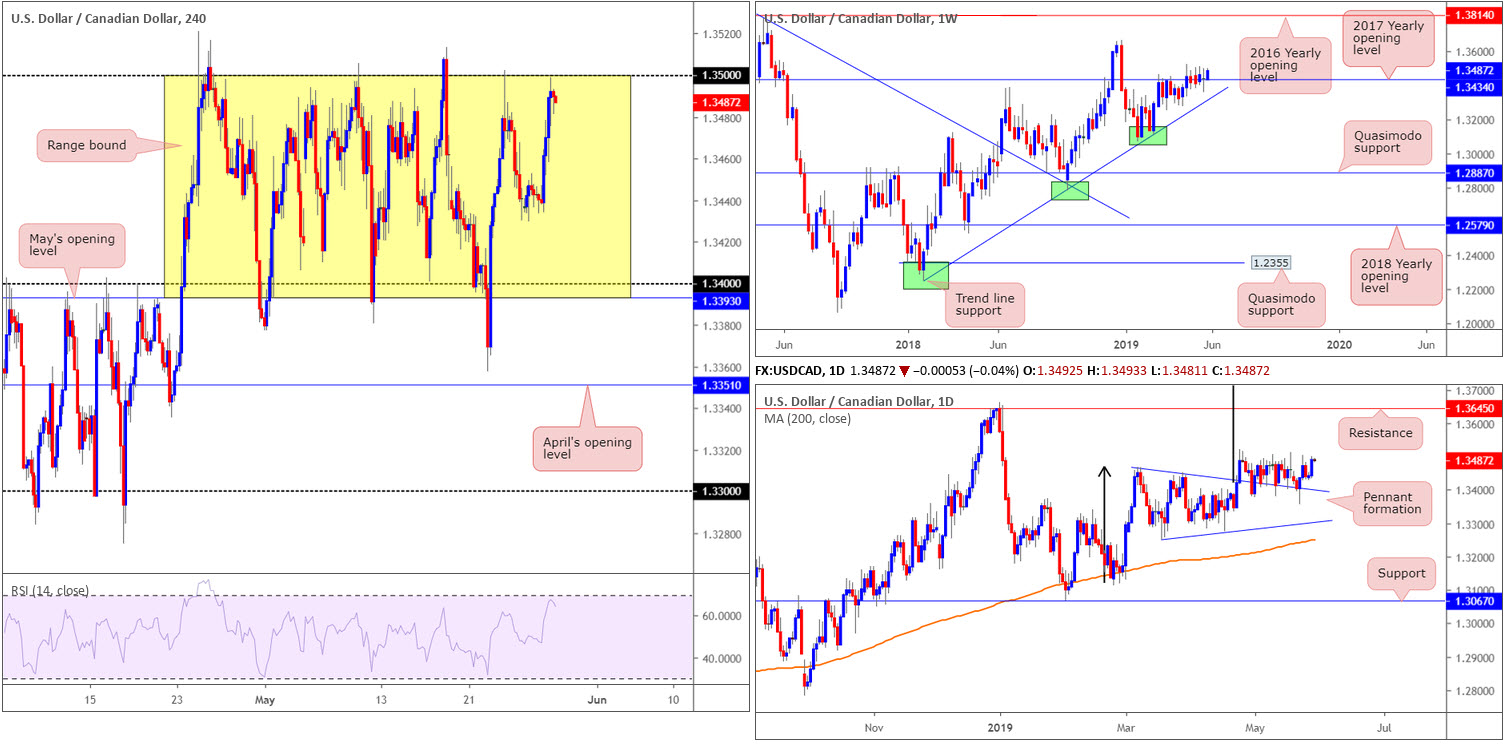
Broad-based USD bidding (dollar index eyes 98.00) lifted the USD/CAD higher Tuesday, adding 0.37%. The recent upsurge, as you can see, brought the H4 candles up to within close proximity of the upper edge of its current range: 1.35.
Overall, the H4 candles, since the latter part of April, have been busy carving out a 100-point+ range between May’s opening level at 1.3393/1.34 and the round number 1.35. It might also interest some traders to note the RSI indicator is seen nearing its overbought value.
Higher-timeframe flow continues to fluctuate around the 2017 yearly opening level at 1.3434 on the weekly timeframe, though appears to be attempting to push higher, as of writing. Areas outside of this level to be aware of remain around the 2018 yearly high of 1.3664, and a trend line support etched from the low 1.2247.
Daily action has experienced limited change over the past month or so. Price action shows the daily candles continue to feed off support drawn from the top edge of a pennant pattern (1.3467). Although the traditional price target (calculated by taking the distance from the beginning of the preceding move and adding it to the breakout price) remains on the chart at 1.3768 (black arrows), the next upside target from a structural standpoint falls in around resistance at 1.3645.
Areas of consideration:
Range traders are likely to short 1.35, expecting the H4 candles to fill the range back towards 1.34. Seeing as how round numbers are prone to fakeouts, waiting for additional candlestick confirmation to form prior to pulling the trigger is an option (entry/risk levels can be determined according to this structure).
In the event we continue to push higher, the market may observe a H4 close form above the 1.35 figure. Should a close higher occur, traders have the choice of either buying the breakout candle and placing stop-loss orders beneath its tail, or waiting and seeing if a retest scenario takes shape and entering on the back of the rejection candle’s structure. The next upside target on the H4 scale can be seen around 1.3570 (not seen on the screen), though according to the higher timeframes we could be heading much higher.
In terms of high-impacting events, we have the BoC in the spotlight today, traders.
Today’s data points: BoC Rate Statement and Overnight Rate.
USD/CHF:
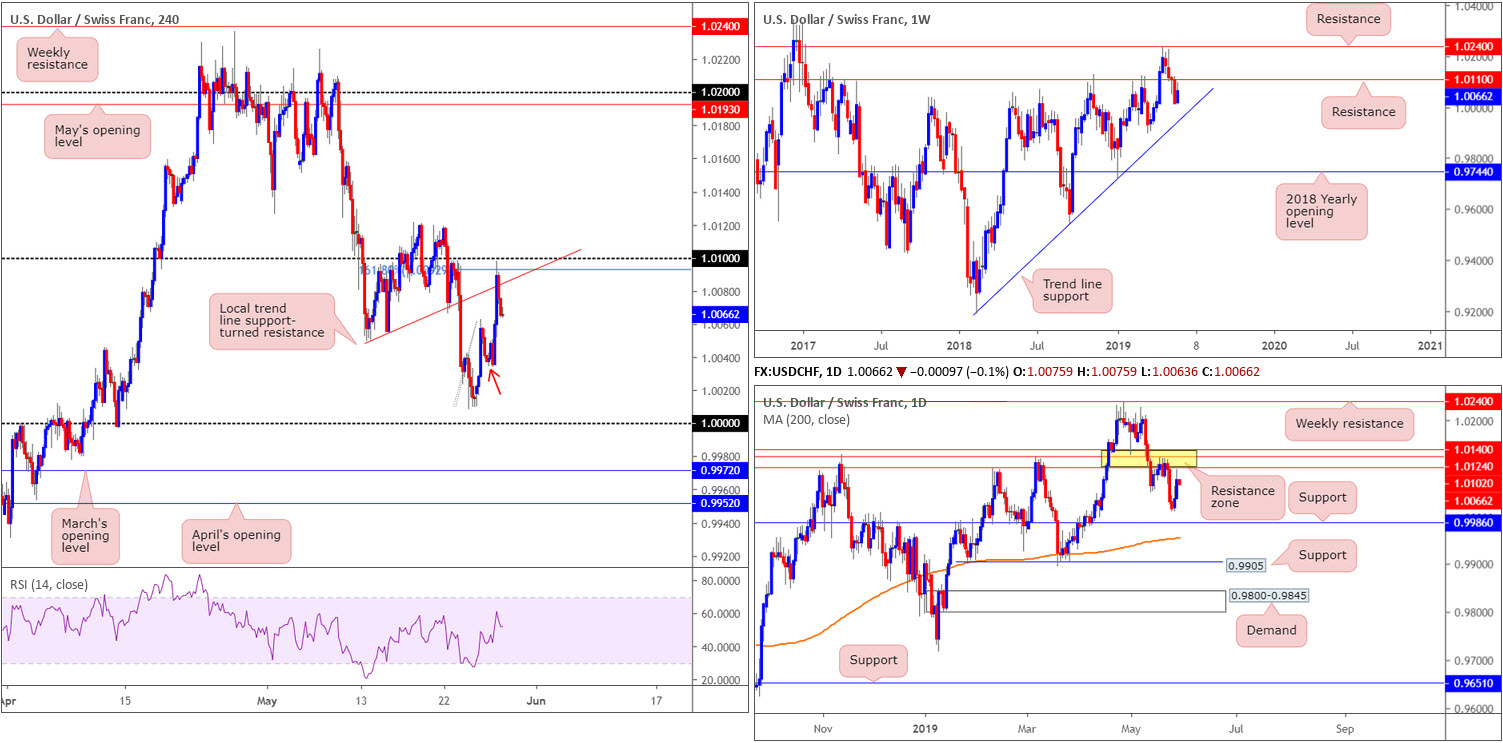
Aided by a local trend line support-turned resistance on the H4 timeframe (extended from the low 1.0050), and a 161.8% Fibonacci ext. point at 1.0092, the USD/CHF turned lower just south of the 1.01 handle Tuesday. Further selling from this point has minor demand positioned around 1.0045ish (red arrow) to target, followed closely by the key figure 1.0000.
Branching out and exploring the higher timeframes, the research team notes weekly price continues to languish beneath resistance at 1.0110, with the next downside target on this scale seen around trend line support (etched from the low 0.9187).
A closer analysis of price action on the daily timeframe has the candles loitering just south of a robust resistance zone between 1.0102/1.0140. Note this area held price action lower last week and came within touching distance of support at 0.9986.
Areas of consideration:
On the whole, technical direction favours sellers at the moment. Should you be looking to sell this market, an ideal scenario would be for H4 price to retest the 1.01/1.0092 region, which as we already know boasts additional resistance from a local trend line resistance. What’s more, let’s not forget this small H4 zone has a close connection with the lower edge of the daily resistance zone at 1.0140/1.0102.
1.0000 is also likely an area on many traders’ watchlist today. The number boasts additional backing from daily support at 0.9986.
Regardless of the buy/sell zone selected, traders are urged to consider waiting for additional candlestick confirmation to take shape before taking action. Not only will this help limit unnecessary losses, it’ll help identify buyer/seller intent and provide traders a structure to work with for entry and risk levels.
Today’s data points: Limited.
Dow Jones Industrial Average:
As equity markets look to shake off the long holiday weekend, major benchmarks concluded Tuesday’s session near intraday lows. The Dow Jones Industrial Average fell 0.93%; the S&P 500 lost 0.84% and the tech-heavy Nasdaq ended down 0.31%.
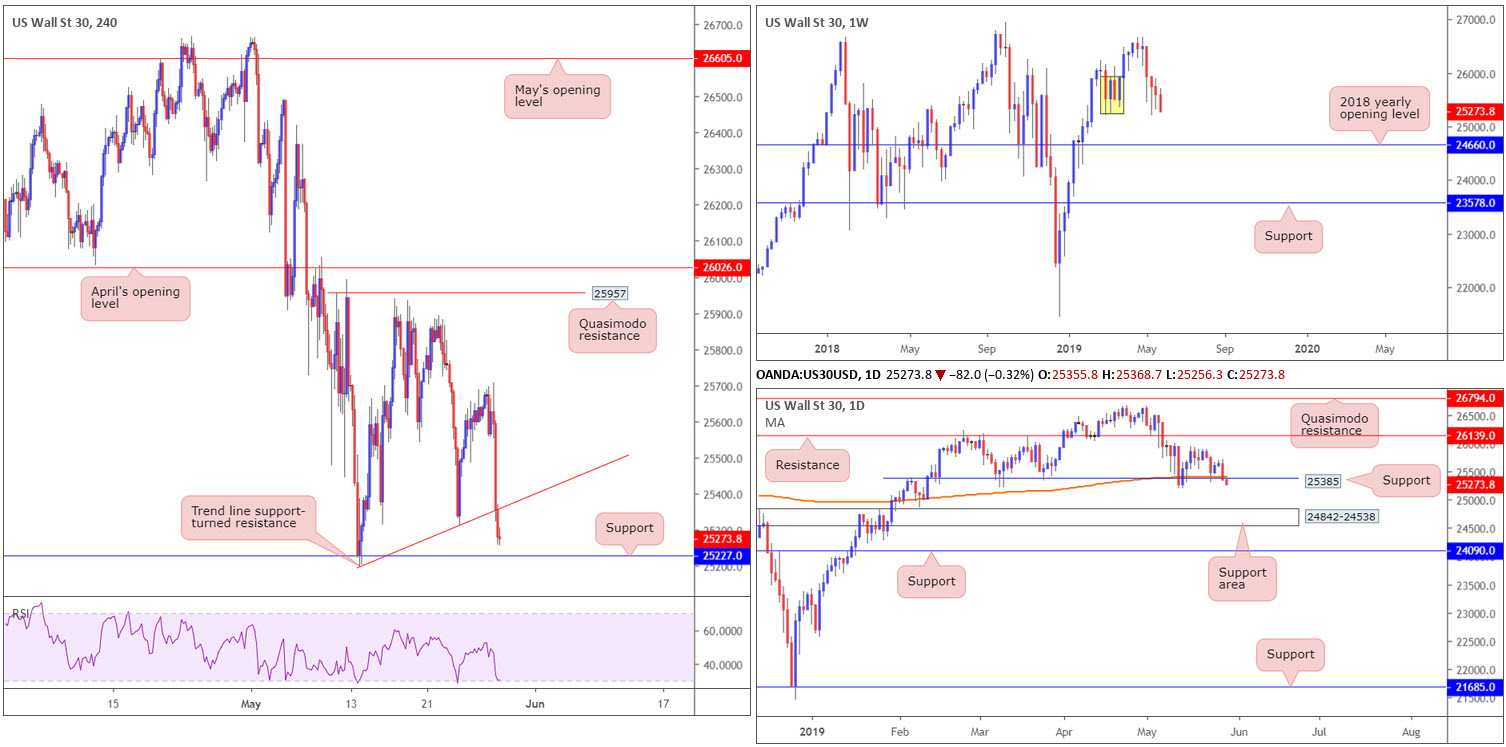
Technically, the DJIA crossed beneath a local H4 trend line support (etched from the low 25198) and is now poised to challenge nearby support plotted at 25227. Note also we have the RSI testing oversold waters.
From a weekly perspective, demand marked in yellow at 25217-25927, although unlikely to be considered a strong area on this timeframe owing to limited momentum produced from the base, is hanging on by a thread. A move to the downside from here has the 2018 yearly opening level to target at 24660.
In conjunction with weekly activity, daily movement recently breached notable support at 25385, which happens to intersect with the 200-day SMA. Additional downside from this point has the support area at 24842-24538 in sight.
Areas of consideration:
According to our technical reading, the pendulum appears to swinging in favour of the sellers at present. A long at the current H4 support at 25227 is, therefore, a chancy play. Ultimately, a CLOSE below this level would likely clear the river south to H4 support at 24942 (not seen on the screen), positioned just north of the current daily support area.
On account of the above, a close beneath 25227 that’s followed up with a retest as resistance (preferably in the form of a bearish candlestick pattern as entry and risk levels can then be plotted according to this structure) is considered a high-probability sell signal to watch for.
Today’s data points: Limited.
XAU/USD (GOLD):
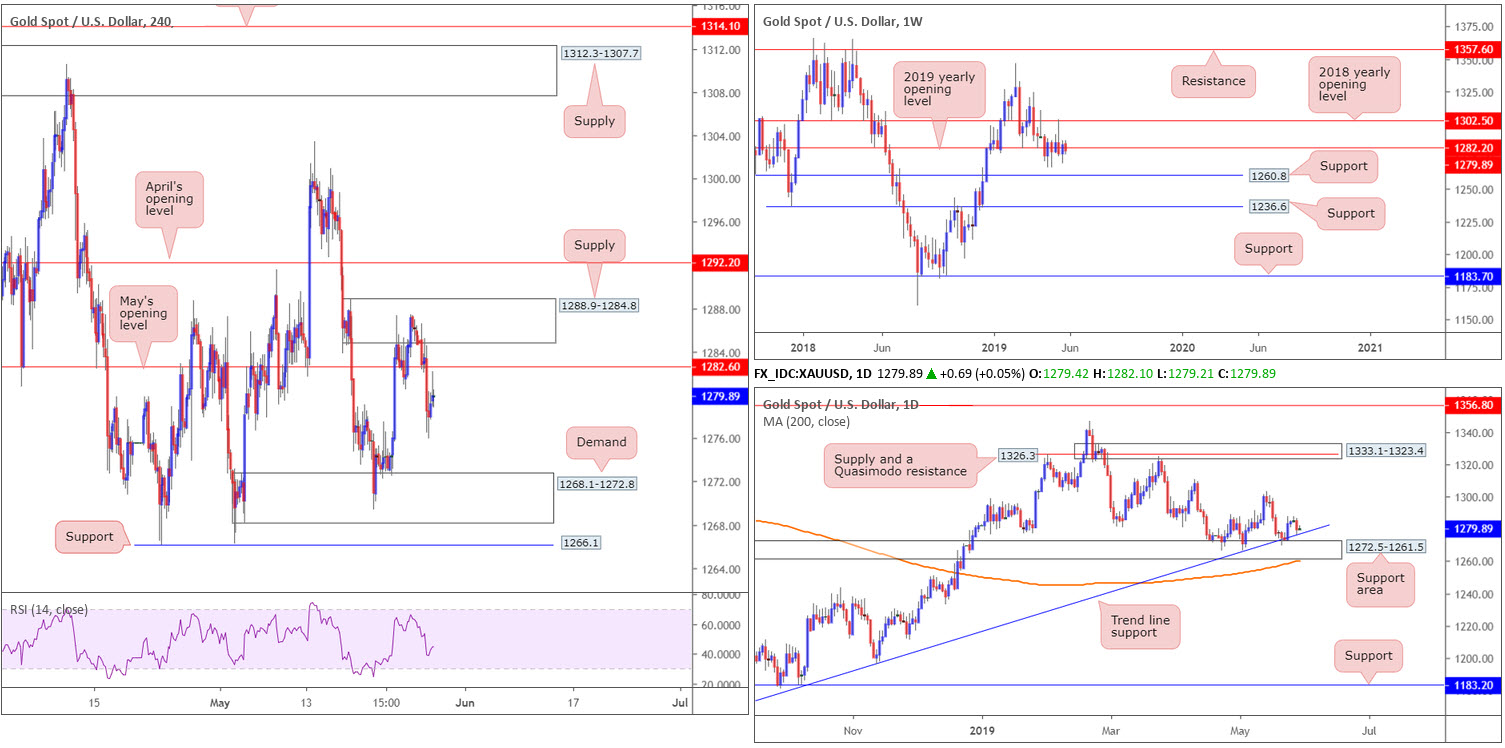
As the dollar explored higher ground Tuesday (US dollar index eyes 98.00), the yellow metal encountered some downside pressure. This sent the H4 candles beneath May’s opening level at 1282.6 (after H4 supply at 1288.9-1284.8 held its ground), and perhaps opened the path towards nearby demand pictured at 1268.1-1272.8, trailed closely by support at 1266.1.
The story on the bigger picture has seen weekly price fluctuate around its 2019 yearly opening level at 1282.2 for the past six weeks. A push higher from here has the 2018 yearly opening level at 1302.5 to target, whereas a push lower has support at 1260.8 in sight.
The recent downturn in price brought the daily timeframe towards a trend line support (extended from the low 1160.3), which is bolstered closely by a support area plotted at 1272.5-1261.5. Note also we have the 200-day SMA crawling higher just beyond the said support area.
Areas of consideration:
With May’s opening level at 1282.6 to potentially serve as resistance, a short trade from here, targeting the H4 demand mentioned above at 1268.1-1272.8 as the initial take-profit zone, could be an option. Traders may, however, wish to wait for additional confirmation before pressing the sell button, due to the threat of further buying on the daily timeframe from trend line support, and a potential fakeout materialising through 1282.6 to the aforesaid H4 supply.
The accuracy, completeness and timeliness of the information contained on this site cannot be guaranteed. IC Markets does not warranty, guarantee or make any representations, or assume any liability with regard to financial results based on the use of the information in the site.
News, views, opinions, recommendations and other information obtained from sources outside of www.icmarkets.com.au, used in this site are believed to be reliable, but we cannot guarantee their accuracy or completeness. All such information is subject to change at any time without notice. IC Markets assumes no responsibility for the content of any linked site. The fact that such links may exist does not indicate approval or endorsement of any material contained on any linked site.
IC Markets is not liable for any harm caused by the transmission, through accessing the services or information on this site, of a computer virus, or other computer code or programming device that might be used to access, delete, damage, disable, disrupt or otherwise impede in any manner, the operation of the site or of any user’s software, hardware, data or property.


