
Key risk events today:
Australia Construction Work Done q/q; Crude Oil Inventories.
EUR/USD:
Europe’s single currency eked out marginal losses versus its US counterpart Tuesday, consequently extending Monday’s losses. On the data front, The US conference board consumer confidence Index declined slightly in August, following July’s rebound. The index now stands at 135.1 (1985=100), down from 135.8 in July. Fifth District manufacturing activity was also moderate in August, according to the most recent survey from the Federal Reserve Bank of Richmond. The composite index rose from −12 in July to 1 in August, buoyed by increases in the indexes for shipments and new orders.
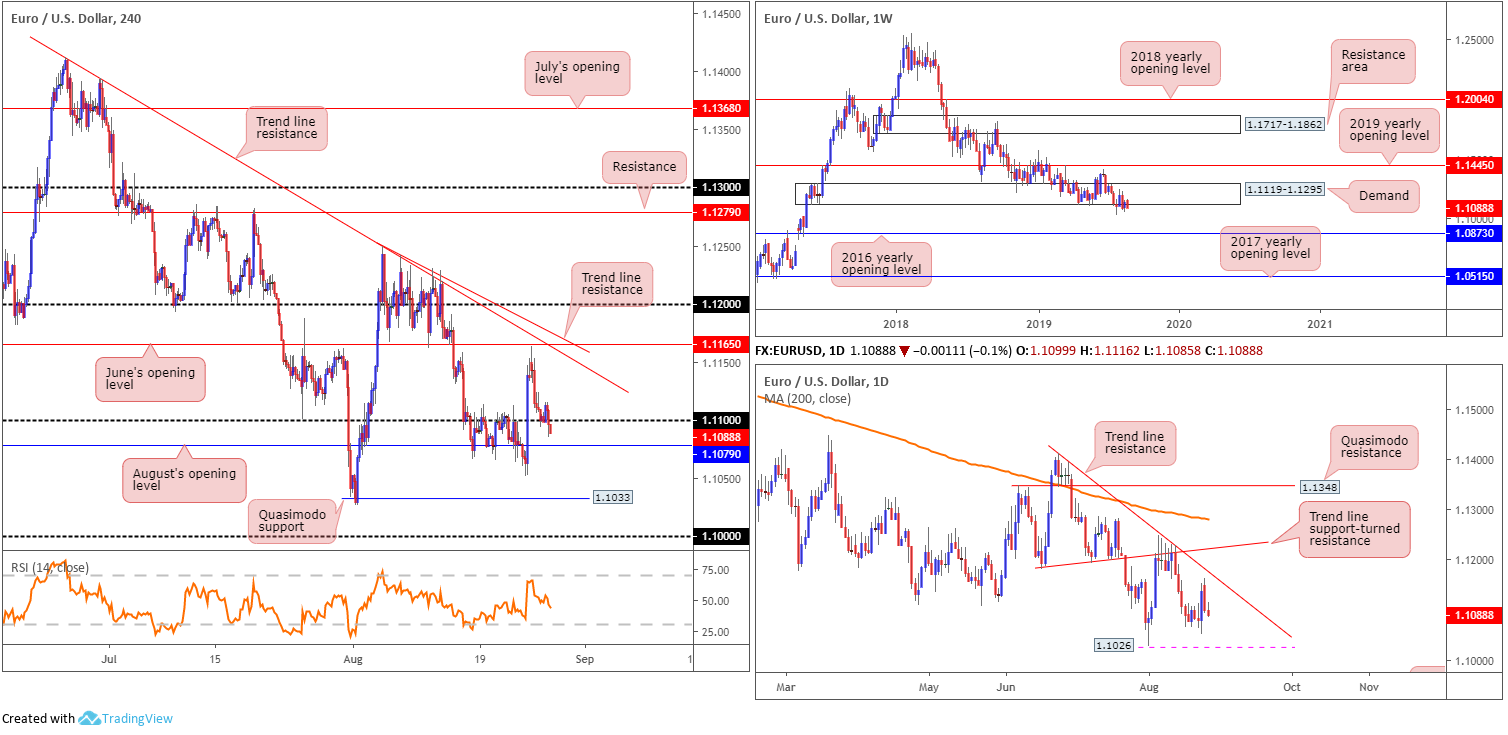
Technically, we’re treading water beneath the 1.11 handle on the H4 scale, poised to approach August’s opening level nearby at 1.1079. Beyond this point we have Quasimodo support in the firing range at 1.1033, closely shadowed by the widely watched key figure 1.10.
In terms of the longer-term picture, weekly structure remains unchanged from Monday’s weekly briefing:
Long-standing demand at 1.1119-1.1295 remains delicate, as sell stops continue to fill beneath its boundary. Although concluding the week in mildly firmer territory, additional downside is the favoured route on this timeframe. Continued selling could eventually see the unit knock on the 2016 yearly opening level’s door at 1.0873, which houses strong historical significance.
In addition to the above, since topping in early 2018, the long-term trend remains pointing in a southerly bearing.
The daily timeframe:
Neighbouring resistance on tap this week is visible by way of a trend line resistance (etched from the high 1.1412), shadowed closely by another layer of trend line resistance (prior support) extended from the low 1.1181 and then the 200-day SMA (orange – currently circulating around 1.1283). To the downside, support resides at 1.1026, the 2019 low, followed by demand (not visible on the screen) at 1.0851-1.0950.
Areas of consideration:
Selling south of 1.11 may be of interest to some traders this morning, having seen room to press lower on the daily timeframe until 1.1026 and waning impetus out of weekly demand at 1.1119-1.1295. With that being said, August’s opening level resides close by on the H4 timeframe at 1.1079, which may hamper downside. The more conservative route, therefore, according to our chart studies, is to wait for a H4 close beneath 1.1079 to form before contemplating short scenarios, either on the breakout candle itself or, more conservatively at a possible retest motion of 1.1079. The next support target from here is the H4 Quasimodo support highlighted above at 1.1033.
GBP/USD:
The British pound, an outperformer in the G10 space, firmed against the US dollar Tuesday. Adding more than 0.50%, the GBP/USD erased all of Monday’s losses and challenged fresh monthly tops at 1.2309. The source behind recent bidding came after UK Labour Leader Corbyn met with opposition officials, where they came to an agreement that a legislative route is the most promising route to block a no deal Brexit.
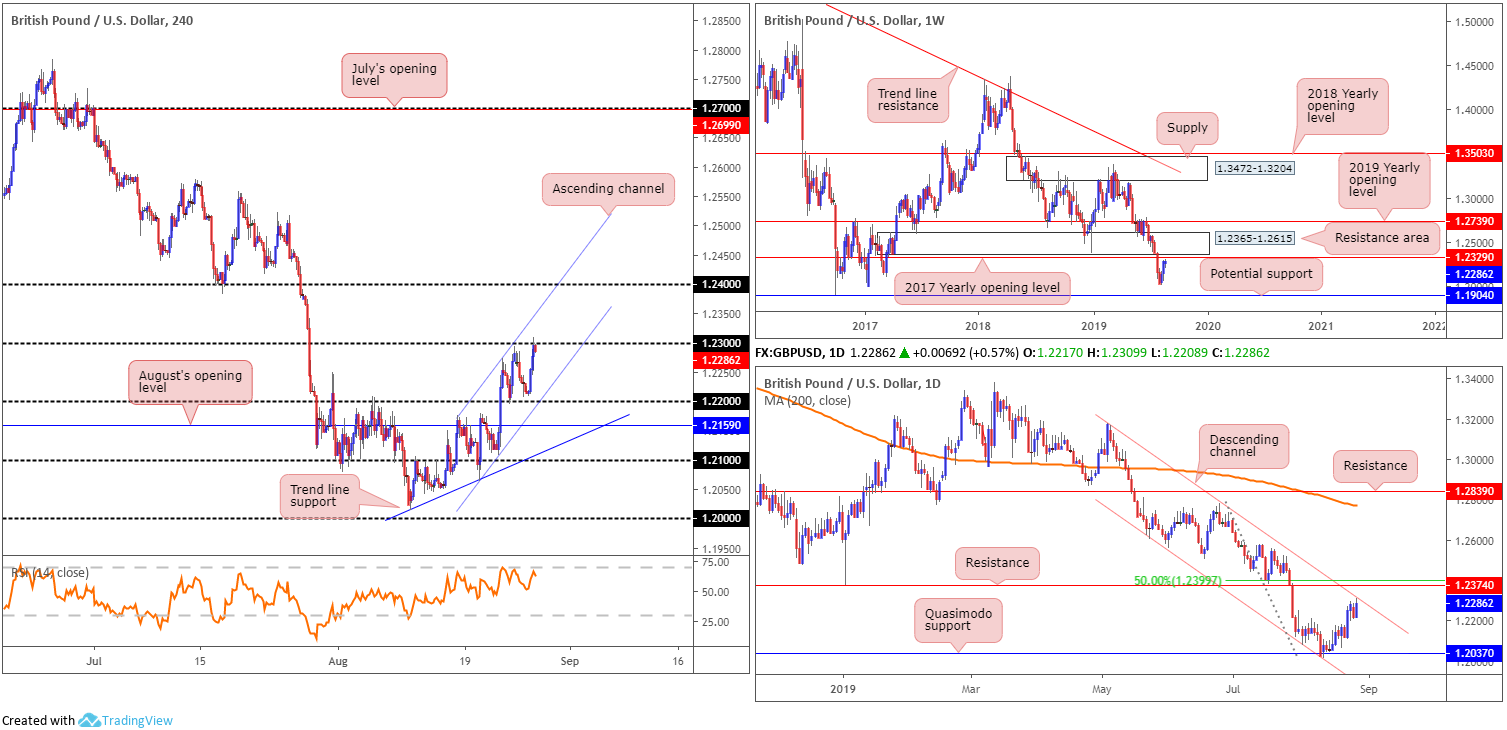
As evident from the H4 timeframe, the candles settled the day a shade lower than 1.23. Note we also have the H4 space encompassed within an ascending channel formation (1.2064/1.2175). While many traders may be watching for a decisive move to form above 1.23 to enter long, caution is advised.
Poised to approach the 2017 yearly opening level at 1.2329 (resistance) on the weekly timeframe, set a couple of points south of a major resistance area at 1.2365-1.2615, this is an area sellers are expected to make an appearance. In conjunction with this, daily channel resistance entered the mix (taken from the high 1.3176).
Areas of consideration:
With higher-timeframe flow pointing in a southerly direction, attempting longs above 1.23 is incredibly chancy. A notable fakeout above this psychological mark may be seen, however. Not only will this run buy stops from sellers attempting to fade, it’ll also fill breakout buyers, and fuel liquidity to sell into, it may draw in weekly sellers from 1.2329.
An ideal scenario in this case would be for H4 price to pop above 1.23, tag in weekly sellers from 1.2329, and drop lower. The closing price formed beneath 1.23 would serve as an entry price, with protective stop-loss orders positioned above the weekly resistance level and an initial take-profit target set at the H4 channel support (extended from the low 1.2064).
AUD/USD:
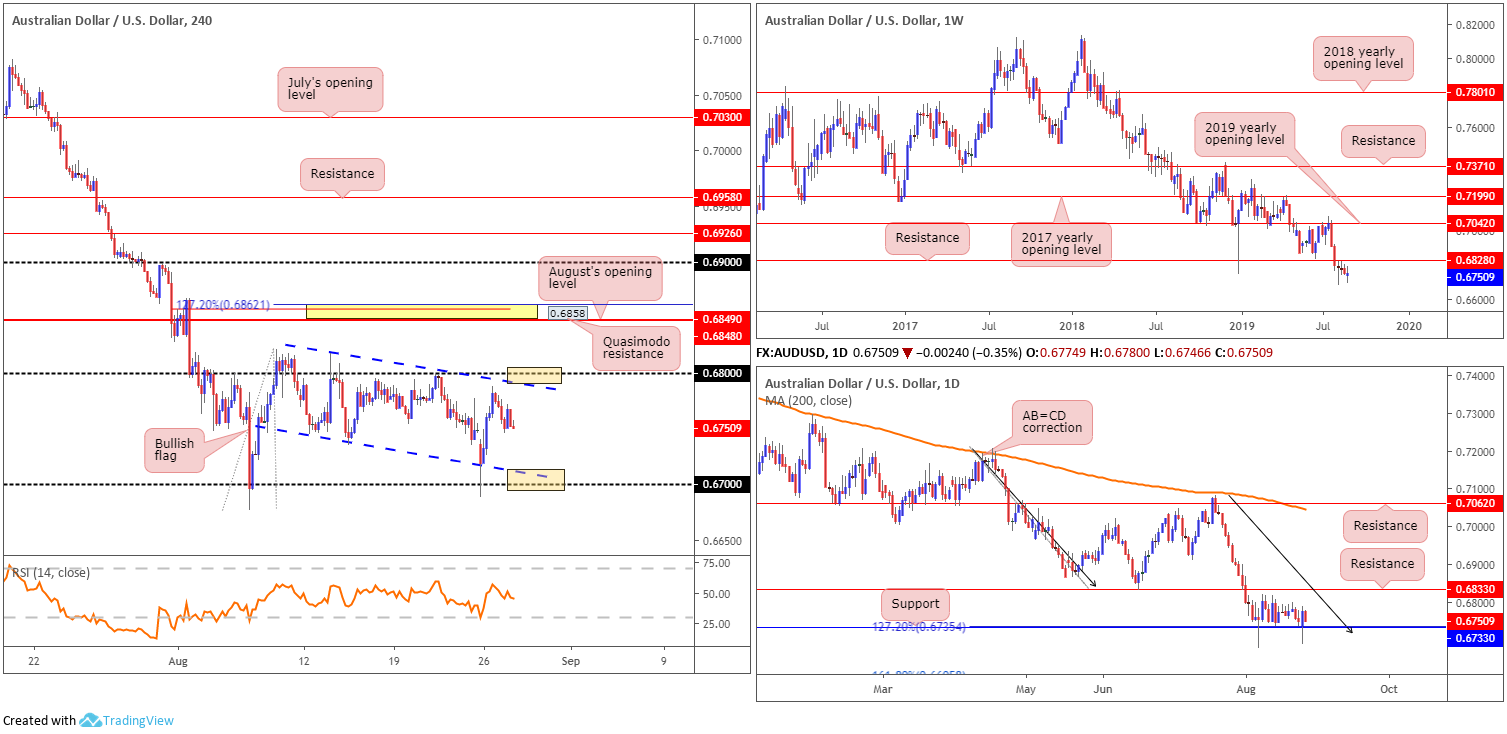
Since early August, the H4 candles have been contained beneath 0.68, compressing within the limits of a bullish flag scenario (0.6817/0.6745). As underlined in Tuesday’s briefing, flags typically slope in the opposite direction to the underlying trend, which is clearly not the case here but may still form part of a correction move if we break higher, or even help signify early signs of a longer-term trend breakout.
Beyond the 0.68 handle, a close-fitting area of resistance (yellow) resides between a 127.2% Fibonacci ext. point at 0.6862, a Quasimodo resistance at 0.6858 and August’s opening level at 0.6848.
Higher-timeframe structure remains intact and unaltered – extracted from Monday’s weekly report:
The end of July witnessed the unit slip beneath notable weekly support at 0.6828, now a serving resistance. The following two weeks were colourless, organised as back-to-back indecision candles, with last week’s session also not really doing much to turn the dial.
The long-term downtrend, intact since the beginning of 2018, remains unbroken, with further selling likely on the cards as the next weekly support is not visible until 0.6395 on this timeframe (not seen on the screen).
Daily timeframe also remains unchanged:
Since elbowing beneath weekly support mentioned above at 0.6828, support at 0.6733 on the daily timeframe, along with a 127.2% AB=CD (black arrows) formation at 0.6735, entered the fray and held things higher. Despite this, the pair remains deeply in bearish territory and does not appear to have the firepower to cross swords with resistance at 0.6833 (June 18 low), despite Monday’s bullish engulfing formation.
Areas of consideration:
Although the take-profit target for the H4 bullish flag configuration will come in higher (typically calculated based on the value of the preceding move and added to the breakout point), overlooking H4 resistance at 0.6862/0.6848 is chancy. Further to this, traders may also want to acknowledge that between 0.68 and the aforesaid H4 resistance zone, daily resistance at 0.6833 and weekly resistance at 0.6828 is in view. On account of the above, the research team feel longs above the current H4 flag formation/0.68 are challenging.
Psychological levels 0.67 and 0.68 remain in the firing range as potentially tradeable barriers, given both merge closely with the H4 bullish flag extremes. As round numbers are prone to stop runs, traders are urged to wait for additional candlestick confirmation to form before pulling the trigger. This way, not have you only identified buyer/seller intent, you also have structure to base entry/risk levels from.
The yellow H4 area of resistance between 0.6862/0.6848 is also an area worthy of consideration for shorts. Granted, while this zone is a touch above higher timeframe-resistance, a fakeout above these levels (likely flushing out greedy buy stops) to the said H4 zone is a strong possibility if we break 0.68. Entry at 0.6848 is valid, with a tight protective stop-loss order plotted above 0.6862, but if you prefer waiting for additional confirmation, a bearish candlestick pattern would suffice and help base entry and risk levels.
USD/JPY:
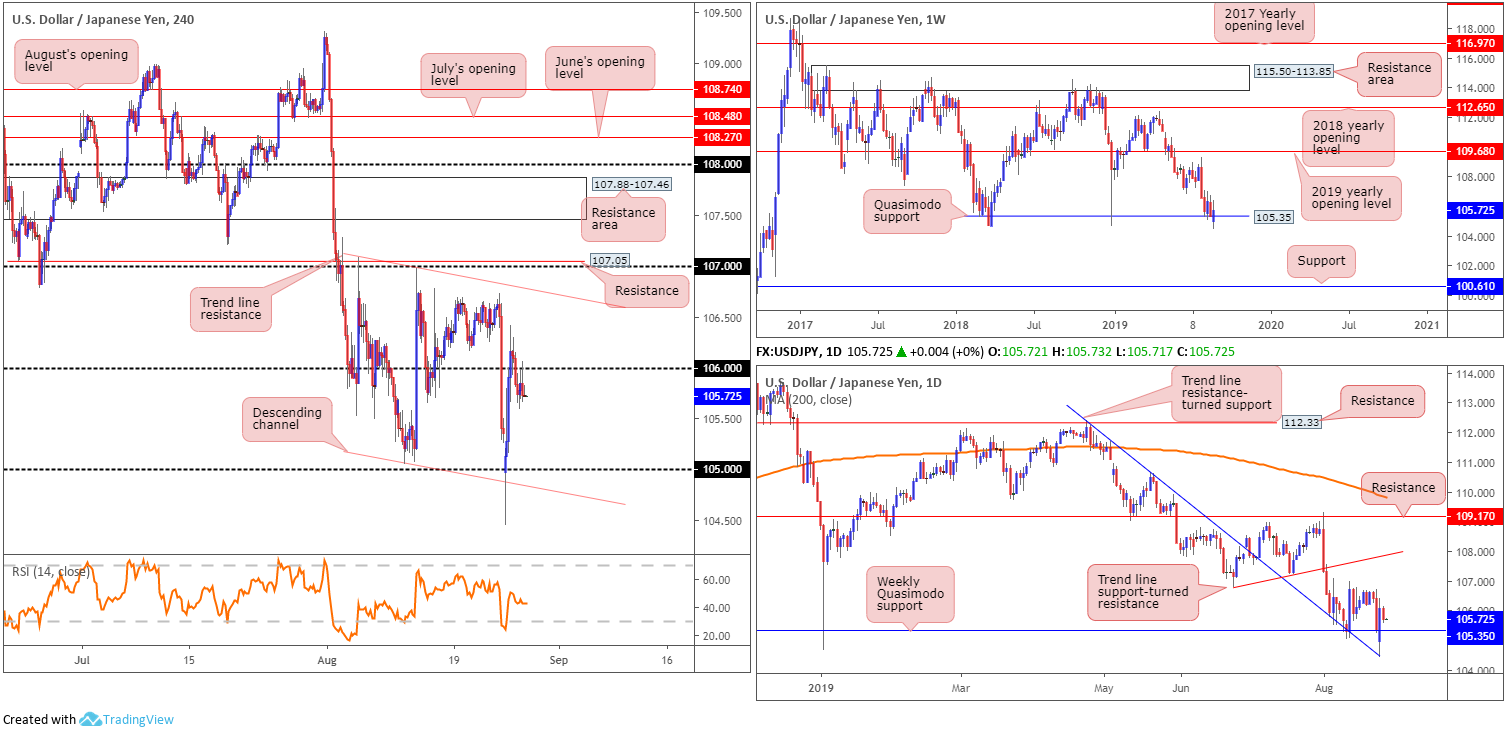
Tuesday had the buck a shade lower against the Japanese yen Tuesday, down 0.35%. This swung the H4 candles sub 106, which held as resistance in the shape of back-to-back selling wicks as the market attempted to reclaim lost ground. The next port of call in terms of potential support falls in around the 105 handle, closely shadowed by channel support etched from the low 105.05. Overhead, we have channel resistance taken from the high 107.09, followed by 107 and resistance at 107.05.
Longer term, as highlighted in previous reports, weekly price is defending Quasimodo support at 105.35 – a level that proved its worth by holding the unit higher at the beginning of the year. Outside of this base, limited support is evident until 100.61, whereas a push north has the 2019 yearly opening level at 109.68 to target. Beyond the weekly Quasimodo support, daily traders likely have a trend line resistance-turned support (pencilled in from the high 112.40) on the radar, which entered the mix in recent trade and held ground.
Areas of consideration:
Having noted H4 price settling beneath 106 this morning, formed by way of reasonably attractive H4 selling wicks, shorts on the back of these candlesticks could be an option, with protective stop-loss orders sited above 106.10 and targeting the weekly Quasimodo support at 105.35.
USD/CAD:
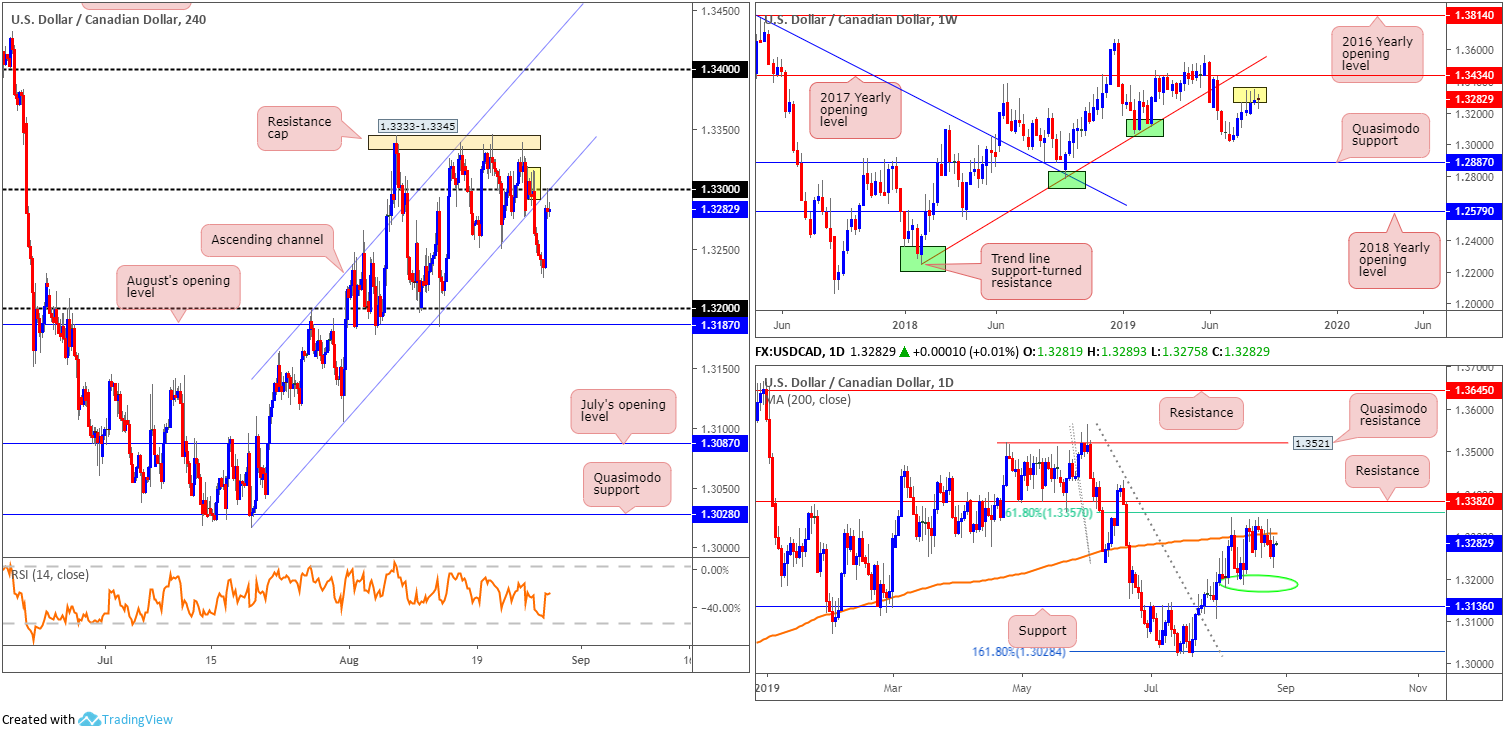
The US dollar staged a reasonably notable recovery vs. the Canadian dollar Tuesday, seizing a large share of Monday’s losses. Adding 0.21%, the H4 candles wrapped up the session shaking hands with 1.33 by way of a selling wick, which also merges closely with channel support-turned resistance (extended from the low 1.3015). by and of itself, this confluence of technical structure is likely sufficient evidence to lure additional sellers into the market today, with yesterday’s low 1.3225 in sight as support, and then the 1.32 handle.
In addition to the above, higher-timeframe movement still has the daily candles languishing beneath the 200-day SMA (currently circulating around 1.3307). While downside has local support concentrated around 1.3190 (green circle), the more prominent support falls in a touch lower at 1.3136. In terms of weekly price action, longer-term direction has been lethargic, shaped in the form of back-to-back selling wicks (yellow). Although considered a sign of healthy rejection, the unit still exhibits scope to approach the 2017 yearly opening level at 1.3434, closely shaded by trend line support-turned resistance pencilled in from the low 1.2247.
Should we turn lower and leave the said resistances unchallenged, traders’ focus will likely be on the 1.3016 July 15 low, followed by Quasimodo support at 1.2887.
Areas of consideration:
Based on the chart studies presented above, sellers appear to have the upper hand now. For those interested in this bearish theme, a short at current price is an idea, with a protective stop-loss order plotted either above 1.33 or above the H4 supplyish base at around 1.3317 (yellow).
USD/CHF:
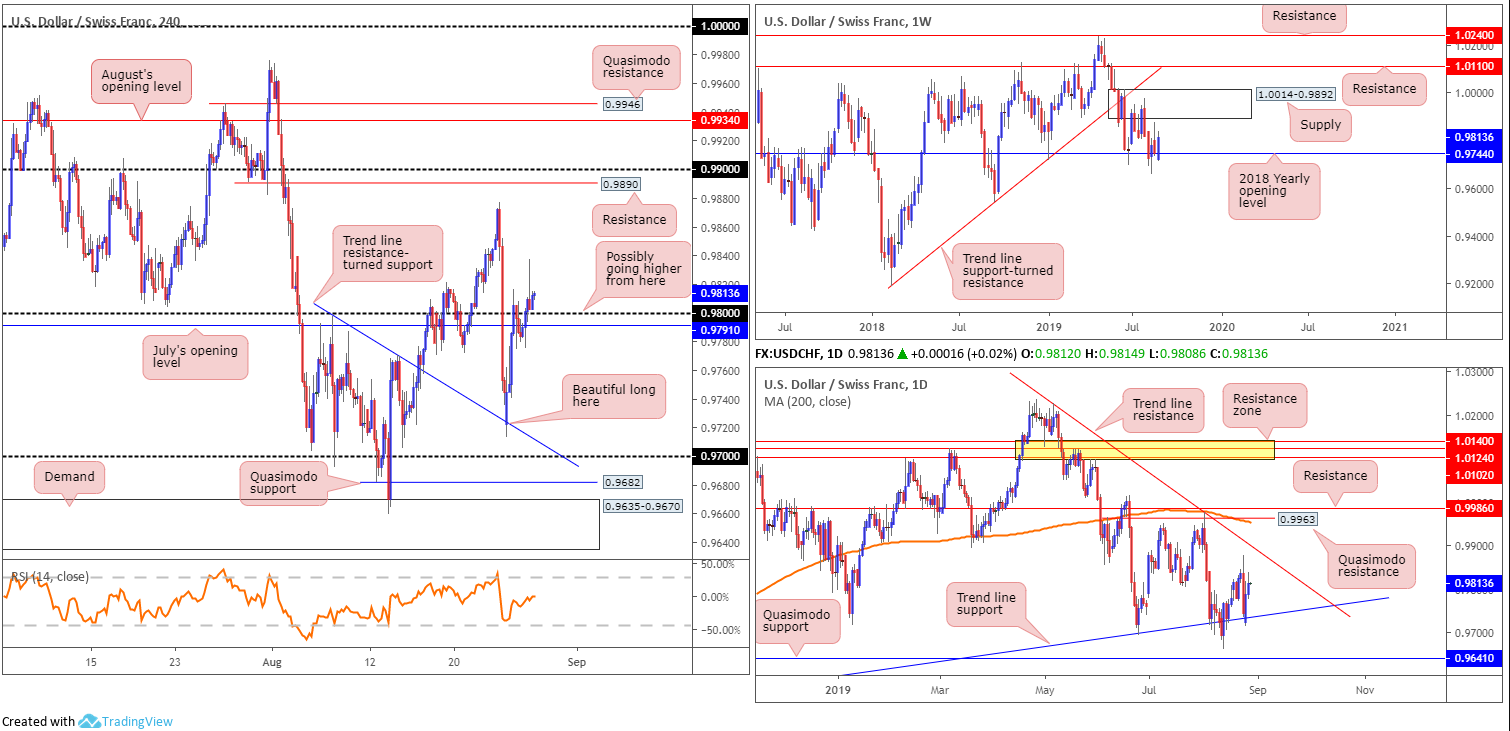
Buyers governed much of the action Tuesday, lifting the USD/CHF above July’s opening level at 0.9791 on the H4 timeframe and the 0.98 handle. With buy stops likely filled above the psychological band, buyers likely have the upper hand. The next upside target can be seen around the 0.9877 August 23 high, closely trailed by resistance plotted at 0.9890 and then the 0.99 handle.
Weekly impetus derived from the 2018 yearly opening level at 0.9744 (support), which has an upside target set at supply coming in from 1.0014-0.9892, and daily price finding its feet off trend line support taken from the low 0.9542, is likely to fuel upside above 0.98 on the H4 scale today.
Areas of consideration:
For traders who remain long this market from the reaction off H4 trend line resistance-turned support (extended from the high 0.9797) – a noted level to be aware of in Monday’s weekly briefing – partial profits should be in the bag and risk reduced to at least breakeven.
In the event further buying emerges above 0.98, however, as the higher-timeframes suggest, a bullish scenario, targeting the daily trend line resistance highlighted above (1.0226) may occur. Conservative traders will likely look for a retest play at 0.98, preferably in the shape of a H4 bullish candlestick signal (entry and risk can be governed according to this structure. More aggressive traders who favour trading the breakout candle will already likely be long.
Dow Jones Industrial Average:
US equities closed lower Tuesday, reclaiming a portion of Monday’s gains as hopes for a resolution of the US-China trade conflict began to fade. The Dow Jones Industrial Average declined 120.93 points, or 0.47%; the S&P 500 also declined 9.22 points, or 0.32% and the tech-heavy Nasdaq 100 also erased 8.99 points, or 0.12%.
Technically speaking, limited change is observed. Therefore, much of the following report will echo thoughts aired in Tuesday’s morning brief.
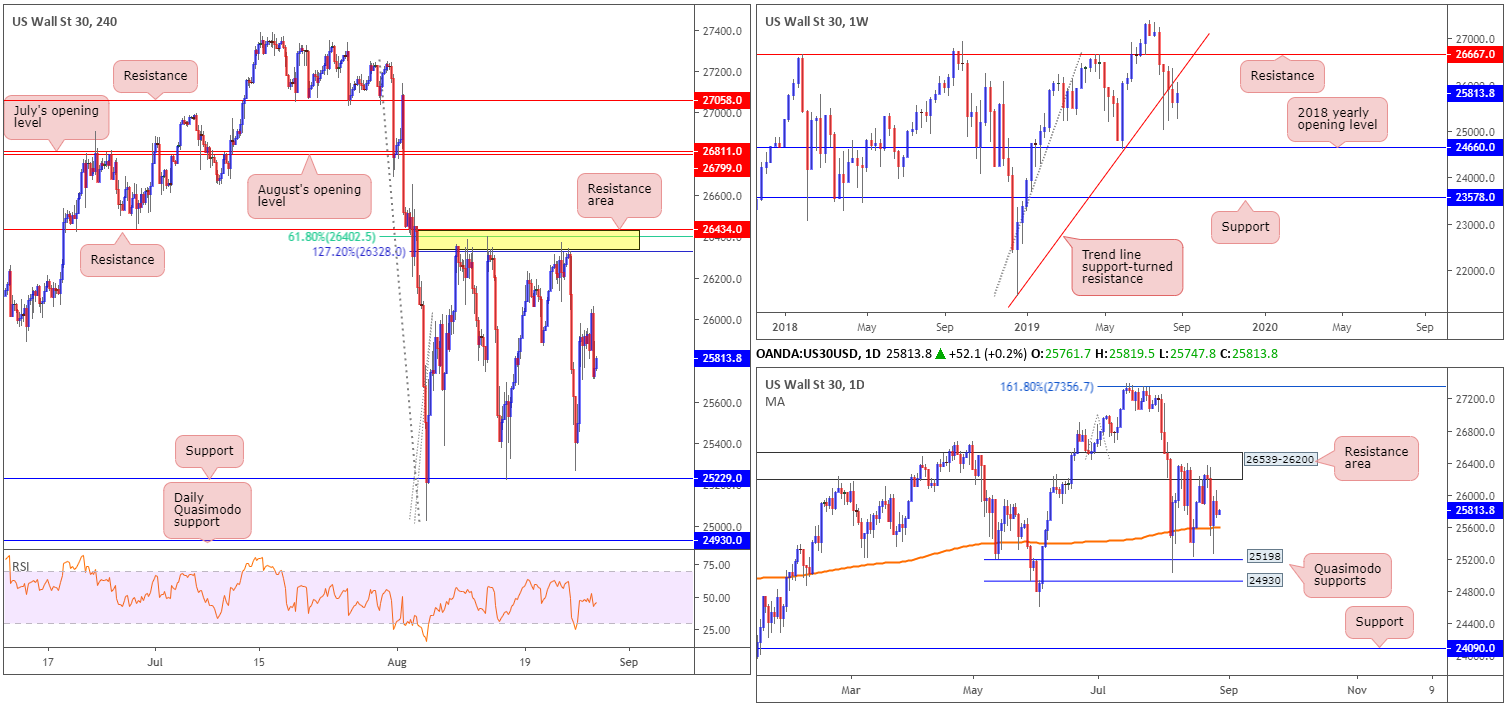
Kicking things off from the weekly timeframe this morning, price action is seen fast approaching the underside of a recently broken long-term trend line support (taken from the low 21452). A retest at this base could spark another wave of selling. Failing that, traders’ crosshairs will likely be fixed on resistance at 26667.
Since early August, the daily candles have been bounded by a Quasimodo support coming in at 25198 and a resistance area forged at 26539-26200, which holds within it the 200-day SMA function (orange – 25611). What’s notable from a technical perspective is the said resistance zone is sited just south of weekly resistance at 26667.
H4 flow remains capped by a familiar resistance zone at 26434/26328 (comprised of resistance at 26434, a 127.2% Fibonacci ext. point at 26328 and a 61.8% Fibonacci retracement value at 26402). This is the third time this month the index has responded from here, once more exposing support at 25229, the lower base of the current H4 range, closely followed by daily Quasimodo support at 24930.
Areas of consideration:
Longer term, the research team has eyes on the trend line support-turned resistance on the weekly timeframe. A rejection off this line could spell trouble for longs, with the next downside target on this scale coming in at the 2018 yearly opening level at 24660. What’s also interesting is the daily resistance area at 26539-26200 also bolsters the noted weekly line.
Medium term (H4), crosshairs remain on the H4 resistance area at 26434/26328 for additional reactions, owing to the zone being positioned within the limits of the daily resistance area, which as we already know has a connection to a weekly trend line resistance. Therefore, keep an eye open for a test of this zone, preferably in the form of a bearish candlestick pattern. Traders then have the option of setting entry/risk levels by the H4 or daily resistance areas, or simply on the back of the candlestick structure.
XAU/USD (GOLD):
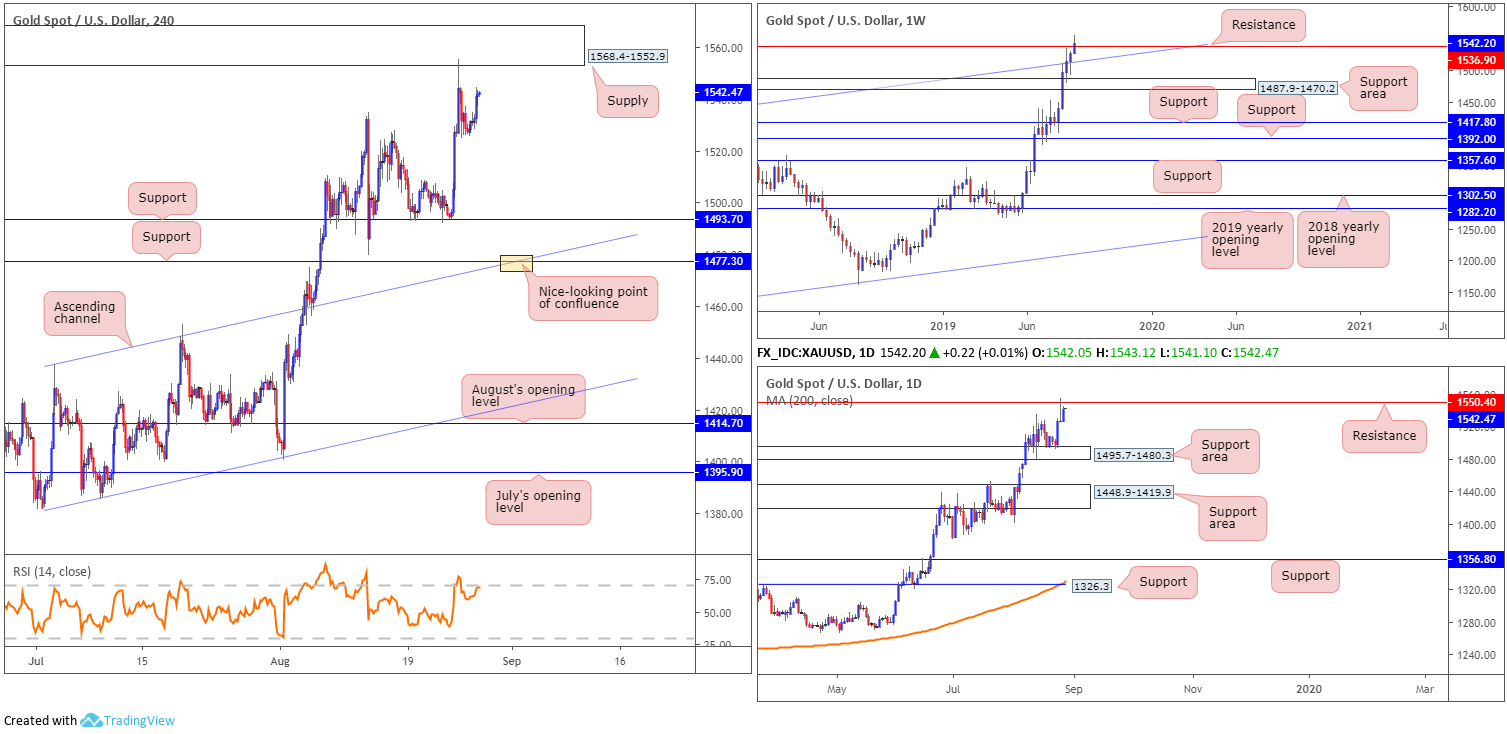
Spot gold, in $ terms, finished firmer Tuesday, up 0.96%. Monday witnessed the H4 candles shake hands with supply at 1568.4-1552.9, which, despite yesterday’s advance, remains in the fray. In the event we turn lower from here, support at 1493.7 remains a logical downside target.
Weekly movement is, once again, seen challenging resistance at 1536.9, with price action currently trading beyond the level, as we write.
By the same token, daily price tested resistance at 1550.4 and wrapped up Monday in the shape of a shooting star pattern. As is evident from the chart, limited follow-through selling emerged, with the unit poised to retest the said resistance for a second time.
Areas of consideration:
With all three timeframes exhibiting scope to explore lower ground – weekly price trading above resistance is not considered a bullish signal UNTIL a close is observed – a move lower could be on the cards. To be on the safe side, given the current uptrend, traders may want to consider waiting for the H4 candles to revisit H4 supply and assess for signs of weakness in the form of bearish candlestick formations.
The accuracy, completeness and timeliness of the information contained on this site cannot be guaranteed. IC Markets does not warranty, guarantee or make any representations, or assume any liability regarding financial results based on the use of the information in the site.
News, views, opinions, recommendations and other information obtained from sources outside of www.icmarkets.com.au, used in this site are believed to be reliable, but we cannot guarantee their accuracy or completeness. All such information is subject to change at any time without notice. IC Markets assumes no responsibility for the content of any linked site.
The fact that such links may exist does not indicate approval or endorsement of any material contained on any linked site. IC Markets is not liable for any harm caused by the transmission, through accessing the services or information on this site, of a computer virus, or other computer code or programming device that might be used to access, delete, damage, disable, disrupt or otherwise impede in any manner, the operation of the site or of any user’s software, hardware, data or property.


