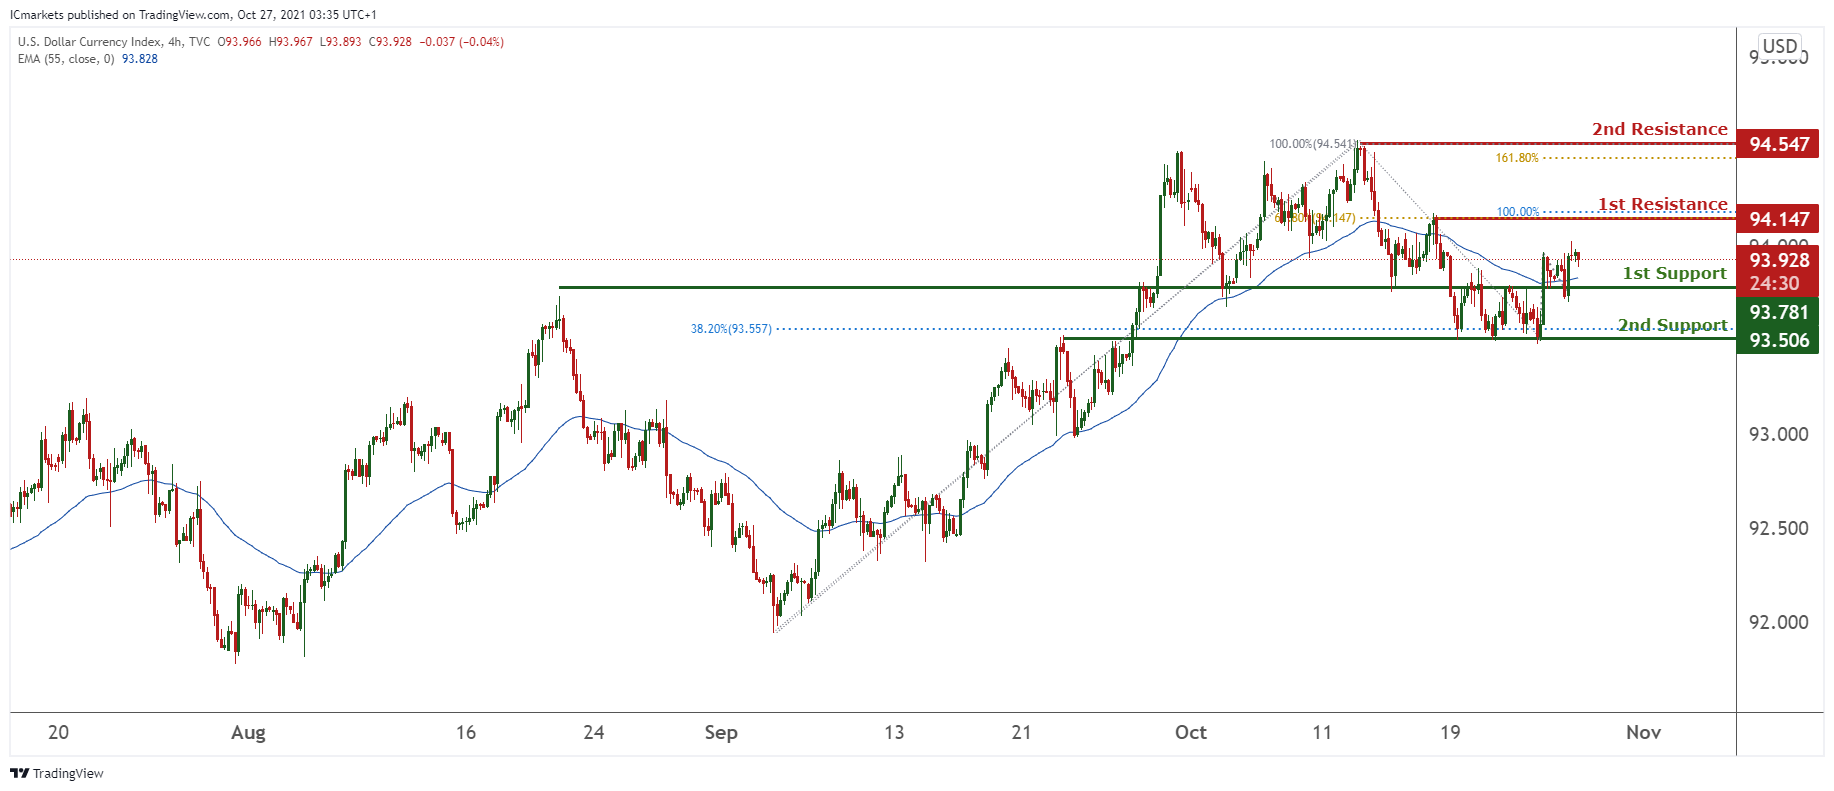
DXY:
On the H4 timeframe, prices are on a bullish momentum. Prices could potentially climb from our 1st support at 93.781 towards our 1st resistance at 94.147 in line with 100% Fibonacci extension and 61.8% Fibonacci retracement. Technical indicators are showing bullish momentum. Alternatively, breaking our 1st support can find prices dipping towards our 2nd support at 93.506 in line with 38.2% Fibonacci retracement.
Areas of consideration:
- H4 time frame, 1st resistance at 94.147
- H4 time frame, 1st support at 93.781
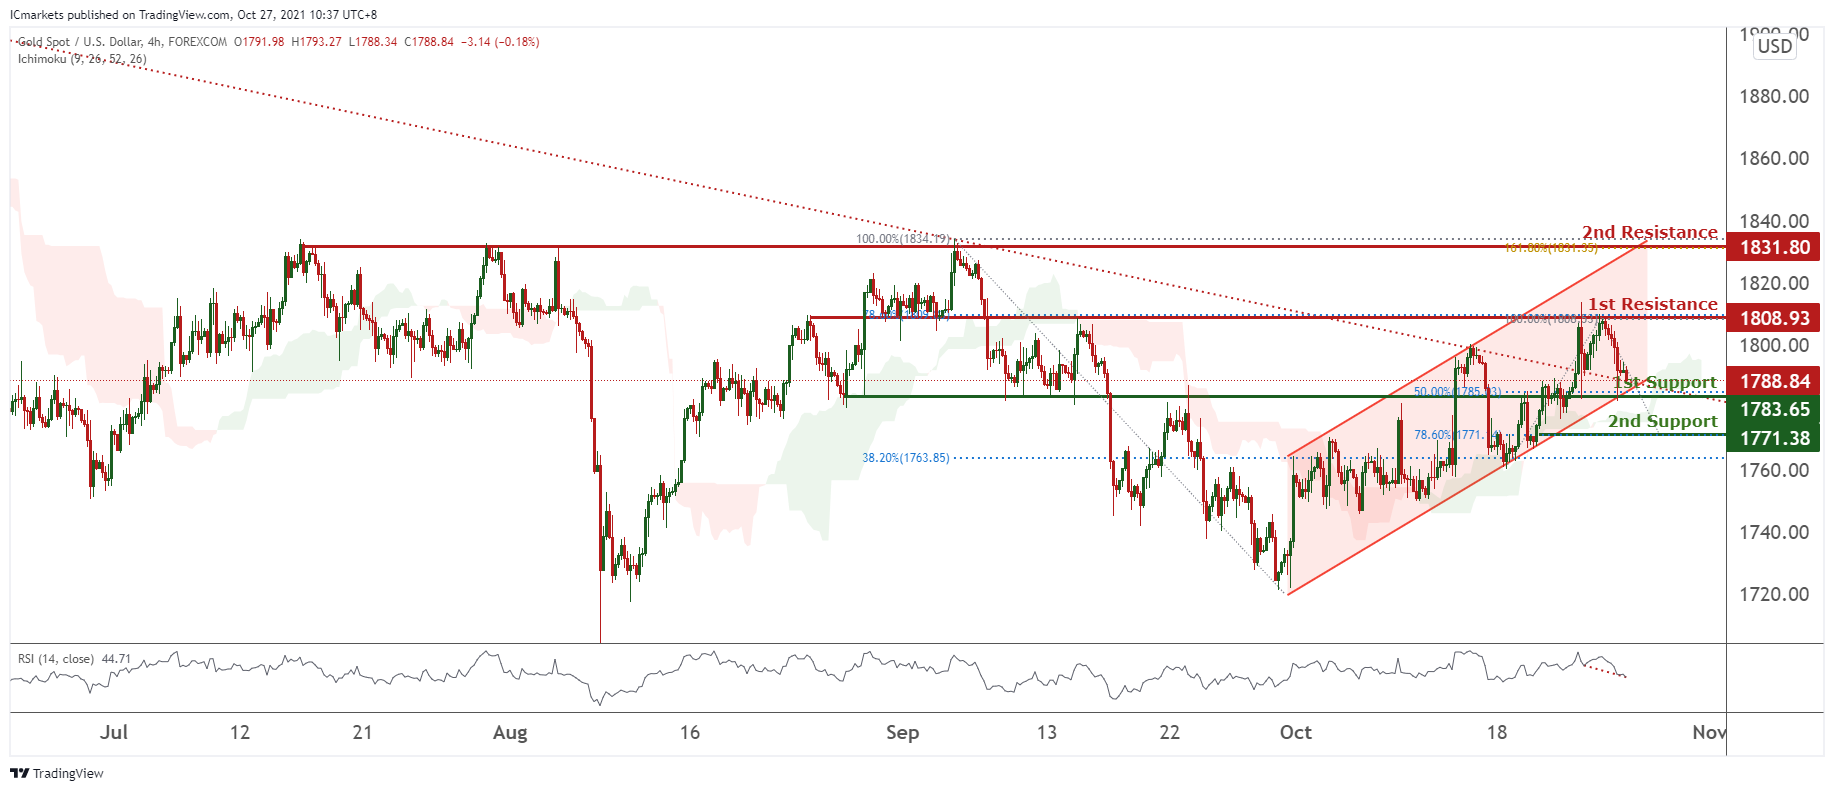
XAU/USD (GOLD):
On the H4 chart, prices are consolidating in a parallel channel and are currently retesting our bearish trendline and bottom of our bearish channel. We see a potential for prices to break the channel and also bearish trendline at our 1st support 1783.65 in line with 50% Fibonacci retracement and could potentially dip towards our 2nd support in line with 78.6% Fibonacci retracement at 1771.38. Bearish divergence is spotted in RSI.
Areas of consideration:
- 4h 1st support at 1783.65
- 4h 1st resistance at 1771.38
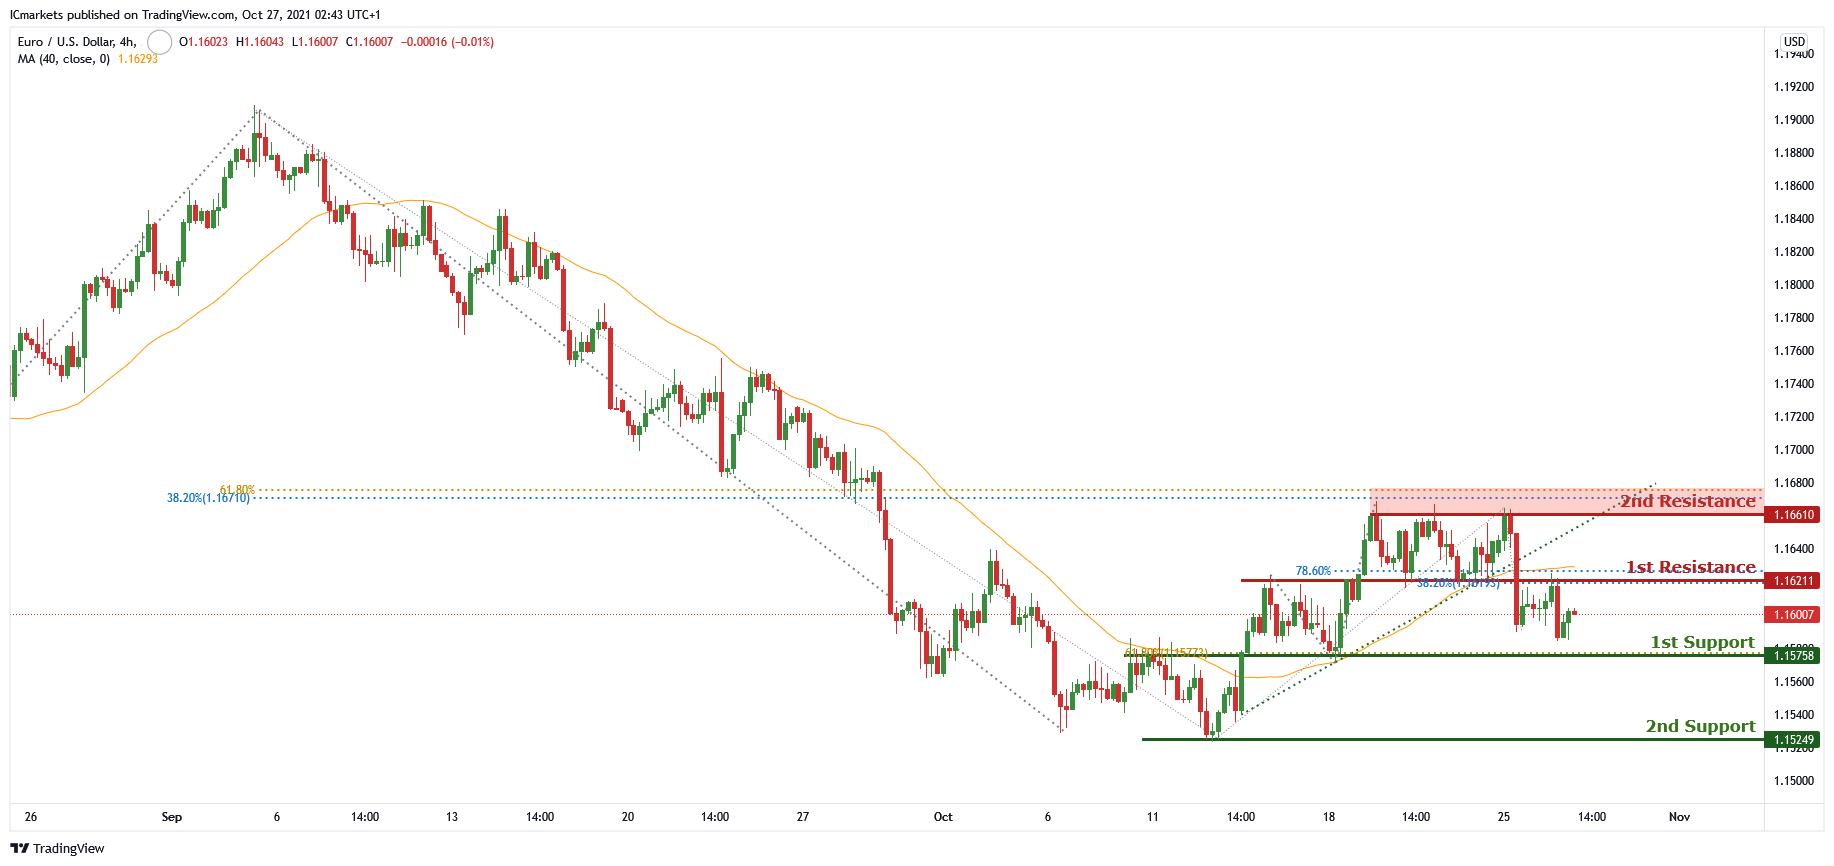
EUR/USD:
On the H4 chart , price has recently broken the ascending trendline and is looking for a retest at the first resistance level of 1.16224 which is also 38.2% retracement level and 61.8% projection level. If price were to fail the retest, price can potentially dip back to the first support level of 1.15758 which is also 61.8% Fibonacci retracement and graphical overlap support level. Our bearish bias is supported by the moving average indicator as price is trading under it
Areas of consideration
H4 first support level – 1.15758
H4 first resistance level – 1.16211
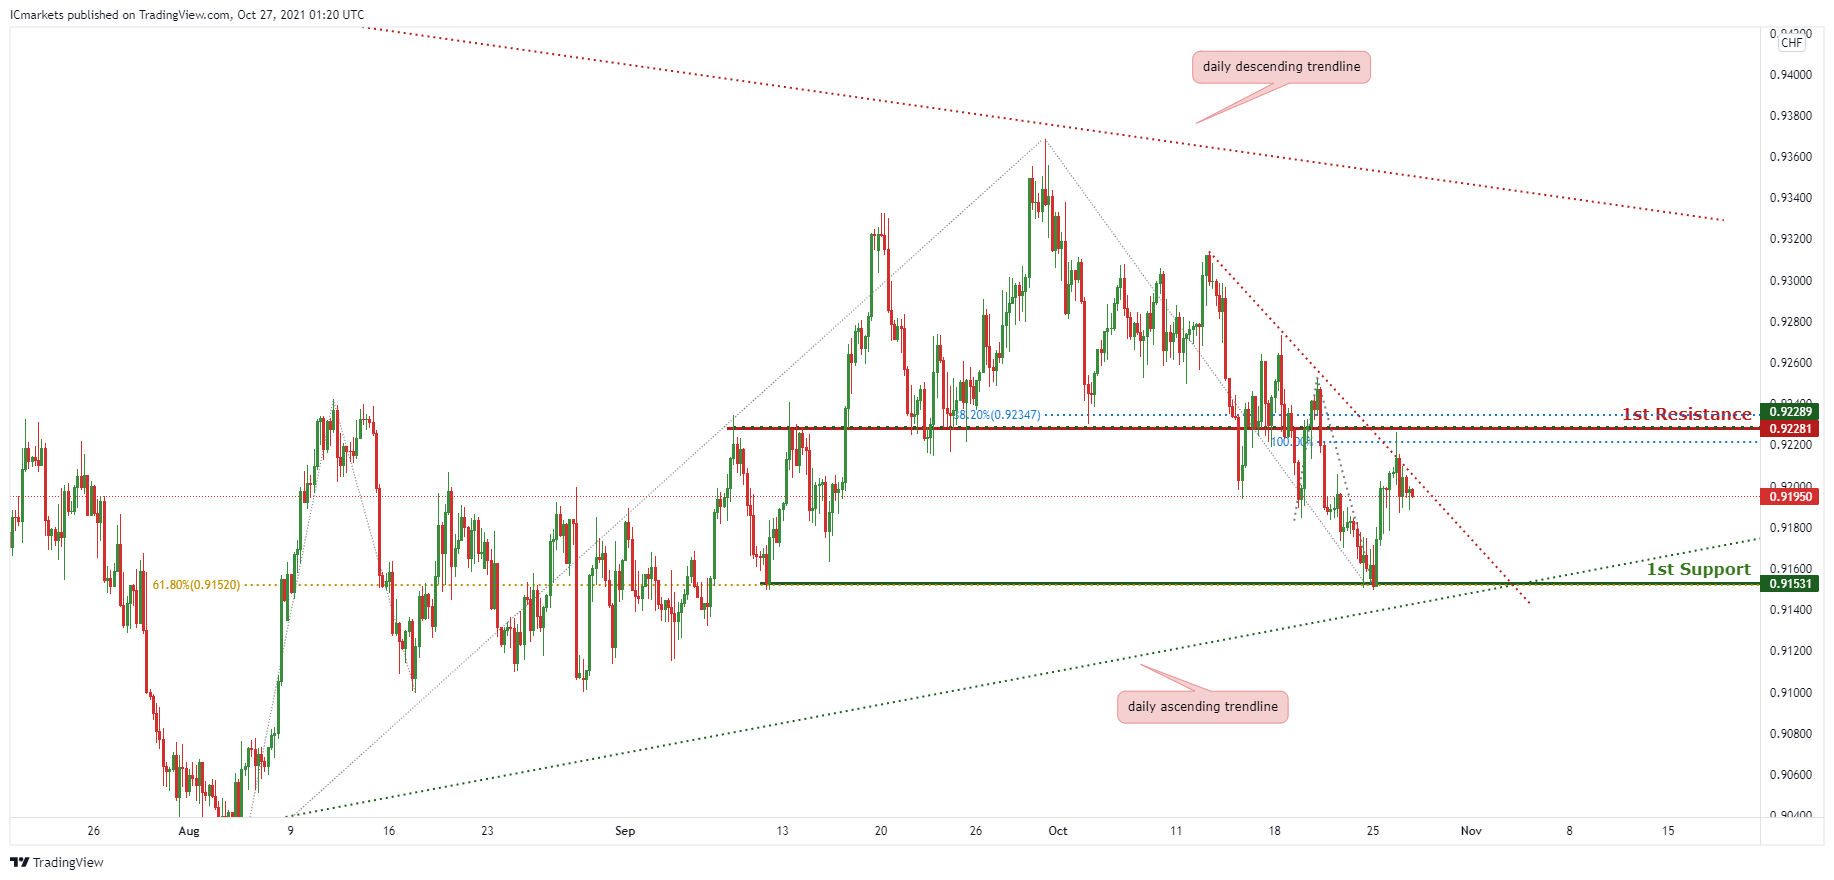
USD/CHF:
On the H4, price is seen to be reacting in a potential triangle. In reference to yesterday’s analysis, price was unable to break pass the small descending trendline resistance, hence we can expect price to drop further down to the 1st Support in line with 61.8% Fibonacci retracement.
Areas of consideration:
- Watch 1st Support at 0.91531
- Watch 1st Resistance at 0.92281
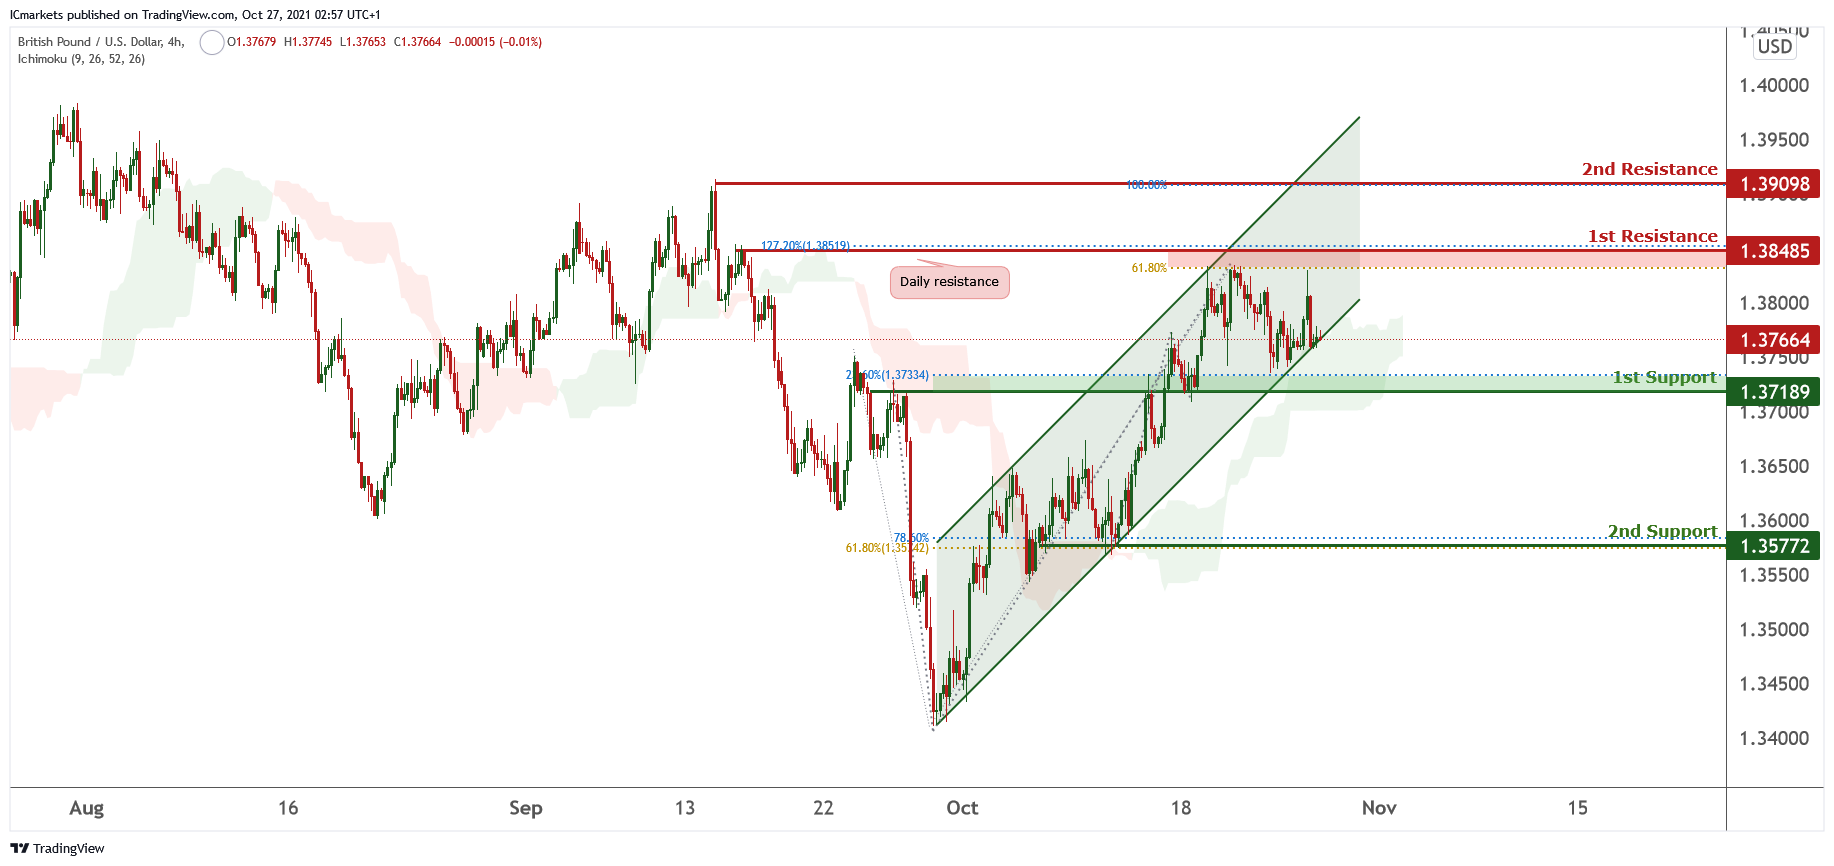
GBP/USD:
On the H4 chart, price is trading in an ascending channel and has recently bounced from the first support level of 1.37189 which is also Fibonacci retracement level 23.6%. Price can potentially rise to the first resistance level of 1.38485 which is also Fibonacci retracement 127.2% and 61.8% Fibonacci projection.The first resistance is also the daily resistance . Our bullish bias is further supported by the Ichimoku cloud indicator as price is trading above it
Areas of consideration :
1st support – 1.37189
1st resistance – 1.38485
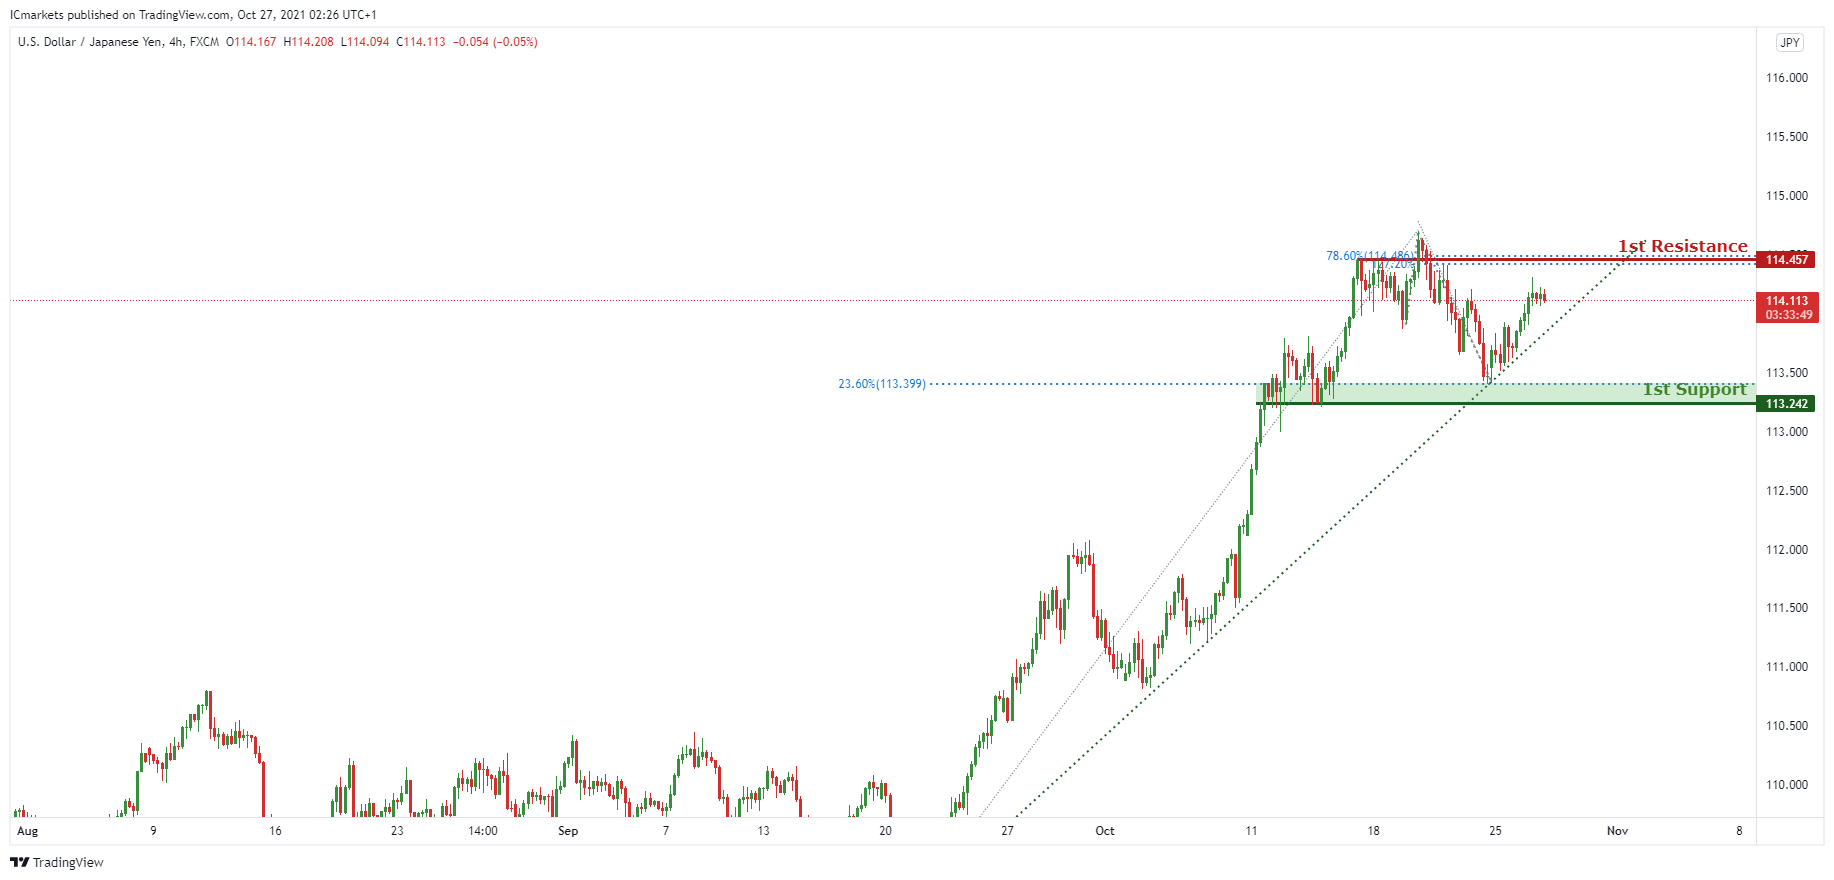
USD/JPY
On the H4 timeframe, price is still abiding to the ascending trendline support showing a bullish momentum continuation. Price is currently in between the 1st Support in line with 23.6% Fibonacci retracement and 1st Resistance in line with 78.6% Fibonacci retracement and 127.2% Fibonacci projection. We should watch closely for these levels where prices might swing higher or lower.
Areas of consideration:
- H4 1st resistance level 114.457
- H4 1st support level 113.242
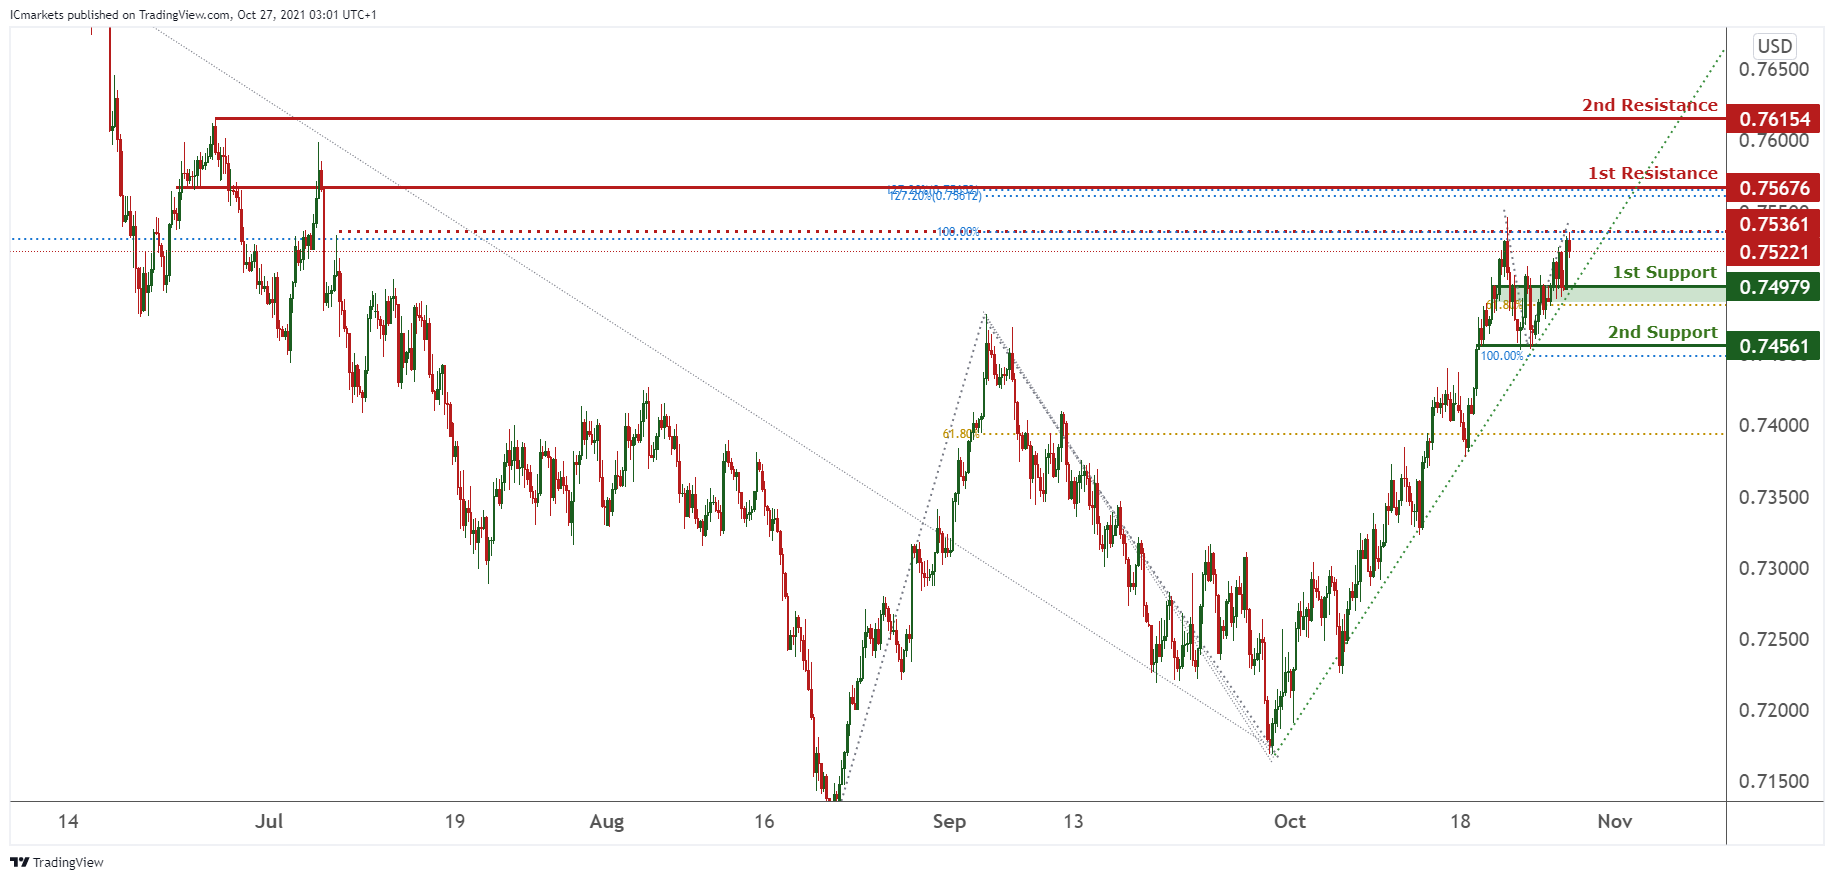
AUD/USD:
On the H4, we can see that price is reacting in between the 1st Resistance and 1st Support. Price is reacting in between 1st Resistance and 1st Support, price would have a further upside if it pushes pass intermediate resistance in line with 100% Fibonacci projection and 50% Fibonacci retracement price would have further upside to 1st resistance in line with graphical overlap resistance, 127.2 % Fibonacci retracement and 127.2% Fibonacci projection. Our current bias is neutral, waiting for price to swing higher or lower for a better entry.
Areas of consideration:
- H4 1st resistance level 0.75676
- H4 1st support level 0.74979
NZD/USD:
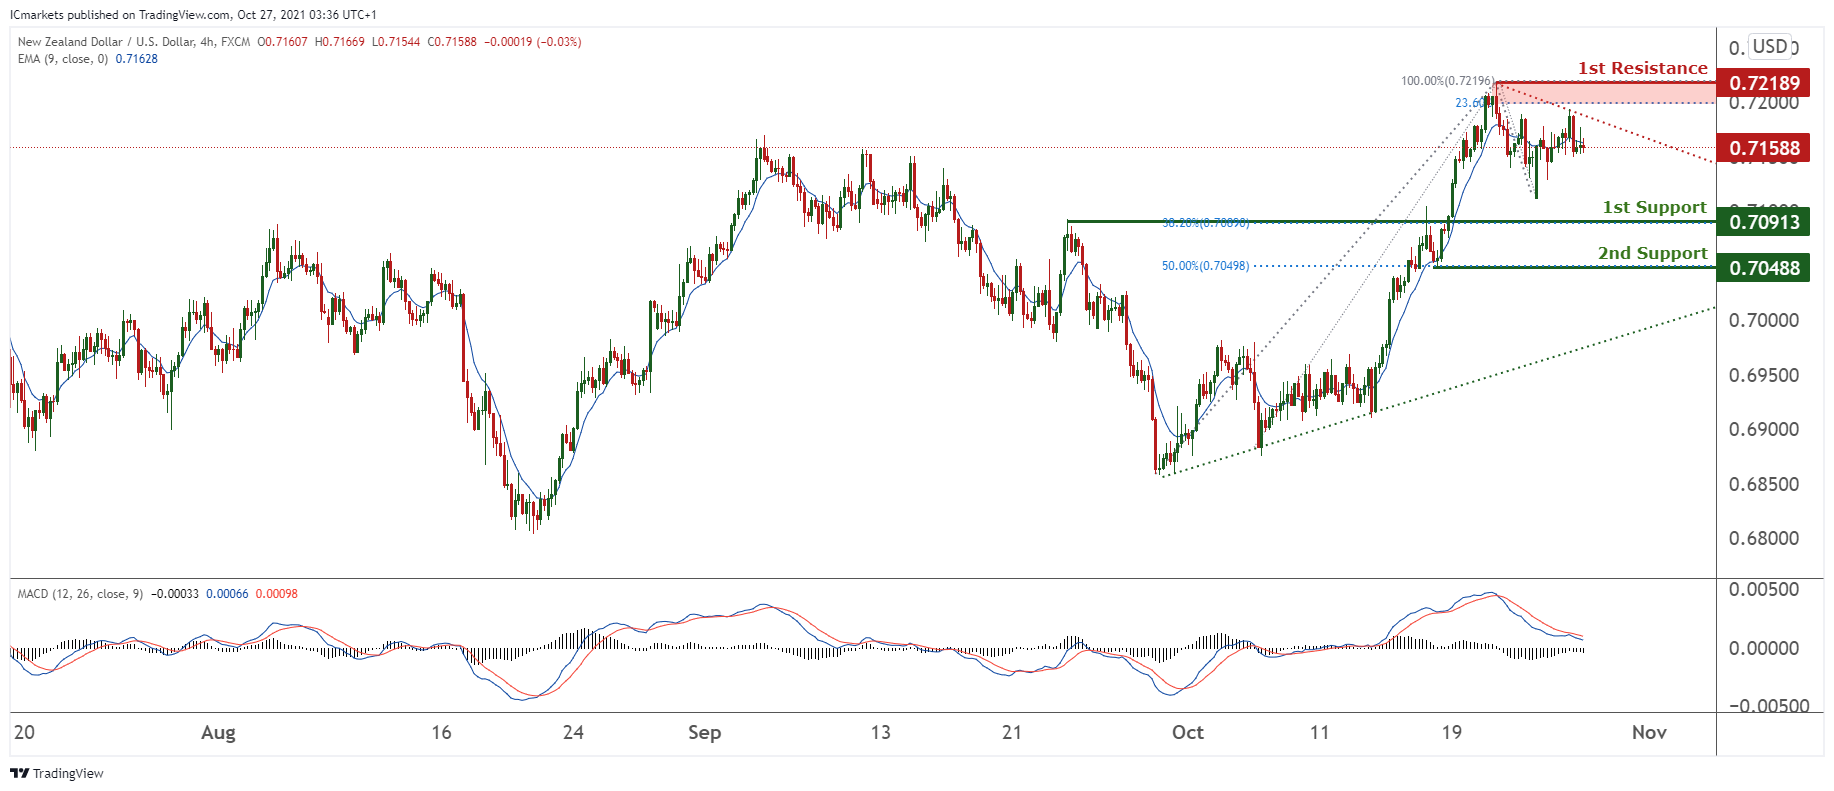
On the H4 timeframe, prices are on a bearish momentum. We see the potential for a pullback from our 1st resistance at 0.72189 which is a swing high and potentially dip towards our 1st support at 0.70913 which is a graphical overlap in line with 38.2% Fibonacci retracement. Technical indicators are showing bearish momentum. Alternatively, breaking our 1st support at 0.70913 might find prices dipping towards our 2nd support at 0.70488 in line with 50% Fibonacci retracement.
Areas of consideration:
- H4 time frame, 1st resistance at 0.72189
- H4 time frame, 1st support at 0.70913
USD/CAD:
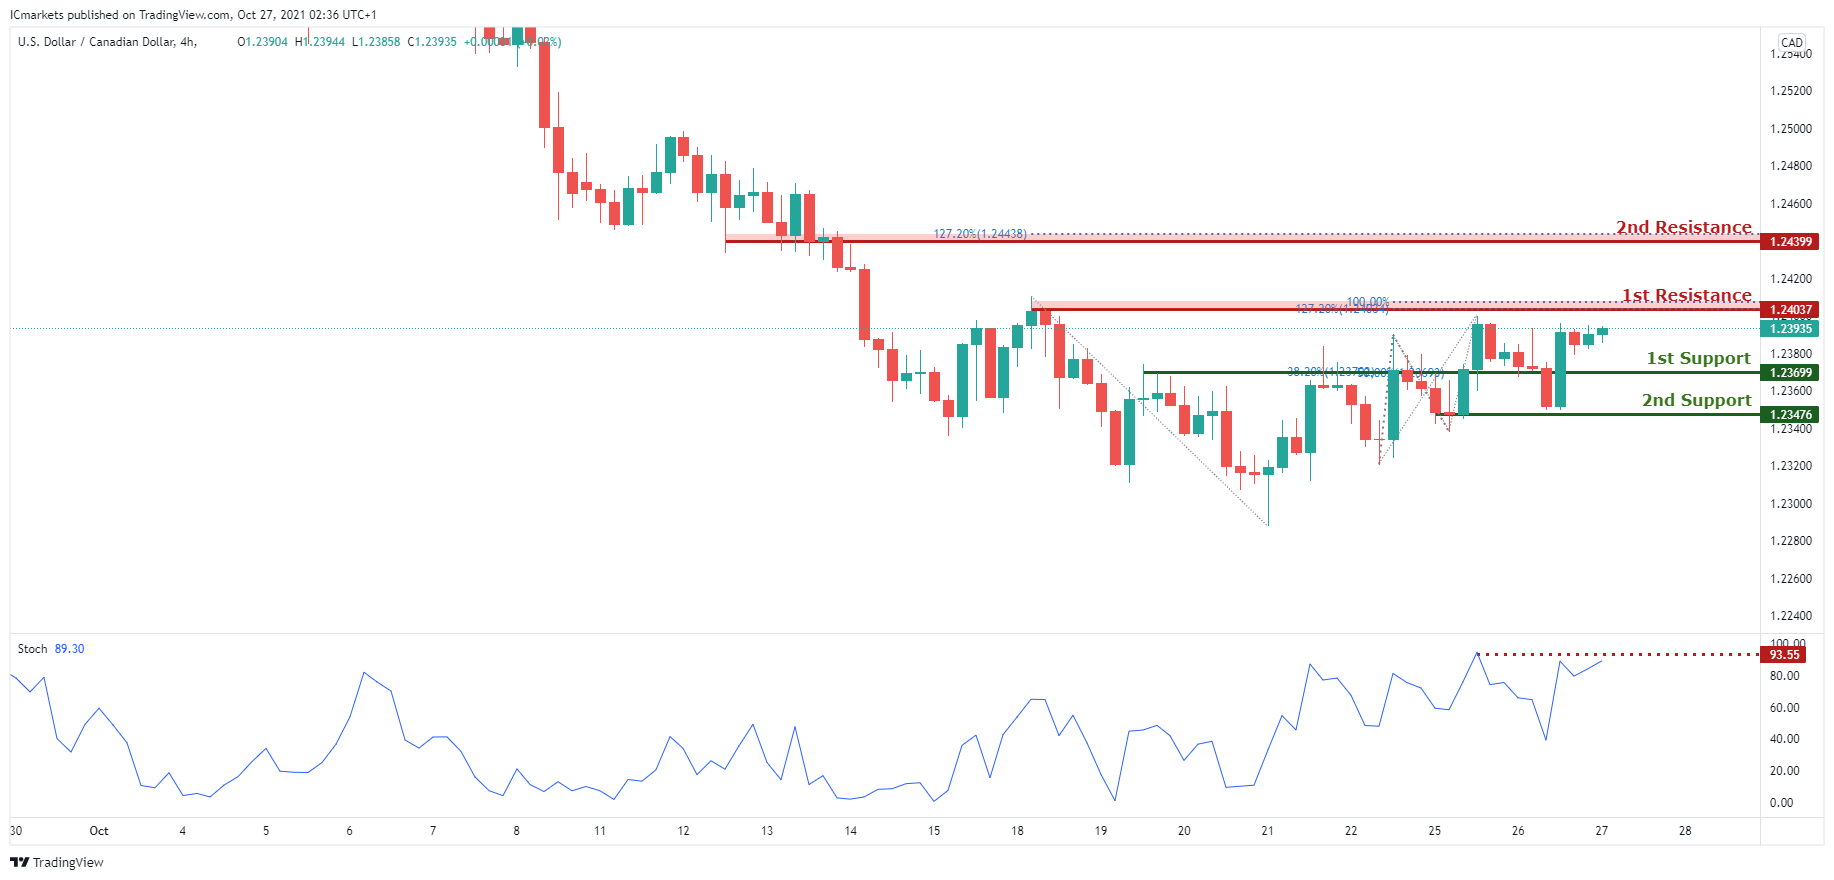
On the H4, with stochastics approaching resistance, we are expecting to see price do a drop from 1st resistance at 1.24112 in line with the 127.2% Fibonacci extension, 78.6% Fibonacci projection and graphical swing high resistance to 1st support at 1.23699 in line with the 38.2% and 50% Fibonacci retracement and confluent to our graphical overlap support. Alternatively, price may break 1st resistance and head for 2nd resistance at 1.24399 in line with the 50% Fibonacci extension level and graphical overlap resistance.
Areas of consideration:
- H4 time frame, support at 23699
- H4 time frame, resistance at 24112
OIL:
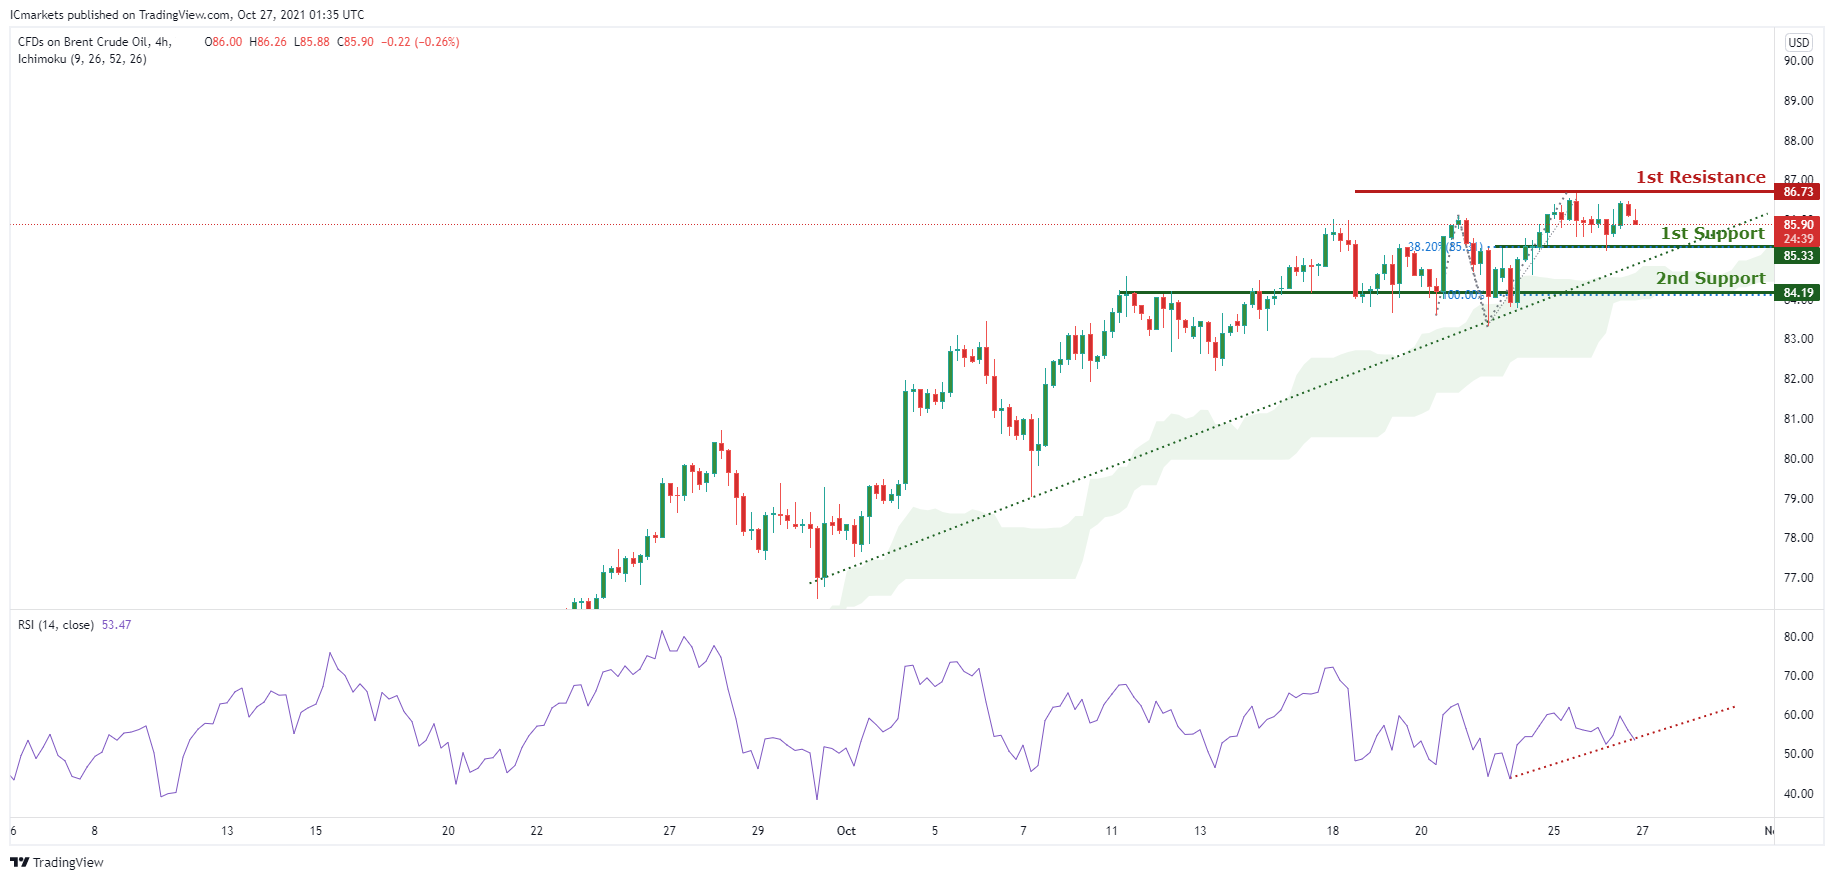
On the H4 timeframe,with the ichimoku indicator and upwards trend line showing bullish momentum, we are expecting to see price bounce off 1st support at 85.33 in line with the 38.2% Fibonacci retracement level and graphical overlap support to 1st resistance ta 86.73 in line with the graphical swing high resistance.. Alternatively, price may break 1st support and head for 2nd support at 84.16 in line with the 100% Fibonacci projection level and graphical overlap support.
Areas of consideration:
- H4 time frame, 1st resistance of 73
- H4 time frame, 1st support of 33
Dow Jones Industrial Average:
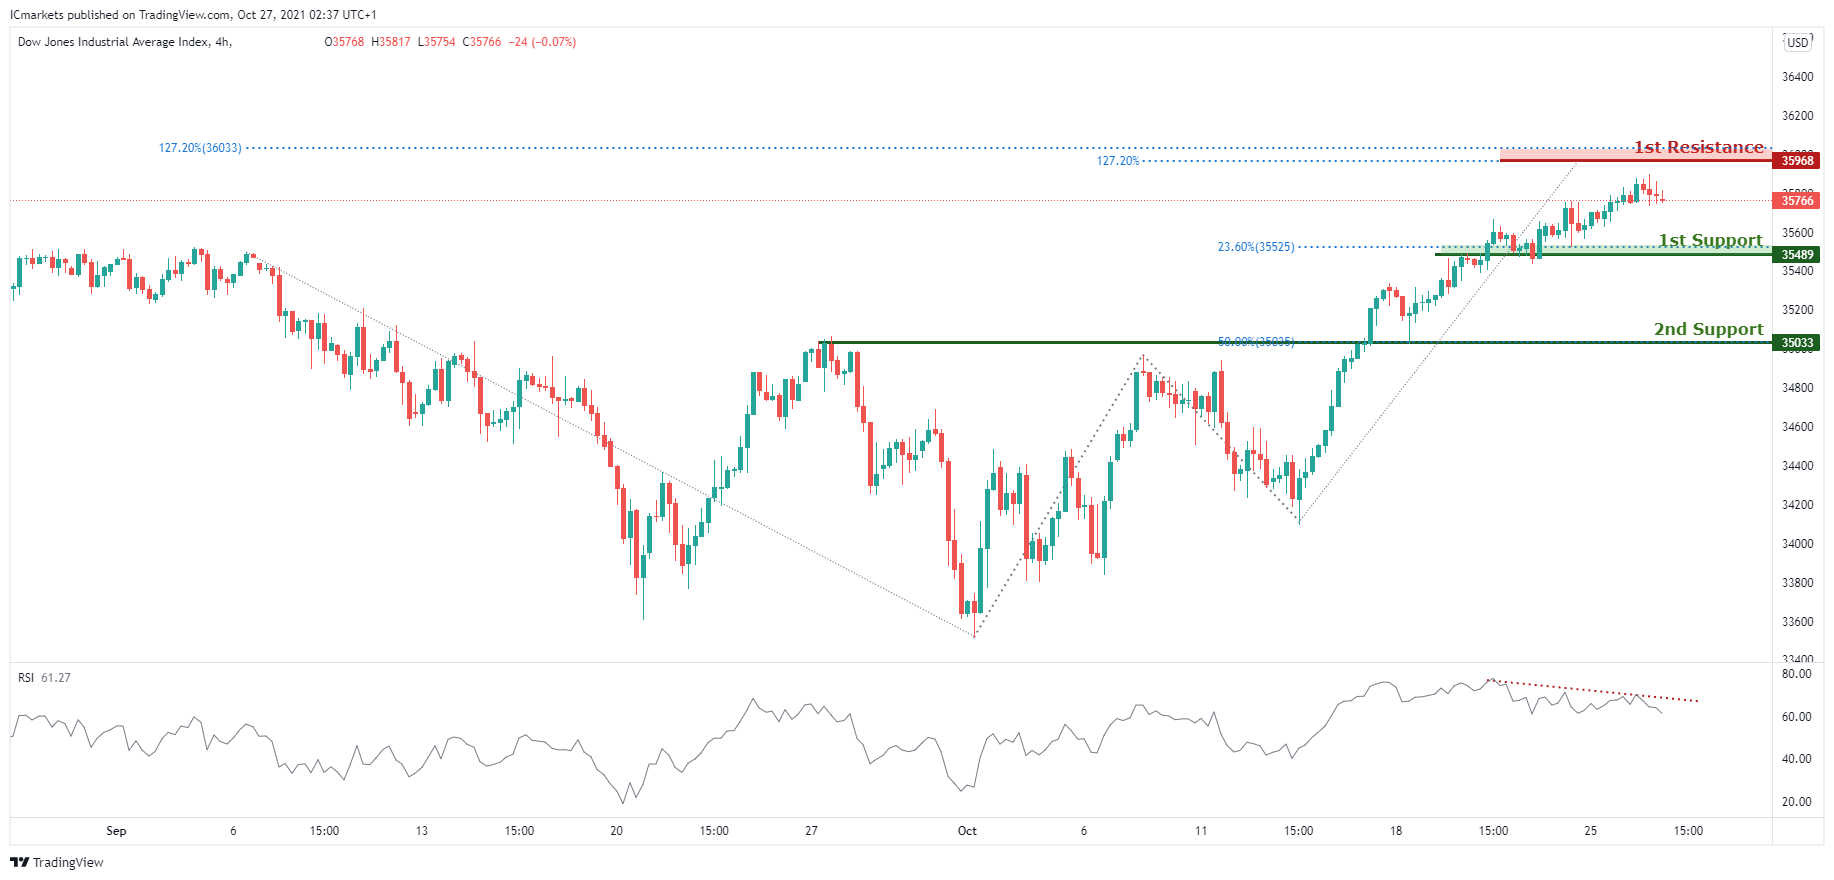
On the H4, we are expecting for price to fall from 1st resistance at 35968 in line with two 127.2% Fibonacci extension levels to 1st support at 35489 in line with the 23.6% Fibonacci retracement confluence to the RSI indicator. Alternatively, we may see price break 1st support and head for 2nd support at 35033 in line with the 50% Fibonacci retracement and graphical swing low.
Areas of consideration:
- 4H resistance at 35968
- 4H support at 35489
The accuracy, completeness and timeliness of the information contained on this site cannot be guaranteed. IC Markets does not warranty, guarantee or make any representations, or assume any liability regarding financial results based on the use of the information in the site.
News, views, opinions, recommendations and other information obtained from sources outside of www.icmarkets.com.au, used in this site are believed to be reliable, but we cannot guarantee their accuracy or completeness. All such information is subject to change at any time without notice. IC Markets assumes no responsibility for the content of any linked site.
The fact that such links may exist does not indicate approval or endorsement of any material contained on any linked site. IC Markets is not liable for any harm caused by the transmission, through accessing the services or information on this site, of a computer virus, or other computer code or programming device that might be used to access, delete, damage, disable, disrupt or otherwise impede in any manner, the operation of the site or of any user’s software, hardware, data or property.