
EUR/USD:
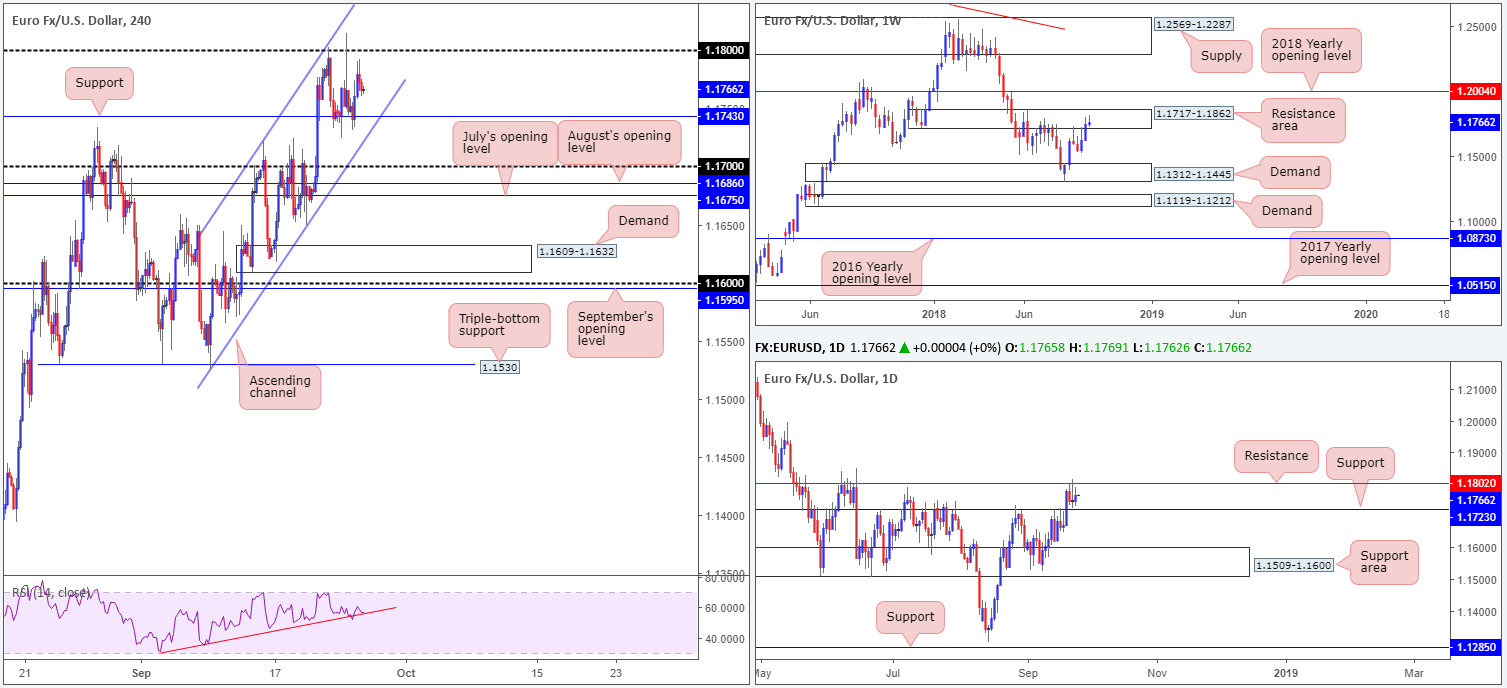
Despite eking out marginal gains on Tuesday, the single currency remains fixed between its 1.18 handle and H4 support at 1.1743. However, it is worth noting (on the H4 scale) price is also compressed within a H4 ascending channel formation (1.1525/1.1721) and the RSI indicator continues to hug trend line support.
The daily timeframe is visibly sandwiched between resistance at 1.1802 and support priced in at 1.1723. In addition to this, our technical studies show sellers may have the upper hand on the weekly scale as price recently shook hands with a notable resistance area coming in at 1.1717-1.1862.
On the data front, US consumer confidence rose to an 18-year high at 138.4, though failed to generate much movement. ECB’s Praet also hit the wires and stated there was nothing new in ECB Draghi’s speech on Monday. Praet noted it will take months before higher wages lift inflation as things are moving slowly, but in the right direction.
Areas of consideration:
Having seen minimal change to structure on Tuesday, the forecast remains unchanged.
A long from the current H4 support, or even the 1.17 neighborhood seen below it, is faced with overhead pressure from higher-timeframe resistances highlighted above. For that reason, buying this market will likely be akin to swimming against the tide at this time.
Selling beyond the current H4 support, though in-line with higher-timeframe direction, unfortunately presents a collection of nearby H4 supports to contend with (1.17 handle and two monthly opening levels [July’s opening level at 1.1675 August’s opening level at 1.1686]), making it a difficult sell, in our humble view.
On account of the above reading, conditions appear restricted in this market ahead of today’s FOMC rate decision and press conference, where a 25bps rate hike is expected. Opting to remain on the sidelines until after the Fed has had its way is, therefore, likely the better path to take right now.
Today’s data points: FOMC rate decision and press conference.
GBP/USD:
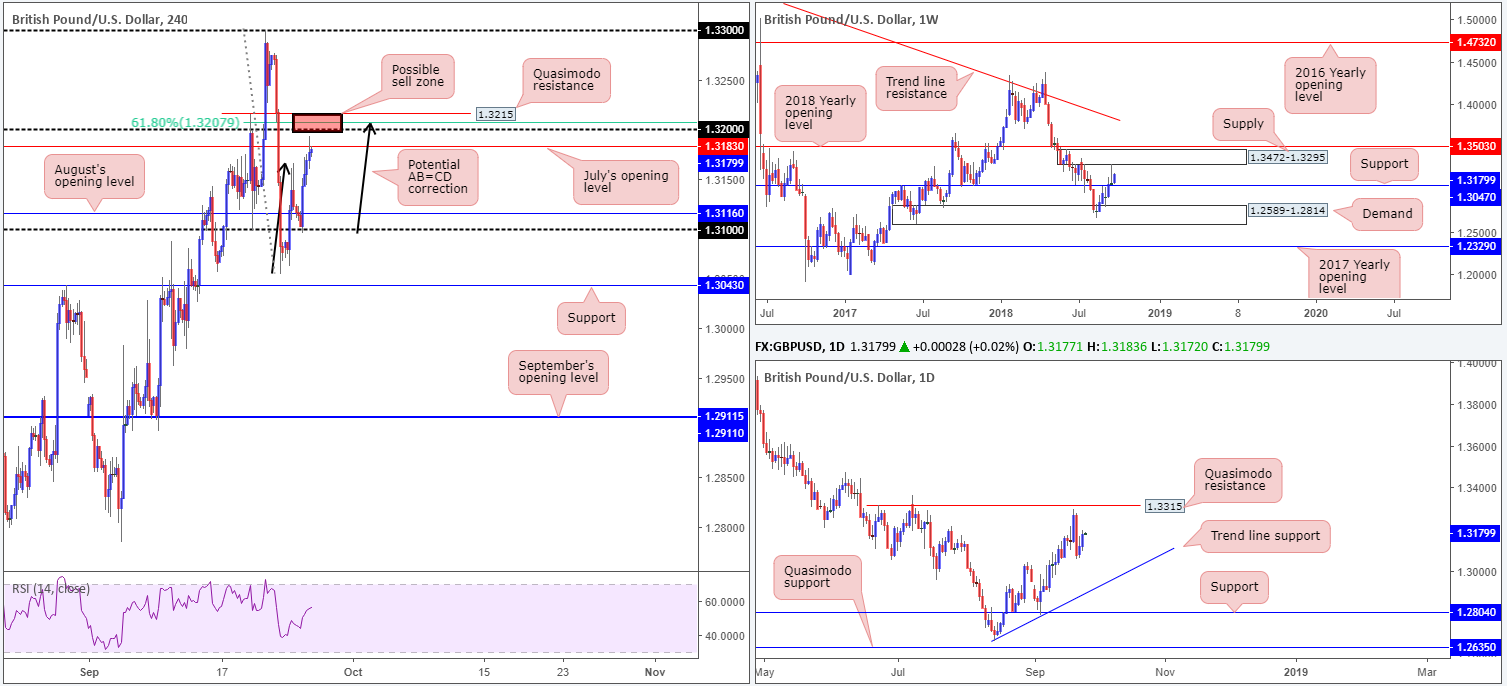
Over the course of Tuesday’s sessions, the British pound advanced against its US rival to weekly highs of 1.3193. Following a near-pip-perfect response off its 1.31 handle on the H4 timeframe amid early London hours, the pair forced through Monday’s high of 1.3166 and touched gloves with July’s opening level positioned at 1.3183.
Traders may also want to acknowledge the potential H4 AB=CD formation in view that completes a few pips above the 1.32 handle (black arrows). Note the approach terminates within striking distance of a 61.8% Fib resistance value at 1.3207 and a H4 Quasimodo resistance level plotted at 1.3215.
Against the backdrop of intraday flow, the daily timeframe exhibits potential to press as far south as trend line support (etched from the low 1.2661), and as high as a Quasimodo resistance at 1.3315. In terms of the weekly timeframe, support rests at 1.3047 and supply enters the fray around the 1.3472-1.3295 region.
Areas of consideration:
With direction on the high timeframes lacking in terms of notable structure at the moment, focus is drawn to 1.3215/1.32 on the H4 timeframe this morning (red zone). As stated above, the area is a combination of a Quasimodo resistance level, a key Fibonacci ratio, a round number and a potentially strong AB=CD approach.
Given 1.3215/1.32 is somewhat small, waiting for a H4 bearish candlestick formation to confirm the zone may be an idea before pulling the trigger. This will help avoid falling victim to a fakeout. Ultimately, the risk/reward from this base is attractive, with the first take-profit target set around August’s opening level at 1.3116.
Today’s data points: FOMC rate decision and press conference.
AUD/USD:
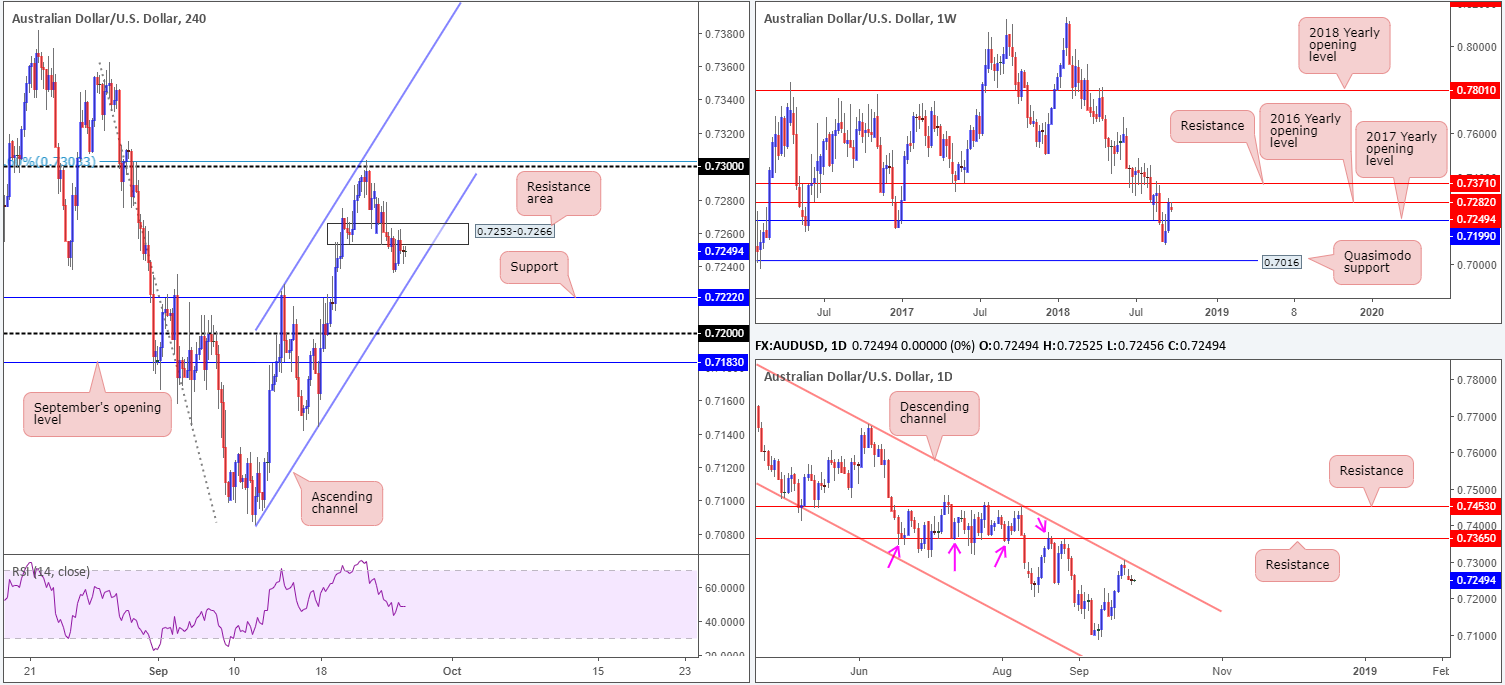
The AUD/USD is seen shuffling its feet beneath H4 demand at 0.7253-0.7266 (now acting resistance area) as broader markets buckle down ahead of today’s FOMC rate decision and press conference, where a 25bps rate hike is expected. The US-China trade dispute also continues to be a major sticking point for the Antipodeans, with investor confidence knocked back as times goes on.
Intraday support is seen nearby in the form of a H4 channel line (extended from the low 0.7085), shadowed closely by H4 support at 0.7222 and then the 0.72 handle. On a wider perspective, however, key resistance is clearly in play on the weekly timeframe at 0.7282: the 2016 yearly opening level, with the next downside objective seen at 0.7199: the 2017 yearly opening level. Alongside this, traders may also want to acknowledge daily price fading a long-term channel resistance (penciled in from the high of 0.8135). Technically speaking, this is enough to encourage further downside in this market.
Areas of consideration:
In terms of tradable opportunities, the market offers limited space to maneuver. Stop-loss orders are likely filled beneath 0.7253-0.7266 on the H4 timeframe, and downside is free to cross paths with the aforementioned H4 channel support. What lacks is the room to profit from this! We have less than ten pips between the two above said barriers. Even beyond this channel formation, support is seen positioned close by!
As far as we can see, the higher timeframes portend lower prices, though the H4 lacks space to work. With this in mind, remaining on the sidelines until post FOMC appears the safer route to take right now as this may open up a path on the H4 scale.
Today’s data points: FOMC rate decision and press conference.
USD/JPY:
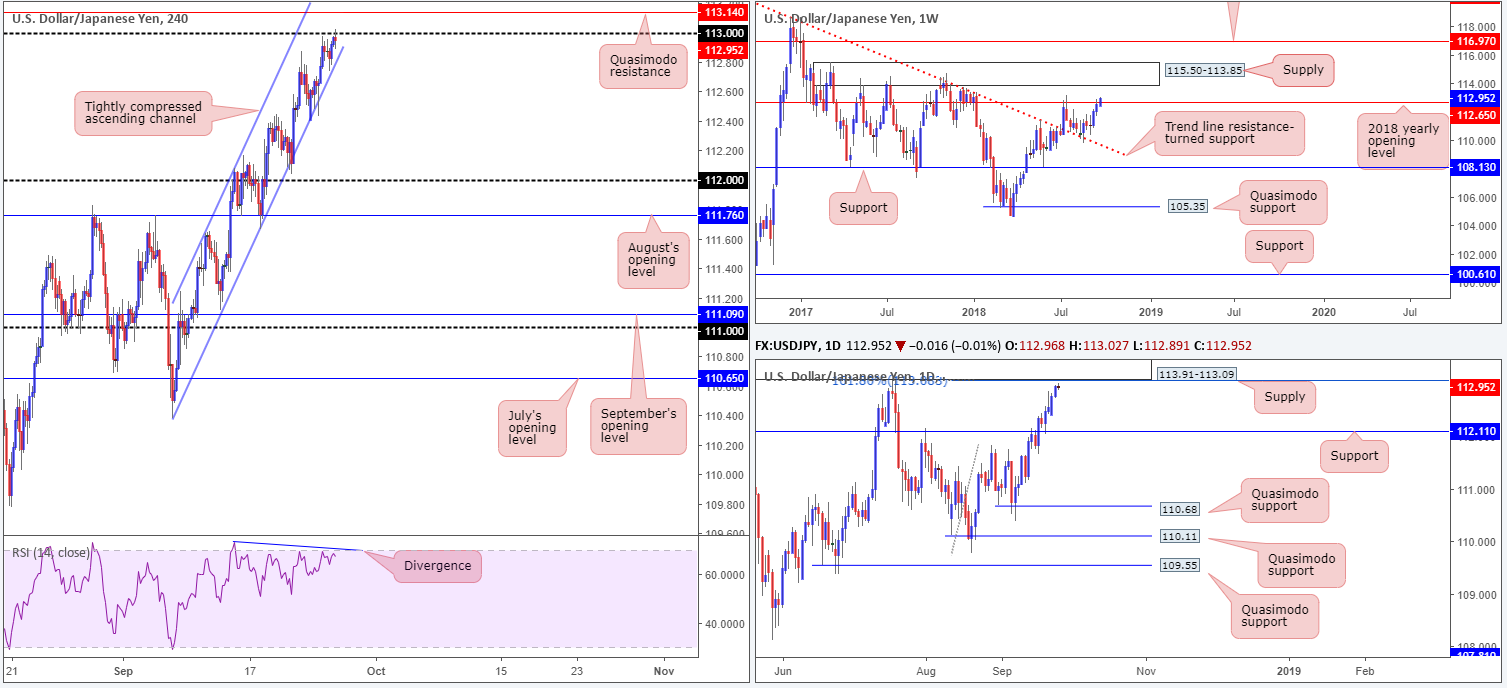
Although the US dollar index failed to sustain gains on Tuesday, the USD/JPY concluded its session recording its highest daily close in more than 2 months. Since the beginning of this month, the H4 candles have been advancing northbound within the walls of a tightly compressed ascending channel (110.38/111.43).
Of late, the pair shook hands with its 1.13 handle, which, as you can probably see, is located a few pips beneath a H4 Quasimodo resistance at 113.14. Also exposed around this neighborhood is the underside of daily supply at 113.91-113.09 (merges with a 161.8% Fib ext. point at 113.08), which happens to be glued to the underside of a major weekly supply zone penciled in at 115.50-113.85. It may also be worth noting the RSI indicator on the H4 timeframe remains loitering beneath its overbought value, and is seen drawing up a strong divergence reading at the moment.
Areas of consideration:
The lower edge of daily supply at 113.09 (along with its converging 161.8% Fib ext. point at 113.08), the 113 handle and Quasimodo resistance at 113.14 on the H4 timeframe is of interest this morning. Combined, the zone provides an area to work with for potential short trades.
Due to the threat of further buying on the weekly timeframe beyond 112.65 (the 2018 yearly opening level), waiting for H4 price to chalk up a bearish candlestick formation from 113.14/113 before pulling the trigger is recommended. Not only will this display seller intent, it’ll offer traders a level to enter from and a position to place stop-loss orders. As for take-profit targets, we would ultimately like to see the pair reach as far south as daily support at 112.11, followed closely by the 112 handle on the H4.
Today’s data points: FOMC rate decision and press conference.
USD/CAD:
Coming in from the top this morning, the market shows weekly price hovering just north of a trend line resistance-turned support (extended from the high 1.4689), following back-to-back weeks of dominant selling. This barrier supported price once already back in late August, so there’s a chance we may see history repeat itself.
Daily movement, on the other hand, is checking in with a notable resistance level priced in at 1.2965. Yesterday’s action, as you can see, chalked up a clear-cut indecision candle around this neighbourhood. Selling from this point has the support level at 1.2815 to target, whereas a move above the current resistance has channel resistance (extended from the high 1.3386) in view.
A closer look at price action on the H4 timeframe brings our attention towards resistance seen at 1.2980, which fuses with a 50.0% resistance value at 1.2974 and a trend line resistance (etched from the high 1.3226).
Areas of consideration:
From an intraday perspective, traders are likely honing in on the H4 resistance mentioned above at 1.2980 today, specifically the green area where the noted H4 structures intersect. An ideal scenario would be for H4 price to print a bearish pin-bar formation off this zone (stops can be positioned beyond this structure), closing beneath the nearby daily resistance level at 1.2965. This, by and of itself, would likely be enough to pull the pair back towards 1.29.
Waiting for a candlestick formation to prove seller intent off 1.2980 is required, in our view, due to the possibility of a move north being seen towards the key figure 1.30.
Today’s data points: FOMC rate decision and press conference; Crude oil inventories.

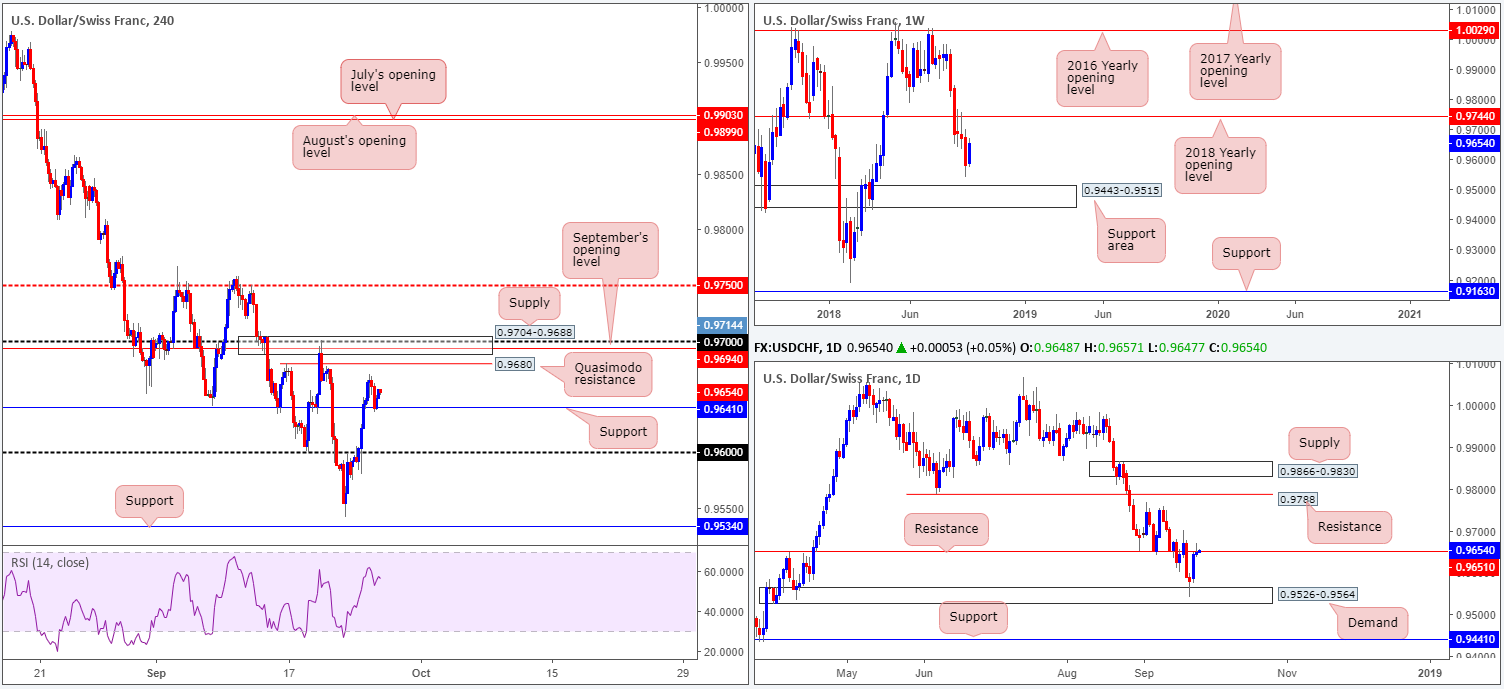
USD/CHF:
As the USD/CHF firmly kept itself on the winning side of the table on Monday, Tuesday’s action, albeit lackluster in comparison, modestly pulled back and retested the H4 resistance-turned support at 0.9641. Thus far, the level has bolstered the market, with a H4 Quasimodo resistance level seen at 0.9680 as the next upside target from here, followed closely by a H4 supply zone at 0.9704-0.9688.
Longer term, weekly price is trading mid-range between its 2018 yearly opening level at 0.9744 and a support area drawn from 0.9443-0.9515. Daily resistance at 0.9651, as is evident from the chart, remains in the fray despite an aggressive push to highs of 0.9670. Note yesterday’s activity produced a daily bearish pin-bar formation.
Areas of consideration:
On a wider perspective, weekly price suggests the pair could potentially swing either way, while daily action indicates a subtle bearish vibe at the moment.
Intraday focus remains on the H4 supply zone mentioned above at 0.9704-0.9688. The converging structure seen within its borders: the 0.97 handle and September’s opening level at 0.9694, and the nearby H4 Quasimodo resistance, is likely enough to produce a bounce. Stop-loss orders can be tucked above the area’s top edge around 0.9707ish, with the first take-profit target set at 0.9641: the noted H4 support level.
Today’s data points: FOMC rate decision and press conference.
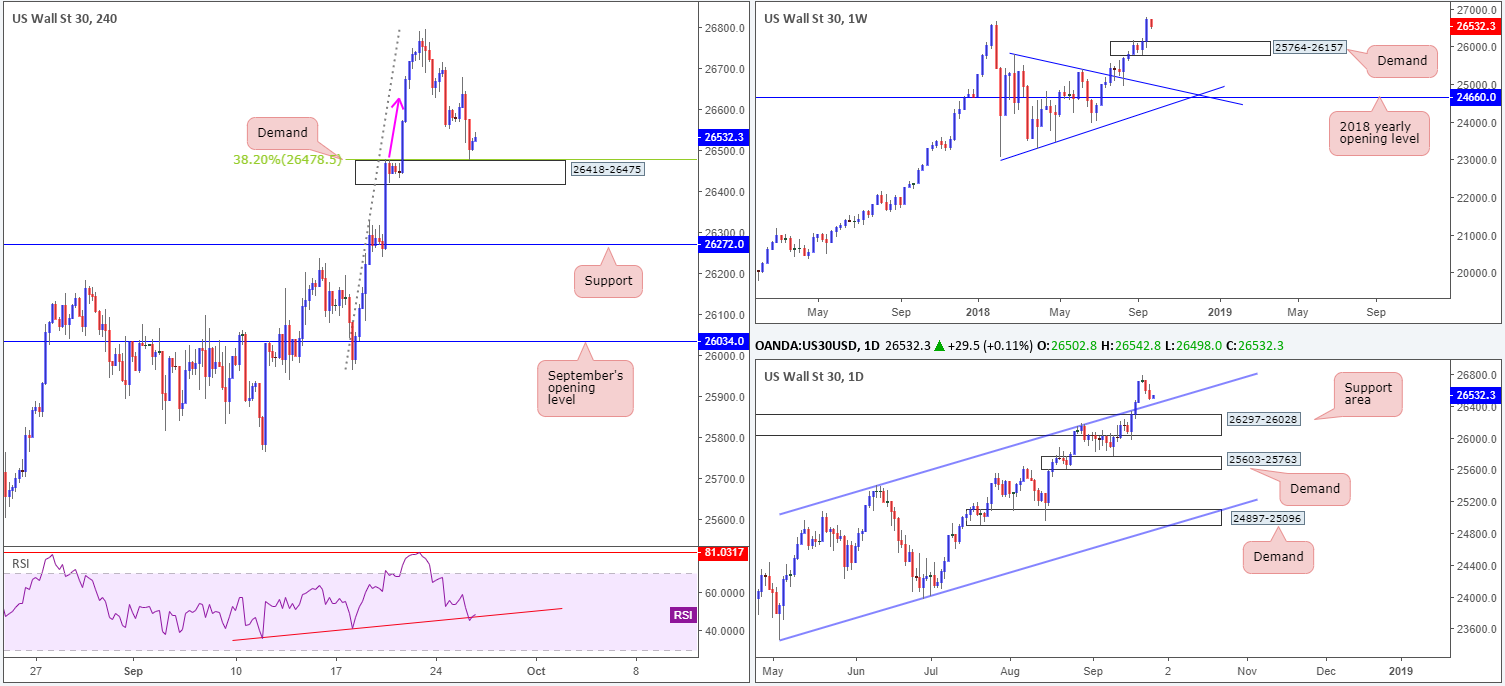
Dow Jones Industrial Average:
Despite upbeat consumer confidence out of the US, the Dow Jones Industrial Average penciled in its second consecutive losing day on Tuesday, pulling back from record highs of 26790.
According to the weekly timeframe, the index could potentially drop as far south as demand at 25764-26157 before signs of buying enter the fight. This demand, particularly on this scale, is considered the ‘decision point’ to break higher, and therefore commands attention. Turning the focus to the daily timeframe, however, the technicals still show the market could observe a pullback to the channel resistance-turned support (etched from the high 25385). A break of this barrier would likely lead to an approach towards the nearby support zone marked at 26297-26028.
H4 demand at 26418-26475, nevertheless, elbowed its way into the spotlight on Tuesday, and has so far held ground. Among the technical community, this area would be considered a robust demand given the momentum seen from its base (pink arrow). Aside from this, the area also dovetails nicely with a 38.2% H4 Fib support value at 26478, along with the H4 RSI indicator seen testing trend line support.
Areas of consideration:
As of writing, the H4 candles have yet to print anything noteworthy in terms of bullish candlestick formations from the current H4 demand. Due to the threat of weekly price pulling the unit lower, as well as daily price down towards its channel resistance-turned support (etched from the high 25385), a bullish candlestick pattern is required (ideally a H4 bullish pin-bar formation or engulfing pattern) to confirm the validity of the current H4 demand.
Should a pattern emerge, stops and entry are dictated according to its structure, with an initial take-profit target set around the 26639 neighbourhood.
Today’s data points: FOMC rate decision and press conference.
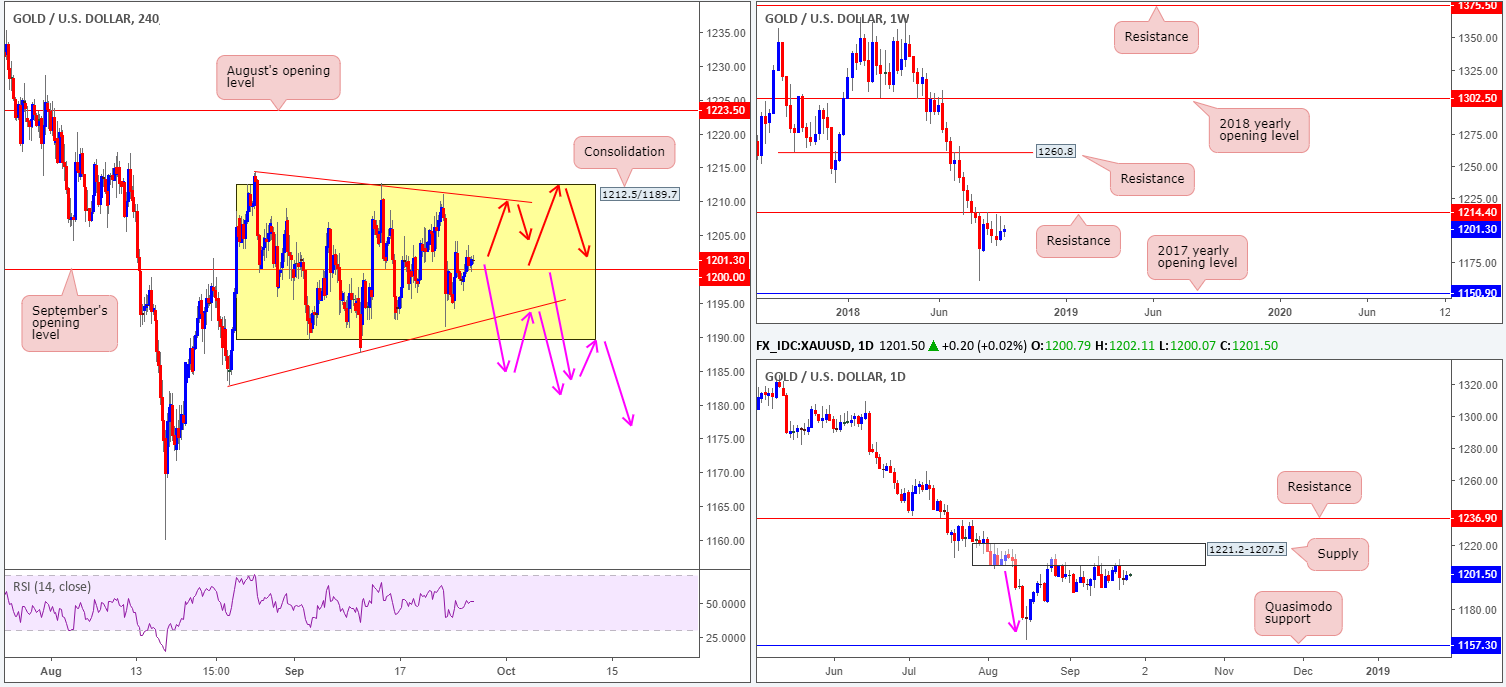
XAU/USD (Gold)
Another pretty much sideways day for the yellow metal on Tuesday, with very little in the way of fresh drivers.
Fixed around the underside of daily supply at 1221.2-1207.5, we can see the H4 candles continue to carve out a range between 1212.5/1189.7 (houses September’s opening level at 1200.0). Also eye catching on this scale is the converging trend lines (1182.9/1214.3), so far meeting the characteristics of a bullish pennant formation.
As you can see on the weekly timeframe, price remains languishing beneath a key resistance level coming in at 1214.4 in the shape of back-to-back bearish pin-bar formations. Further downside from this point could eventually stretch as far south as the 2017 yearly opening level at 1150.9.
As we know from the higher timeframes, the general bias (according to structure that is) is pointing in a southerly direction. Therefore, a breakout of the H4 range, and potential failure of the current H4 bullish pennant pattern, will likely occur.
Areas of consideration:
On account of the above conditions, two possible scenarios are worth noting:
- The most obvious: a breakout of the current H4 range/H4 trend line support to the downside. Following a H4 close beneath either area, a retest to the underside is certainly something to keep an eye open for as sellers may look to make an appearance here (see pink arrows). Traders are advised to wait and see if H4 price prints a bearish candlestick formation at the retest before considering a position short, since this will help avoid falling victim to fakeouts.
- Fade the upper edge of the current H4 range/trend line resistance (see red arrows). Like above, waiting for H4 price action to chalk up a bearish candlestick pattern off the top limit before pulling the trigger is recommended.
The use of the site is agreement that the site is for informational and educational purposes only and does not constitute advice in any form in the furtherance of any trade or trading decisions.
The accuracy, completeness and timeliness of the information contained on this site cannot be guaranteed. IC Markets does not warranty, guarantee or make any representations, or assume any liability with regard to financial results based on the use of the information in the site.
News, views, opinions, recommendations and other information obtained from sources outside of www.icmarkets.com.au, used in this site are believed to be reliable, but we cannot guarantee their accuracy or completeness. All such information is subject to change at any time without notice. IC Markets assumes no responsibility for the content of any linked site. The fact that such links may exist does not indicate approval or endorsement of any material contained on any linked site.
IC Markets is not liable for any harm caused by the transmission, through accessing the services or information on this site, of a computer virus, or other computer code or programming device that might be used to access, delete, damage, disable, disrupt or otherwise impede in any manner, the operation of the site or of any user’s software, hardware, data or property.


